Download as PDF, PPTX


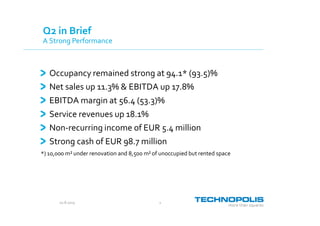
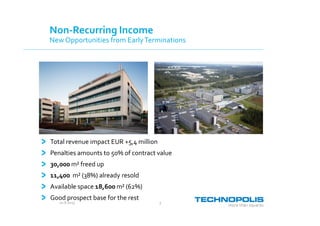
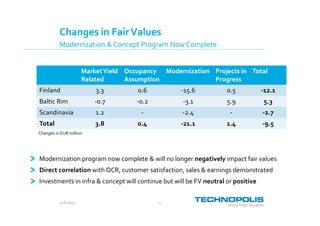
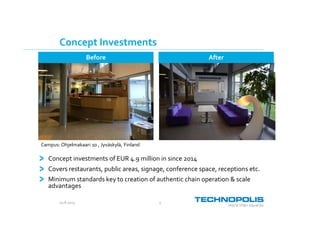
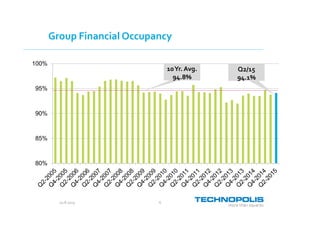
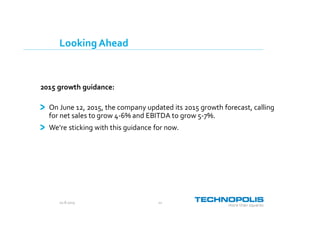

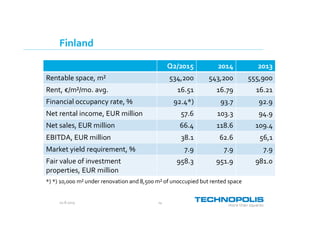
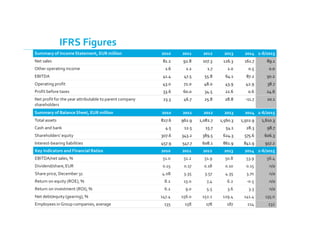

- The company had a strong second quarter performance in 2015 with occupancy remaining high at 94.1%, net sales up 11.3% and EBITDA up 17.8%. - Non-recurring income provided an additional EUR 5.4 million from early lease terminations. - The modernization program is now complete and will no longer negatively impact property values, with investments in concepts and infrastructure continuing. - The company is sticking to its 2015 guidance for 4-6% net sales growth and 5-7% EBITDA growth.


