Download to read offline


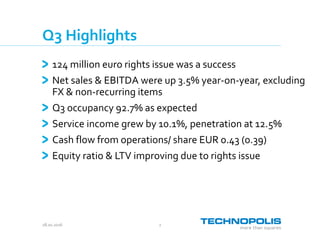

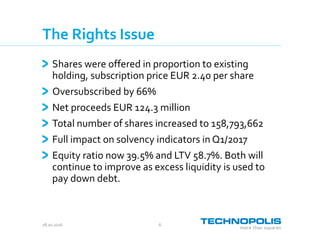
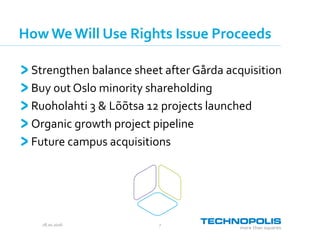


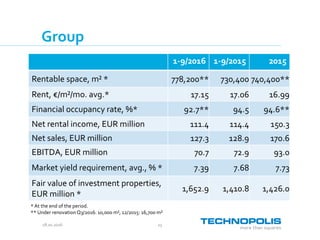
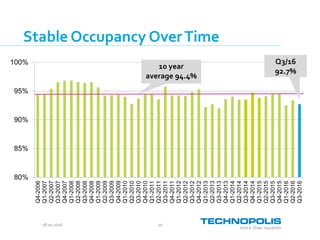


- The company reported positive Q3 results, with net sales and EBITDA up 3.5% excluding FX and non-recurring items. Occupancy was 92.7% as expected. - A 124 million euro rights issue was oversubscribed by 66% and will be used to strengthen the balance sheet after acquisitions and fund new projects. - Guidance for 2016 remains unchanged, with net sales and EBITDA expected to remain at 2015 levels (+/- 5%).


