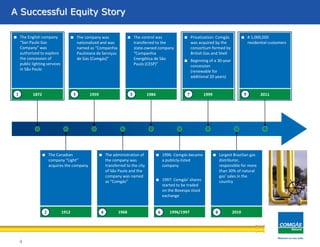
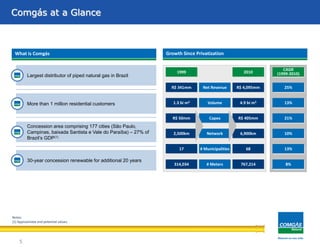
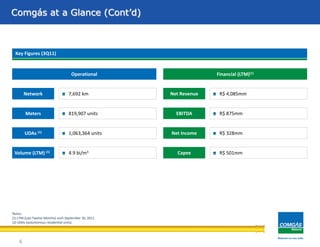
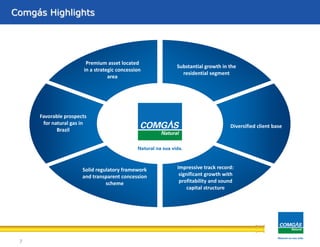
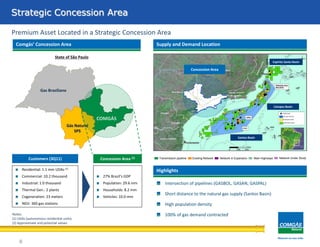
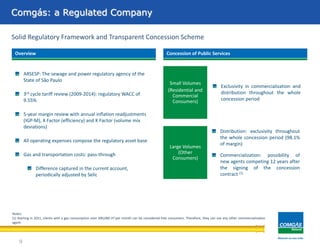
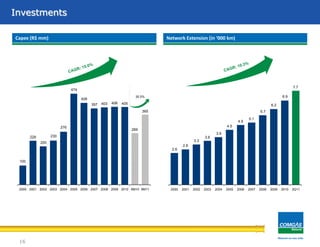
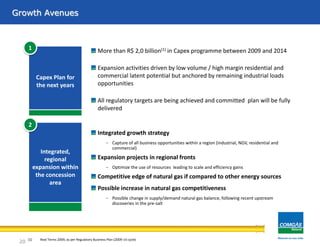
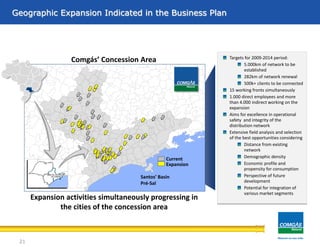
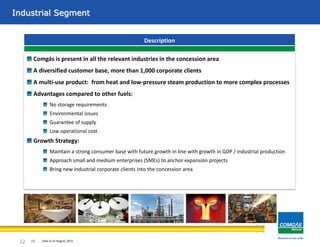
Comgás is a natural gas distribution company operating in São Paulo, Brazil. It has experienced significant growth since privatization in 1999. Comgás' strategic plan focuses on expanding its gas distribution network through new infrastructure projects within its concession area to capture additional residential, commercial, and industrial customers. The plan involves connecting over 500,000 new clients and building 5,000 km of new pipelines by 2014. Capturing growth in the residential segment is a key priority. Comgás also aims to diversify its industrial customer base and bring new corporate clients into its service area.
Comgás is Brazil's largest natural gas distributor, supplying over 30% of the country's natural gas. The document provides an overview of Comgás' history, operations, growth strategies, and financial and operational highlights. It summarizes Comgás' key assets as its premium concession area located in São Paulo, Brazil's largest economy, its diversified customer base of over 1 million residential and thousands of commercial and industrial customers, and its track record of significant growth and profitability. The financial highlights show that from 2000-2011, Comgás grew its net income and EBITDA at a CAGR of 24.2% and 23.7% respectively under IFRS accounting.
Comgás is Brazil's largest natural gas distributor, supplying over 30% of the country's natural gas. It has experienced significant growth since its privatization in 1999, increasing its customer base from 314,000 to over 836,000 and expanding its pipeline network from 2,500 km to over 8,000 km. Comgás focuses on further expanding its network and connecting new customers, especially in the high-potential residential segment. It maintains a diversified customer base across various industries and segments such as residential, commercial, industrial, vehicles and cogeneration. Comgás operates under a long-term concession agreement with transparent regulation of its prices and investments.
Comgás is Brazil's largest natural gas distributor, serving over 1 million customers across 177 cities. It has experienced significant growth since being privatized in 1999, increasing revenues 23% annually. In 2011, Comgás connected over 69,000 new meters, expanded its pipeline network by over 1,100 km, and invested a record R$510 million. Financially, Comgás grew revenues 0.2% in 2011 while reducing costs 16.3%, increasing EBITDA 27.2% and net income 19.3% over 2010. Operationally, distribution volume grew 3.8% excluding thermal generation contracts.
1. Comgás reported financial and operational results for the second quarter of 2013, with EBITDA of R$380 million, 123% higher than the second quarter of 2012, due to the sale of a former operational site.
2. The total number of customers grew 10% compared to June 2012, reaching over 1.27 million meters. Investments totaled R$220 million in the quarter, a 50% increase over the same period last year.
3. Network expansion construction reached 380 km in the quarter, 30% higher than the second quarter of 2012, as the company works to connect new customers and cities within its concession area.
Comgás is Brazil's largest natural gas distributor, serving over 1 million customers across 177 cities. It has grown significantly since being privatized in 1999, increasing revenues 23% annually between 1999-2011. In the first quarter of 2012, Comgás connected 29,000 new residential customers, saw a 24% rise in residential volume, and invested R$121 million, up 14% from the prior year. Financial results were positive, with an 8.4% increase in net income compared to the first quarter of 2011. Going forward, Comgás aims to further expand its customer base, particularly in the residential segment, through new infrastructure projects.
Comgás is a natural gas distribution company in Brazil. In the third quarter of 2012, Comgás connected 90 thousand new households, saw volume growth of 10.2% year-over-year, and invested R$427 million, up 17% from the same period in 2011. Financial results for the first nine months were also up year-over-year, with net income increasing 17.3% and EBITDA rising 18.1% compared to the same period in 2011. The company announced a change in controlling shareholders, with Cosan acquiring a 60.1% indirect stake from BG Group.
TGI is Colombia's largest natural gas transportation company with a network of 3,957 km of pipelines. It held a market share of 47.6% as of 3Q 2013. TGI is undertaking several expansion projects to increase capacity, such as the Cusiana-Apiay-San Fernando expansion and the La Sabana compression plant. TGI has a stable revenue stream under long-term contracts and a strong financial position. The regulatory framework for the natural gas sector in Colombia is undergoing changes aimed at developing a competitive market.
- Comgás had record expansion and investments in 2011, connecting over 1,100 km of network and 69,000 new gas meters.
- The company saw strong growth across all customer segments, especially residential, with over 109,000 new households connected.
- Financial results were positive, with net income growing 34.5% and EBITDA increasing 19.3% compared to 2010.
TGI reported stable operational and financial performance in 2015. The company transported 672 million standard cubic feet per day of natural gas through its 3,957 km pipeline network, maintaining high utilization rates. Financially, TGI generated $522 million in revenues in 2015, with gross profits of $394 million, representing a gross margin of 75%. Funds from operations were $454 million in 2015, demonstrating the company's consistent cash flow generation. TGI expects to complete the regulatory review process in 2016-2018, which occurs every five years and impacts future tariffs and revenues.
Companhia de Gás de São Paulo (Comgás) reported financial results for the second quarter and first half of 2008. Key highlights include a 7.8% increase in gas volumes sold in 2Q08 compared to the previous year, a 21.9% rise in net revenue for 2Q08, and net income growth of 2.7% and 15% for 2Q08 and 1H08 respectively. EBITDA increased 4.8% in 2Q08 and 13.5% for the first half. Comgás also achieved over 700 thousand gas customers in 1H08 and invested over R$2.5 billion between 2000 and June 2008 to expand its gas network and infrastructure.
EEB is a regional leader in the energy sector with subsidiaries and investments across electricity, natural gas, and transportation industries. It has a leading market position in Colombia, Peru, and Guatemala. EEB's diversified portfolio of regulated utility businesses provides stable cash flows and earnings. It has a track record of value creation through dividend payments and share price appreciation.
Comgás reported strong financial and operational results for the first quarter of 2012. Key highlights included a 24% increase in residential gas volume compared to the same period last year and R$121 million invested in infrastructure expansion projects. The company also renewed its short-term gas supply contracts with Petrobras. Comgás' industrial, commercial, and residential segments all experienced volume growth compared to the prior year. Financially, net income increased 8.4% and EBITDA grew 21.1% over the first quarter of 2011.
TGI is the largest natural gas pipeline system in Colombia, transporting over 50% of the country's gas. It has a stable regulated business model and strong financial performance. Some key updates include credit rating upgrades, dividend payments, and the completion of a hedge restructuring. TGI has a solid operational track record with over 3,957 km of pipelines and growing demand for natural gas in Colombia supported by significant gas reserves.
TGI is the largest natural gas pipeline system in Colombia, with a network of nearly 4,000 km that transports over half of the country's gas consumption. It has experienced strong growth since its privatization in 2006. TGI has a stable and predictable cash flow due to regulated tariffs indexed to the US dollar. The document provides an overview of TGI, its history, financial and operating highlights including growing revenues, EBITDA and consistent financial performance with low leverage. It also discusses the positive Colombian economic environment and TGI's experienced management team and shareholders.
TGI is Colombia's largest natural gas transportation company, owning 61% of the national pipeline network. The document provides an overview of TGI's history, financial and operating highlights from 2008 to Q1 2014, and key updates including the approval of TGI's first dividend, EEB's acquisition of a 31.92% stake in TGI, expansion projects, and the restructuring of cross-currency hedges. TGI has a stable and predictable cash flow, strong financial performance, and receives regulatory support as a natural monopoly in Colombia's gas sector.
Grupo Energía de Bogotá reported its key results and developments for the first quarter of 2015. Operating revenues decreased 37.8% due to anticipated dividends received in 2014 that would normally have been received in the first quarter of 2015. Net income decreased 88.4% primarily due to these anticipated dividends, losses from exchange rate differences, and higher income taxes. The company continues to make progress on expansion projects in Colombia and Brazil and reported several new projects awarded.
David harbord (consultor creg) upstream issues in the colombian natural gas...Naturgas
This document summarizes the findings of a study on upstream issues in Colombia's natural gas market. It analyzes supply and demand conditions, the regulatory framework, and gas producers' declarations of available supply. The study finds that gas production is highly concentrated, demand is unconcentrated, and producers have largely withheld firm long-term supply contracts, instead offering mainly interruptible contracts from 2012 onward. This allows producers to exploit market power and avoid regulatory obligations to auction surplus firm supply.
The document provides a summary of CPFL Energia's 3Q17 results. Some key highlights include:
- Net operating revenue increased 62.7% and EBITDA increased 13.8% compared to 3Q16.
- Investments totaled R$544 million in the quarter. Net debt was R$13.7 billion with leverage of 3.24x.
- Energy sales increased 18.4% compared to 3Q16, driven in part by the acquisition of RGE Sul. Excluding RGE Sul, sales increased 3.2% in the concession area.
- EBITDA growth was driven by higher sales from the distribution business including RGE Sul, as well as the start
Corporate Presentation CPFL Energia - May 2017CPFL RI
This document provides an overview of CPFL Energia, including:
1) CPFL Energia is the largest integrated private electricity company in Brazil with a market cap of R$26.5 billion and presence in distribution, generation, renewable energy and services.
2) In the last 12 months, CPFL Energia achieved an EBITDA of R$4,287 million and net income of R$879 million.
3) CPFL Energia has 9 distribution subsidiaries serving 9.3 million customers, 3,258 MW of installed generation capacity of which 94% is renewable, and is a leader in value-added energy services in Brazil.
Petrobras is Brazil's largest integrated energy company. In 2012, it posted net profits of R$21.2 billion, 36% lower than 2011 due to higher oil import costs, currency depreciation, dry well expenses, and a 2% production decline. However, oil product refining reached a record high due to refinery efficiency improvements. The company implemented efficiency programs to optimize costs and operations, which have begun to yield positive results to improve financial performance. Despite challenges in 2012, the company remains focused on long-term growth through efficiency and productivity initiatives.
The document provides a summary of a company's 1Q17 results. Some key highlights include:
- Stable load in the concession area and contracted demand being preserved.
- Increases of 27.7% in net operating revenue and 15.6% in EBITDA.
- Investments of R$681 million in the quarter.
- Net debt of R$13.8 billion and leverage of 3.30x net debt/EBITDA.
Eni Group had an excellent 2008 financially and operationally. Despite deteriorating market conditions late in the year, Eni delivered on its targets and achieved leading production growth and profitability. Eni's business portfolio, including oil and gas exploration and production, gas and power, refining and marketing, and engineering services, has proven resilient through commodity price cycles. The company is well positioned to withstand the current economic downturn and low oil prices due to its focus on low cost production growth and leadership in the European gas market.
The document summarizes CPFL Energia's 2Q17 results. It reports a 33.1% increase in net operating revenue and 6.3% increase in EBITDA. Key factors contributing to the EBITDA increase included price readjustments in contracts, start-up of new wind farms, and gains in commercial margins. The financial result declined due to exchange rate impacts and derivative losses. Net income decreased 48.7% due to higher financial expenses. Leverage remained stable at 3.28x net debt to EBITDA. The document also provides updates on recent acquisitions, investments, and the State Grid transaction.
CPFL Energia Corporate Presentation - November 2016CPFL RI
CPFL Energia is the largest private integrated electricity company in Brazil. Some key points:
1) In the last 12 months (LTM) of 3Q16, CPFL Energia had net revenue of R$16.8 billion and EBITDA of R$3.7 billion, with its distribution, generation and trading segments contributing significantly.
2) CPFL Energia has over 9 million customers across its 9 distribution subsidiaries, with a market share of 14.3%. Its generation portfolio consists of 3,240 MW of installed capacity, with 94% from renewable sources.
3) CPFL Energia has a diverse pipeline of growth projects through 2020, including over 200 MW of new
Corporate Presentation CPFL Energia - March 2017CPFL RI
On March 24, 2017, CPFL Energia presented its corporate overview and key financial figures for 2016. It is the largest integrated private electricity company in Brazil with a market capitalization of R$26.2 billion. In 2016, it had EBITDA of R$4.1 billion and net income of R$879 million. It has leadership positions in distribution through 9 subsidiaries, generation with 3,258 MW of installed capacity, and renewable energy as the largest operator in Brazil. The presentation provided details on its business segments, growth projects, and financial metrics.
This document summarizes research on evaluating the impact of energy efficiency on fuel poverty in Europe. It discusses definitions of fuel poverty and approaches to measuring it. The UK definition involves households spending over 10% of income on fuel. 50-125 million people in Europe experience energy poverty. UK policies aim to eliminate fuel poverty by 2016 through energy efficiency programs. Evaluations assess progress removing households from fuel poverty and analyze the trade-off between program eligibility rates and coverage. New approaches propose "fuel poverty proofing" homes to minimum efficiency standards to protect households from high costs.
The presentation summarizes SQM's financial results for the fourth quarter of 2016, including increased revenues driven by higher lithium sales volumes and prices, though lower prices in other businesses limited margins; it also outlines the company's growth strategy and capital expenditure plans to increase production of potassium nitrate, lithium, and solar salts through 2020.
1. Comgás is Brazil's largest natural gas distributor, responsible for over 30% of natural gas sales in the country. It has experienced significant growth since its privatization in 1999.
2. In 2012, Comgás achieved record volumes, investments, residential connections, and network extension. It also had record revenue but required an extraordinary tariff adjustment due to rising gas costs.
3. Key financial highlights included $616 million invested in 2012, 1.28 thousand km of new network built, and over 115 thousand new household connections added.
1) The document provides an overview of Comgás, Brazil's largest natural gas distributor, including its history, shareholder structure, regulated framework, concession area, growth since privatization, and segment breakdown.
2) Comgás reported financial and operational results for 1Q13, with total volume up 15% YoY to 1,367 million cubic meters. Investments were up 44% YoY to R$175 million. EBITDA was R$314 million, up 43% due to the regulatory current account.
3) As of 1Q13, Comgás had over 897,000 meters, including over 1.2 million residential customers. Total volume for 1Q13 was
The document provides financial results and highlights for Comgás for March 2010. Key points include:
- Over 16 thousand new residential connections in the last quarter, reflecting a focus on expanding in the residential market. Total meters grew 10.3% to 711,642 over 12 months.
- Consistent reduction in the regulatory current account balance, recovering R$456 million since March 2009.
- Moody's assigned investment grade credit ratings to Comgás in February 2010.
- Comgás celebrated the first tranche of €100 million long-term financing from the European Investment Bank in March 2010.
- Net income for 1Q10 was R$102.4 million, an increase of 6
This presentation by OHL Brasil provides an overview of the company and its operations. It summarizes OHL Brasil's financial results showing steady growth. It also outlines the company's investments in expanding its portfolio through acquiring new concessions. Finally, it discusses challenges with operating the new federal concessions and potential future opportunities in Brazil.
Corporate Presentation CPFL Energia April 2015CPFL RI
This document summarizes CPFL Energia's history and operations. It discusses CPFL's expansion since privatization in the late 1990s through acquisitions and new projects. It outlines CPFL's diversified portfolio including distribution, generation, commercialization, services and renewables. Financial highlights from 2010-2014 are provided for each segment. The document also discusses CPFL's ambitions for continued growth and leadership across its business lines.
This document provides an overview and summary of TGI's 1H 2013 results. It discusses TGI's history, financial and operating highlights, and expansion projects. TGI has a stable and growing business as the largest natural gas pipeline system in Colombia. It has a dominant market position and generates stable cash flow from long-term regulated contracts. Sizeable expansion projects are underway to increase capacity and meet growing demand.
This document provides an overview and summary of TGI's 1H 2013 results. It discusses TGI's history, financial and operating highlights, and expansion projects. TGI has a stable and growing business transporting natural gas through Colombia's largest pipeline network. It has experienced strong financial performance with predictable cash flows from long-term regulated contracts. Sizeable expansion projects are underway to increase capacity and serve new regions.
Empresas GASCO S.A. is a leading Chilean energy solutions conglomerate that has been operating since 1856. It has integrated supply, logistics, and commercialization activities for LPG and natural gas in Chile and Colombia. The company is pursuing a strategic plan to transition from a pure gas player to an energy solutions provider through expanding its LPG-based power generation, developing renewable energy projects, and offering integrated energy solutions to industrial clients. Empresas GASCO has a leading market position in Chile with 26% share of the LPG distribution market and is the sole natural gas distributor in Magallanes. It also has an 18% share of the LPG market in Colombia. The company aims
Comgás reported its financial results for the third quarter of 2009. Key highlights included a consistent increase in the residential market with over 89 thousand new residential units added in the last 12 months, R$290 million invested in its investment program in 2009, and a short-term natural gas supply agreement with Petrobras through an auction providing 1.5 to 2.0 million cubic meters per day between May 2009 and March 2010. Residential and industrial sales volumes increased while commercial, thermal generation, and NGV declined compared to the prior year. Net income decreased 42.4% year-over-year to R$96.6 million in 3Q09.
Comgás reported its third quarter 2010 results. Key highlights included:
- Sales volume grew 16.2% year-over-year to 3.6 billion cubic meters.
- The number of meters grew 10.2% to 746,904.
- R$418.4 million had been declared in dividends and interest on equity to be paid in 2010.
- A long-term loan of €200 million from the European Investment Bank was received, with €100 million already disbursed.
This document provides an overview of a large commercial property company in Brazil. Some key points:
- The company has a portfolio valued at R$13.8 billion with over 2 million square meters of space.
- The portfolio is diversified across 123 properties, office, industrial, and retail segments, and 14 Brazilian states.
- The company has experienced strong growth rates above competitors and seen stock outperformance.
- It has a focus on value creation through retenanting, market realignments, and development projects.
- The company has a track record of accretive acquisitions and improving the performance and value of properties.
Comgas reported strong financial and operational results for the first half of 2012. Key highlights included connecting 60 thousand new residential customers, investing R$268 million in the first semester, a 20% increase over 2011, and extending its natural gas network by 555 km. EBITDA increased 18.7% to R$318.9 million compared to the first half of 2011. A sale agreement was also signed for the sale of a 60.1% stake in Comgas to Cosan for R$3.4 billion, pending regulatory approval.
The company presentation provides an overview of the largest commercial property company in Brazil. It has a diversified portfolio of 91 properties totaling 1.35 million square meters across office, warehouse, retail, and development segments. The company has experienced strong growth since its IPO through acquisitions and operational improvements to its properties. It maintains a stable financial position with a diversified tenant base and inflation-linked contracts.
Presentation bof a merrill lynch 2013 brazil conferencebrproperties
This document provides an overview of a large commercial property company in Brazil. Some key points:
- The company has a portfolio valued at R$13.8 billion with over 2 million square meters of space across 123 properties in 14 Brazilian states.
- It has a diversified tenant base of large national and multinational companies.
- The company has achieved strong growth rates exceeding its competitors and stock performance has outperformed market indices.
- It focuses on value creation through re-tenanting, market realignments, and development projects totaling 322 thousand square meters.
This document provides a summary of CPFL Energia's business for 3Q15. It discusses CPFL Energia's history of expansion since privatization in 1998 through acquisitions and greenfield projects. It outlines CPFL Energia's key business segments including distribution, generation, trading, and services. For each segment, it provides financial highlights for the period of 2010-3Q15 including net revenues, EBITDA, and net income. It also summarizes CPFL Energia's ambitions for future growth across its business segments.
Empresas GASCO S.A. is a leading Chilean energy solutions conglomerate with operations in Chile and Colombia. It has a 27% market share in LPG distribution in Chile and 19% in Colombia. In 2023, Empresas GASCO reported $91 million in EBITDA, $21 million in net profit, and $163 million in net financial debt. The company provides integrated energy solutions including LPG and natural gas imports, storage, distribution, and power generation from solar energy. It aims to evolve from a gas player to an energy solutions provider through ongoing projects such as LPG-based power plants and solar farms.
SQM reported its first quarter 2017 earnings. Revenue for the last twelve months was $2.1 billion with EBITDA of $821 million, representing an EBITDA margin of around 39%. SQM is a world leader in specialty products including potassium nitrate, iodine, lithium, and solar salts. It has healthy credit metrics with net debt to EBITDA of 0.40 and investment grade credit ratings. SQM is pursuing growth projects including expansions of its lithium carbonate, lithium hydroxide, and potassium nitrate capacities through 2017-2018 with expected capital expenditures of around $180 million.
This document provides an overview of SQM, a leading producer of specialty plant nutrients, iodine, lithium, potassium, and industrial chemicals. It discusses SQM's business segments and highlights, including its position as the world's lowest cost producer of lithium. It also outlines SQM's strategic goals, which include growing its lithium, solar salts, and specialty plant nutrients businesses. Additionally, the document summarizes SQM's capital expenditure plans and ongoing arbitration with CORFO regarding its lease agreement.
TGI is Colombia's largest natural gas transportation company, owning 61% of the national pipeline network. It experienced growth since privatization in 1997 and is led by controlling shareholder EEB. Key updates include Fitch upgrading TGI's credit rating to BBB, hedging of cross-currency swaps, and EEB acquiring a 31.92% stake in TGI. TGI has a solid operational performance with high reliability and predictable cash flows from regulated tariffs. It also has expansion projects underway to increase pipeline capacity.
O documento resume os resultados financeiros e operacionais da Companhia de Gás de São Paulo para 2013, destacando:
1) Um volume recorde de gás de 5,4 bilhões de metros cúbicos, com forte crescimento nos segmentos de termoeletricidade, residencial e comercial.
2) Um investimento recorde de R$852 milhões, um aumento de 38% em relação a 2012.
3) A adição de 1.629 km de rede de distribuição e a construção recorde de 160 km de rede de aço.
The document provides an annual financial and operational report for Companhia de Gás de São Paulo (COMGÁS) for the year ending December 31, 2013. Some key highlights include:
- Record volumes sold of 5.4 billion cubic meters, up 43%, 13%, and 7% in the thermal generation, residential, and commercial segments respectively.
- Record high investment of R$852 million, up 38% compared to 2012, to expand the distribution network by 1,629 km, a 27% increase over the prior year.
- EBITDA of R$1,336 million in 2013, up 14% year-over-year when normalized for the regulatory current account.
O documento apresenta uma visão geral da Comgás, incluindo seu histórico, área de concessão, mercados atendidos, regulamentação tarifária, plano de expansão da rede e perspectivas para os mercados residencial e industrial. Resume os principais resultados financeiros e operacionais da companhia no segundo trimestre de 2013.
O documento apresenta os resultados financeiros e operacionais da Comgás para 31 de março de 2013. Apresenta informações sobre a estrutura acionária, área de concessão, mercados atendidos, regulamentação tarifária, plano de expansão da rede e contratos de fornecimento de gás natural da empresa.
This document provides a summary of financial and operational results for COMPANHIA DE GÁS DE SÃO PAULO (COMGÁS) for the first quarter of 2013. Some key highlights include a 15% increase in total gas volume compared to the first quarter of 2012, a 44% increase in investments from the first quarter of 2012 totaling R$175 million, and a 43% increase in EBITDA compared to the first quarter of 2012 due to regulatory current account effects. Network extensions increased 15% compared to the same period in 2012.
O documento resume os resultados financeiros e operacionais da Companhia de Gás de São Paulo para o primeiro trimestre de 2013, destacando um crescimento de 15% no volume total distribuído em relação ao mesmo período do ano anterior, um aumento de 44% nos investimentos e um EBITDA 43% maior.
O documento apresenta os resultados financeiros e operacionais da Comgás para 31 de março de 2013. Apresenta informações sobre a estrutura acionária, área de concessão, mercados atendidos, regulamentação tarifária, plano de expansão da rede e contratos de fornecimento de gás natural da empresa.
1. A Comgás é a maior distribuidora de gás natural do Brasil, responsável por mais de 30% das vendas no país.
2. A empresa tem presença em 177 cidades da região sudeste e uma base diversificada de consumidores nos segmentos residencial, comercial, industrial e veicular.
3. Nos últimos anos, a Comgás tem apresentado forte crescimento operacional e financeiro, com aumento significativo no volume de vendas, número de clientes e receita líquida.
- Comgás reported strong financial results for the third quarter and first nine months of 2008, with increases in volume sold, net revenue, net income, and EBITDA compared to the same periods in 2007.
- Residential and industrial sales volumes increased year-over-year, while commercial volumes were flat and NGV volumes declined.
- The number of residential and commercial meters also grew compared to the prior year.
- Comgás declared dividends of R$275 million for 2008 to be paid out over the remainder of 2008 and into 2009.
Comgás, a natural gas company in São Paulo, Brazil, reported strong financial results for 2008. Net revenue increased 24.2% to R$4 billion while net income grew 16% to R$514 million. Volumes sold rose 3.6% to over 5.2 billion cubic meters. The company added over 81,000 new residential customers and invested R$403 million in capital expenditures. Looking forward, Comgás is focused on expanding its residential customer base and increasing supply through new contracts and infrastructure projects.
Comgás reported financial results for the first quarter of 2009. Net revenue grew 16.2% year-over-year to R$980 million. Dividends of R$199.9 million were declared for 2008, to be paid in three installments during 2009. The gas distribution network expanded 452 km over the last 12 months to a total of 5,801 km. Residential gas connections increased by over 89 thousand over the last 12 months. Overall gas sales volumes declined 32.2% compared to the first quarter of 2008 due to decreases in industrial, thermal generation, and natural gas vehicle (NGV) segments.
Comgás reported financial results for the first half of 2009, with growth in several key metrics. Residential customers grew 10.7% and cogeneration customers grew 15.8% compared to the first half of 2008. Gross and net sales revenue increased 10.9% and 9% respectively. Volume sold declined across most segments except residential and cogeneration. The company continued investing in expanding its natural gas network and adding new customers. Dividends of R$200 million were declared to be paid out over the remainder of 2009.
Comgás, a natural gas company in São Paulo, Brazil, reported strong financial results for 2008. Net revenue increased 24.2% to R$4 billion while net income grew 16% to R$514 million. Volumes sold rose 3.6% to over 5.2 billion cubic meters. The company added over 81,000 new residential customers and invested R$403 million in capital expenditures. Looking forward, Comgás is focused on expanding its residential customer base and increasing supply through new contracts.
Comgás reported strong financial results for 2010, with sales volume reaching 4.9 million cubic meters, a 15.2% increase over 2009. Investments totaled R$405 million for the expansion of its natural gas distribution network. The number of meters grew 9.12% to 767,214, and 108,612 new residential connections were added. Total shareholder remuneration including dividends and interest on equity was R$427 million.
Comgás reported its first quarter 2011 results, with key highlights including:
- Residential gas connections grew 11.4% year-over-year to 783,145 meters.
- Total gas sales volumes increased 6.95% compared to the first quarter of 2010.
- Earnings before interest, taxes, depreciation and amortization (EBITDA) fell 22.6% versus the same period last year.
- Net income declined 39.25% year-over-year.
- Comgas built 792 km of natural gas network and connected over 118,000 residential customers in the past year. Residential gas volume was up 12.3% and the number of meters increased 9.8% compared to the same period last year.
- EBITDA was down 15.54% to R$186.7 million compared to the previous quarter due to higher costs, while net income fell 56.25% to R$59.7 million.
- The company invested over R$3.9 billion in network expansion projects including new pipelines in Taubaté, Campinas, São Bernardo do Campo, and other cities.
This document provides a summary of financial and operational results for Companhia de Gás de Sao Paulo (COMGÁS) for the year ending December 31, 2012. Some key highlights include record volumes distributed, investments, connections, and network extensions. COMGÁS also saw record revenue but an extraordinary tariff adjustment was authorized to offset rising gas costs. Net income increased substantially over 2011 despite the adjustment. Financial indicators show improved returns and margins year-over-year.
O documento apresenta os resultados financeiros da Companhia de Gás de São Paulo no primeiro semestre de 2008, destacando o crescimento das vendas, receita e lucro. Os principais contratos de fornecimento de gás natural são descritos, assim como os investimentos realizados pela companhia.
O documento resume os resultados financeiros da Companhia de Gás de São Paulo para 2008. Ele destaca que a companhia teve um aumento de 3,6% no volume vendido, 24,2% na receita líquida e 16% no lucro líquido em relação a 2007. Além disso, a LAJIDA cresceu 11,9% no período.
❼❷⓿❺❻❷❽❷❼❽ Dpboss Matka Result Satta Matka Guessing Satta Fix jodi Kalyan Final ank Satta Matka Dpbos Final ank Satta Matta Matka 143 Kalyan Matka Guessing Final Matka Final ank Today Matka 420 Satta Batta Satta 143 Kalyan Chart Main Bazar Chart vip Matka Guessing Dpboss 143 Guessing Kalyan night
Anny Serafina Love - Letter of Recommendation by Kellen Harkins, MS.AnnySerafinaLove
This letter, written by Kellen Harkins, Course Director at Full Sail University, commends Anny Love's exemplary performance in the Video Sharing Platforms class. It highlights her dedication, willingness to challenge herself, and exceptional skills in production, editing, and marketing across various video platforms like YouTube, TikTok, and Instagram.
Discover timeless style with the 2022 Vintage Roman Numerals Men's Ring. Crafted from premium stainless steel, this 6mm wide ring embodies elegance and durability. Perfect as a gift, it seamlessly blends classic Roman numeral detailing with modern sophistication, making it an ideal accessory for any occasion.
https://rb.gy/usj1a2
HOW TO START UP A COMPANY A STEP-BY-STEP GUIDE.pdf46adnanshahzad
How to Start Up a Company: A Step-by-Step Guide Starting a company is an exciting adventure that combines creativity, strategy, and hard work. It can seem overwhelming at first, but with the right guidance, anyone can transform a great idea into a successful business. Let's dive into how to start up a company, from the initial spark of an idea to securing funding and launching your startup.
Introduction
Have you ever dreamed of turning your innovative idea into a thriving business? Starting a company involves numerous steps and decisions, but don't worry—we're here to help. Whether you're exploring how to start a startup company or wondering how to start up a small business, this guide will walk you through the process, step by step.
[To download this presentation, visit:
https://www.oeconsulting.com.sg/training-presentations]
This PowerPoint compilation offers a comprehensive overview of 20 leading innovation management frameworks and methodologies, selected for their broad applicability across various industries and organizational contexts. These frameworks are valuable resources for a wide range of users, including business professionals, educators, and consultants.
Each framework is presented with visually engaging diagrams and templates, ensuring the content is both informative and appealing. While this compilation is thorough, please note that the slides are intended as supplementary resources and may not be sufficient for standalone instructional purposes.
This compilation is ideal for anyone looking to enhance their understanding of innovation management and drive meaningful change within their organization. Whether you aim to improve product development processes, enhance customer experiences, or drive digital transformation, these frameworks offer valuable insights and tools to help you achieve your goals.
INCLUDED FRAMEWORKS/MODELS:
1. Stanford’s Design Thinking
2. IDEO’s Human-Centered Design
3. Strategyzer’s Business Model Innovation
4. Lean Startup Methodology
5. Agile Innovation Framework
6. Doblin’s Ten Types of Innovation
7. McKinsey’s Three Horizons of Growth
8. Customer Journey Map
9. Christensen’s Disruptive Innovation Theory
10. Blue Ocean Strategy
11. Strategyn’s Jobs-To-Be-Done (JTBD) Framework with Job Map
12. Design Sprint Framework
13. The Double Diamond
14. Lean Six Sigma DMAIC
15. TRIZ Problem-Solving Framework
16. Edward de Bono’s Six Thinking Hats
17. Stage-Gate Model
18. Toyota’s Six Steps of Kaizen
19. Microsoft’s Digital Transformation Framework
20. Design for Six Sigma (DFSS)
To download this presentation, visit:
https://www.oeconsulting.com.sg/training-presentations
The APCO Geopolitical Radar - Q3 2024 The Global Operating Environment for Bu...APCO
The Radar reflects input from APCO’s teams located around the world. It distils a host of interconnected events and trends into insights to inform operational and strategic decisions. Issues covered in this edition include:
Navigating the world of forex trading can be challenging, especially for beginners. To help you make an informed decision, we have comprehensively compared the best forex brokers in India for 2024. This article, reviewed by Top Forex Brokers Review, will cover featured award winners, the best forex brokers, featured offers, the best copy trading platforms, the best forex brokers for beginners, the best MetaTrader brokers, and recently updated reviews. We will focus on FP Markets, Black Bull, EightCap, IC Markets, and Octa.
Digital Marketing with a Focus on Sustainabilitysssourabhsharma
Digital Marketing best practices including influencer marketing, content creators, and omnichannel marketing for Sustainable Brands at the Sustainable Cosmetics Summit 2024 in New York
𝐔𝐧𝐯𝐞𝐢𝐥 𝐭𝐡𝐞 𝐅𝐮𝐭𝐮𝐫𝐞 𝐨𝐟 𝐄𝐧𝐞𝐫𝐠𝐲 𝐄𝐟𝐟𝐢𝐜𝐢𝐞𝐧𝐜𝐲 𝐰𝐢𝐭𝐡 𝐍𝐄𝐖𝐍𝐓𝐈𝐃𝐄’𝐬 𝐋𝐚𝐭𝐞𝐬𝐭 𝐎𝐟𝐟𝐞𝐫𝐢𝐧𝐠𝐬
Explore the details in our newly released product manual, which showcases NEWNTIDE's advanced heat pump technologies. Delve into our energy-efficient and eco-friendly solutions tailored for diverse global markets.
The Most Inspiring Entrepreneurs to Follow in 2024.pdfthesiliconleaders
In a world where the potential of youth innovation remains vastly untouched, there emerges a guiding light in the form of Norm Goldstein, the Founder and CEO of EduNetwork Partners. His dedication to this cause has earned him recognition as a Congressional Leadership Award recipient.
Zodiac Signs and Food Preferences_ What Your Sign Says About Your Tastemy Pandit
Know what your zodiac sign says about your taste in food! Explore how the 12 zodiac signs influence your culinary preferences with insights from MyPandit. Dive into astrology and flavors!
How are Lilac French Bulldogs Beauty Charming the World and Capturing Hearts....Lacey Max
“After being the most listed dog breed in the United States for 31
years in a row, the Labrador Retriever has dropped to second place
in the American Kennel Club's annual survey of the country's most
popular canines. The French Bulldog is the new top dog in the
United States as of 2022. The stylish puppy has ascended the
rankings in rapid time despite having health concerns and limited
color choices.”
The Genesis of BriansClub.cm Famous Dark WEb PlatformSabaaSudozai
BriansClub.cm, a famous platform on the dark web, has become one of the most infamous carding marketplaces, specializing in the sale of stolen credit card data.
4. HistóricoA Successful Equity Story
4
The English company
“San Paulo Gas
Company” was
authorized to explore
the concession of
public lighting services
in São Paulo
18721
The Canadian
company “Light”
acquires the company
19122
The administration of
the company was
transferred to the city
of São Paulo and the
company was named
as “Comgás”
19684
1996: Comgás became
a publicly-listed
company
1997: Comgás’ shares
started to be traded
on the Bovespa stock
exchange
1996/19976
Largest Brazilian gas
distributor,
responsible for more
than 30% of natural
gas’ sales in the
country
20108
The company was
nationalized and was
named as “Companhia
Paulistana de Serviços
de Gás (Comgás)”
19593
The control was
transferred to the
state-owned company
“Companhia
Energética de São
Paulo (CESP)”
19845
Privatization: Comgás
was acquired by the
consortium formed by
British Gas and Shell
Beginning of a 30-year
concession
(renewable for
additional 20 years)
19997
# 1,000,000
residential customers
20119
5. Área de concessãoComgás at a Glance
5
What is Comgás
R$ 341mm
1999
1.3 bi m3
R$ 50mm
2,500km
17
314,034
R$ 4,095mm
2010
4.9 bi m3
R$ 405mm
6,900km
68
767,214
Net Revenue
Volume
Capex
Network
# Municipalities
# Meters
25%
CAGR
(1999-2010)
13%
21%
10%
13%
8%
Growth Since Privatization
More than 1 million residential customers
Concession area comprising 177 cities (São Paulo,
Campinas, baixada Santista e Vale do Paraíba) – 27% of
Brazil’s GDP(1)
30-year concession renewable for additional 20 years
Largest distributor of piped natural gas in Brazil
Notes:
(1) Approximate and potential values.
6. Área de concessãoComgás at a Glance (Cont’d)
6
Key Figures (3Q11)
7,692 kmNetwork R$ 4,085mmNet Revenue
Operational Financial (LTM)(1)
819,907 unitsMeters R$ 875mmEBITDA
1,063,364 unitsUDAs (1) R$ 328mmNet Income
4.9 bi/m3Volume (LTM) (1) R$ 501mmCapex
Notes:
(1) LTM (Last Twelve Months) until September 30, 2011.
(2) UDAs (autonomous residential units).
7. A Comgás é uma Companhia Regulada ...Comgás Highlights
7
Premium asset located
in a strategic concession
area
Substantial growth in the
residential segment
Diversified client base
Impressive track record:
significant growth with
profitability and sound
capital structure
Solid regulatory framework
and transparent concession
scheme
Favorable prospects
for natural gas in
Brazil
8. Área de concessãoStrategic Concession Area
8
Premium Asset Located in a Strategic Concession Area
Gas Brasiliano
Gás Natural
SPS
COMGÁS
Supply and Demand Location
Santos Basin
Concession Area
Comgás’ Concession Area
Highlights
Intersection of pipelines (GASBOL, GASAN, GASPAL)
Short distance to the natural gas supply (Santos Basin)
High population density
100% of gas demand contracted
Customers (3Q11)
Residential: 1.1 mm UDAs (1)
Commercial: 10.2 thousand
Industrial: 1.0 thousand
Thermal Gen.: 2 plants
Cogeneration: 23 meters
NGV: 360 gas stations
Concession Area (2)
27% Brazil’s GDP
Population: 29.6 mm
Households: 8.2 mm
Vehicles: 10.0 mm
Notes:
(1) UDAs (autonomous residential units).
(2) Approximate and potential values.
State of São Paulo
Drilled well
Campos Basin
Pre-salt reserves
Production field
Exploration block
Espírito Santo Basin
Existing NetworkTransmission pipeline Network in Expansion Main Highways Network Under Study
LULA
9. Comgás: uma combinação de competências e princípiosComgás: a Regulated Company
9
ARSESP: The sewage and power regulatory agency of the
State of São Paulo
3rd cycle tariff review (2009-2014): regulatory WACC of
9.55%
5-year margin review with annual inflation readjustments
(IGP-M), X Factor (efficiency) and K Factor (volume mix
deviations)
All operating expenses compose the regulatory asset base
Gas and transportation costs: pass-through
Difference captured in the current account,
periodically adjusted by Selic
Overview Concession of Public Services
Small Volumes
(Residential and
Commercial
Consumers)
Exclusivity in commercialization and
distribution throughout the whole
concession period
Large Volumes
(Other
Consumers)
Distribution: exclusivity throughout
the whole concession period (98.1%
of margin)
Commercialization: possibility of
new agents competing 12 years after
the signing of the concession
contract (1)
Notes:
(1) Starting in 2011, clients with a gas consumption over 300,000 m3 per month can be considered free consumers. Therefore, they can use any other commercialization
agent.
Solid Regulatory Framework and Transparent Concession Scheme
10. Comgás: uma combinação de competências e princípiosSponsorship From Top Sector Players
SHELL BRAZIL
HOLDING BV
6.34%
INTEGRAL
INVESTMENTS BV
71.91%
SHELL GAS BV
16.49%
BG SÃO PAULO
INVESTMENTS BV
83.51%
OTHER
SHAREHOLDERS
21.75%
10
The Comgás’ controlling shareholder is Integral Investments, which has as main shareholders the BG Group and Shell with a stake
of 83.5% and 16.5%, respectively.
Current Shareholders’ Structure of Comgás
Presence in Brazil since 1994
Operates in more than 20 countries in
the energy market (Exploration and
Production, Liquefied Natural Gas,
Transmission and Distribution, Power
Generation)
Presence in Brazil since 1913
Main activities: distribution of oil
products, operations in the gas and
power sectors, exploration and offshore
production
11. 60.00
70.00
80.00
90.00
100.00
110.00
120.00
130.00
140.00
Dec-10 Feb-11 Mar-11 May-11 Jul-11 Aug-11 Oct-11 Dec-11
-
5.0
10.0
15.0
20.0
25.0
30.0
35.0
A Comgás é uma Companhia Regulada …Market Performance and Corporate Governance
11
LTM Comgás Share Price Performance Corporate Governance
( Index = 100 as of December 13, 2010)
29,0%30,7% (16,8%)LTM Performance
Class of Shares
Allows the existence of common shares
(voting rights) and preferred shares (non-
voting rights)
Board of
Directors
9 members (minimum requirement is 3
members)
2 independent board seats (currently only
1 seat occupied)
Tag Along 80% only for ON shares
Sarbanes
Oxley (1)
Comgás already has comparable standard
of SOX procedures in place
Note:
(1) Standard not required by BM&FBovespa corporate governance segments or the Brazilian Corporate Law.
(2) Includes the volume related to ON shares and PN shares.
Source: BM&FBovespa and Factset as of December 13, 2011.
Base 100
Volume
(R$mm) BMF&Bovespa
Level Traditional (“Lei das S.A.”)
Volume CGAS(2) CGAS ON CGAS PN IBOV
17. Área de concessãoHistorical High Payout Ratio
17
Dividend Payout (R$ mm)
Notes:
(1) Announced Dividends and Juros Sobre Capital Próprio; non-audited numbers.
(2) Dividends calculated based on previous accounting method until 2009 and considering announced dividends.
Dividend(2) Payout Ratio (%)
450427
268
275
334
11 16
27 25
303
330
95%
17% 15%
26%
10%
77% 75%
53%
73% 74%
2001 2002 2003 2004 2005 2006 2007 2008 2009 2010 2011
(1)
18. Área de concessãoDebt Overview
18
Overview
Debt Breakdown: Short / Long-Term Debt Debt Composition by Lender (R$ mm)
Debt Schedule (R$ mm)
Local CurrencyForeign Currency
EIB
28%
BNDES
57%
Others
15%
LT Debt
78%
ST Debt
22%
Jun/11 Sep/11
LT Debt
80%
ST Debt
20%
Notes:
(1) European Investment Bank.
(1)
358
246 221
187
74 77
187
29
66
393
20
5
1 ano 2 anos 3 anos 4 anos 5 anos + 6 anos
378
251
408
216
140
470Debt denominated
in foreign currency
is fully hedged
3Q11 Debt Overview (R$ mm)
Short Term Debt 378
Long Term Debt 1,486
Total Debt 1,864
(-) Cash & Marketable Securities 172
(=) Net Debt 1,692
Net Debt / EBITDA LTM 1.9x
Net Debt / Book Value of Equity 1.4x
20. Growth Avenues
Integrated growth strategy
– Capture of all business opportunities within a region (industrial, NGV, residential and
commercial)
Expansion projects in regional fronts
– Optimize the use of resources leading to scale and efficiency gains
Competitive edge of natural gas if compared to other energy sources
Possible increase in natural gas competitiveness
– Possible change in supply/demand natural gas balance, following recent upstream
discoveries in the pre-salt
Integrated,
regional
expansion within
the concession
area
More than R$ 2,0 billion(1) in Capex programme between 2009 and 2014
Expansion activities driven by low volume / high margin residential and
commercial latent potential but anchored by remaining industrial loads
opportunities
All regulatory targets are being achieved and committed plan will be fully
delivered
Capex Plan for
the next years
1
2
(1) Real Terms 2009, as per Regulatory Business Plan (2009-14 cycle)
20
21. Santos’ Basin
Pré-Sal
Current
Expansion
Comgás’ Concession Area
Geographic Expansion Indicated in the Business Plan
Expansion activities simultaneously progressing in
the cities of the concession area
Targets for 2009-2014 period:
5.000km of network to be
established
282km of network renewal
500k+ clients to be connected
15 working fronts simultaneously
1.000 direct employees and more
than 4.000 indirect working on the
expansion
Aims for excellence in operational
safety and integrity of the
distribution network
Extensive field analysis and selection
of the best opportunities considering
Distance from existing
network
Demographic density
Economic profile and
propensity for consumption
Perspective of future
development
Potential for integration of
various market segments
21
22. Industrial Segment
Comgás is present in all the relevant industries in the concession area
A diversified customer base, more than 1,000 corporate clients
A multi-use product: from heat and low-pressure steam production to more complex processes
Advantages compared to other fuels:
No storage requirements
Environmental issues
Guarantee of supply
Low operational cost
Growth Strategy:
Maintain a strong consumer base with future growth in line with growth in GDP / industrial production
Approach small and medium enterprises (SMEs) to anchor expansion projects
Bring new industrial corporate clients into the concession area
Description
22 (1) Data as of August, 2011
23. Residential Segment
Key growth strategy for Comgás:
Geographic expansion, capturing the existing
potential and connecting around 100.000
clients per year
Increase average unit consumption by
optimizing and expanding customer base
High potential market, with com growth
driven by:
New real estate developments
Gas conversions in built residencies
Large customer base with more than 1
million residential clients
Alternative for LPG and electricity
Description Concession Area Potential(1,2)
(1) Potential to be update as per IBGE Census 2010
(2) Concession area potential doesn’t consider organic growth
(3) Considered in the plan to achieve 100.000 clients per year
Apartment
Houses
59%
13%
8%
20%
2%
13%
7%
78%already connected to NG
customers to be captured
not connected customers
unachievable market
(MM of households)
6.2
1.5
23
+ 45,000 new buildings (launch) to be captured(3)
24. Natural gas vehicular (NGV) may be used
as fuel for both individual and mass
transportation
Stands out for savings and environmental
benefits
Today more cost competitive than gasoline
and ethanol
Strong economic benefit for heavy users
Comgás is currently working with
government in the implementation of
public policies that should favor the sector
Fiscal incentives (IPVA reduction)
Public transportation policy
Growth Strategy
Project currently under way: use of NGV in
bus fleet and other heavy users (trucks)
Description Benchmarking Analysis: October, 2011
Natural Gas Vehicle (NGV) Segment
Prices (R$)
Cost per Km (R$)
Payback (months)(1)
Note:
(1) Assumptions: i) Consumption: NGV 12km/l, Alcohol 7km/l, Gasoline 10 km/l ii) Cost of gas equipment: R$ 5,200 iii) Traveled km per month: 5,00024
6.20
6.64
vsGasoline vsEthanol
1.32 1.87
2.78
NGV Ethanol Gasoline
0.11
0.27 0.28
NGV Ethanol Gasoline
25. Other Markets
More than 10,200 clients
Focus in medium to large establishments
Growth platform integrated with expansion
of residential segment
High development potential of new
applications:
Market in early stage of development
with high consumption potential
Dedicated structure to develop non
conventional applications
development : acclimatization,
commercial cogeneration and
generation at peak hours
Commercial Thermal Generation and Cogeneration
Thermal Generation:
Demand depends on the level of
thermal dispatch
Back to back gas contracts
Cogeneration :
Industry strategic decision aiming
efficiency and energy security in the
medium and long term
Sustainable growth is dependent on
firm supply of gas and visibility of
prices vis-a-vis electricity
Market with a high development
potential
25
27. Tag along for ONs 80% 80% 100% 100%
Tag along for PNs 100% n.a.1
Minimum free float of 25% P P P
Minimum of 20% of independent members on the Board P P
Financials in IFRS P P P P
Disclosure of transactions involving controlling shareholders or
management (quarterly financial information) P P P P
Special vote for preffered shareholders P n.a.
1
Annual Calendar of Corporate Events P P P
Maximum of 2 years mandate for Board Members, allowing re-
election P P P
Arbitrage Board P P
Summary of Corporate Governance Levels on Bovespa
(1) Not applicable (“n.a.”) due to the absence of preferred shares in “Novo Mercado” listing segment
Source: “Novo Mercado”, “Nível 1” and “Nível 2” listing regulation by BM&FBovespa and Brazilian Corporate Law
Nova Lei
das SAs
Status Quo
Of all companies listed in differentiated governance levels, 125 are at the “Novo Mercado”, 19
at“Nível 2” and 38 at “Nível 1”
27
28. (1) Due to the liquidity increase and the presence at the “Novo Mercado” listing segment of BM&FBovespa, other utility companies (listed at NM) have
in average 10 research analysts currently covering its shares . Comgás currently is covered by 4 active research analysts
Shares listed at the highest governance level of BM&FBovespa – acknowledge by investors as today’s
market standards, same rights and transparency for all shareholders (only voting shares)
Better exposure to the banks' research analysts , and consequently increase in exposure to the general
finance community(1) – possibility to access a more vast universe of investors, increasing the company’s
capability of accessing the Capital Markets
Potential for value uplift through a re-rating, as happened in past migrations to “Novo Mercado”
Increase in the share liquidity (one type of share), concentrating the liquidity of the current two types of
shares into one type of share
New governance standards: i) guarantee of 20% of independent board members , ii) 100% tag along to all
shareholders, iii) complete information of all corporate events to shareholders
Benefits of a Potential Migration to “Novo Mercado”
28
29. 2011 TIM 0.84 P2
2011 Ultrapar 1.00
2010 Anhanguera 1.00
2010 ALL 1.00
2010 Mahle 1.00 P
2009 Paranapanema 1.00 P2
2008 lochpe-Maxion 0.83 P
2008 Estacio 1.00
2008 Equatorial 1.00
2007 Hering 1.00 P
2007 Romi 0.90 P
2007 Magnesita 0.83 P
2006 BR Foods 1.00 P
2006 Embraer 1.00
Average 0.96
Median 1.00
Year Company
Conversion Ratio:
ON shares per 1 PN
share
Aditional
Dividends of
10%1
Source: Factset/Economatica for stock prices. Bloomberg Data for Company Actions (CACS tool). CVM Website for GM events.
Notes:
(1) Companies which the bylaws granted an additional 10% dividend to the PN shareholders when compared to ON shareholders, same case as
Comgás
(2) TIM and Paranapanema bylaws granted an additional 6% dividend to its PN shareholders when compared to ON shareholders
(3) WEG and Portobello are not being considered in the analysis due to some specificities for each regarding the period screening and recent
events at the moment of the migration (WEG migration was followed by an acquisition announcement which polluted the analysis; for
Portobello, the migration was not followed by a liquidity event to increase liquidity - still around 10% of free-float)
(4) “Fato Relevante”(Material Fact) as of December 2, 2011
Previous Migrations to “Novo Mercado”
“Studies conducted by
the Company’s principal
shareholders and
Management show that a
conversion at a ratio of
one ordinary share to
each preferred share of
the Company is in the
best interest of the
Company and its
shareholders.”4
29
30. Área de concessãoDisclaimer
30
The forward-looking statements in this report related to the
outlook for the business, estimated financial and operating
results and growth prospects of COMGÁS are merely projections
and, as such, are based exclusively on management expectations
regarding future performance. These expectations depend
substantially on market conditions and the performance of the
Brazilian economy, the business sector and the international
markets, and are therefore subject to change without prior
notice.
33. The tariff structure is
composed by 3
components:
Gas cost (pass
through)
Transport cost (pass
through)
Average maximum
margin (“P0”) defined
by the regulator
during the tariff
revision
Regulated Tariff
Comgás: uma combinação de competências e princípiosComgás: a Regulated Company (Cont’d)
33
Main Aspects of the Concession Contract
Annual readjustment of
distribution margin by the
inflation rate (IGP-M),
excluding the “X Factor”
and the “K Factor”
Annual adjustment of the
tariff according to the gas
and transportation costs
accounted yearly on May
31st (or eventually before,
subject to the regulator)
The review considers:
WACC over the
regulatory asset base
and investments
Operational expenses
Depreciation
Sales volume
Occurs every 5 years
Maximum Margin Review
“X Factor”: efficiency
factor determined by the
regulator considered in
the annual adjustment of
the “P0”
The “X Factor”
determined in the 3rd
tariff cycle is 0.82%
p.a.
“K Factor”: adjustment
factor that compensates
deviations in the effective
maximum margin in
relation to the authorized
maximum margin
= +
“X Factor” and “K Factor”Annual Tariff Readjustments
34. Comgás: uma combinação de competências e princípiosNatural Gas Supply: Contracts
34
Contracts
Contracts TCQ Firm Contract Firm of Energy Auction Weekly Sale
Contract Models Firm Firm Firm of Energy Firm of Short Term Short Term
Gas Source Bolivian Not Determined Not Determined
Exceeding contracts of PB
with others
distributor/thermal power
plants
Exceeding contracts of PB
with others
distributor/thermal power
plants
Daily Contract Quantity
8.75mm m3/day until oct/11
8.10mm m3/day until jun/19
4.3mm m3/day 1.0mm m3/day 3.2mm m3/day According to the bids
End of Contract Jun/19 Dec/13 Dec/12 Mar/12 Mar/12
Price
Commodity + Transportation
Fixed Charge +
Variable Charge
Fixed Charge +
Variable Charge
According to the auction
According to the offered
bid and the acceptance
from Petrobras
Commodity: quarterly
adjusted based on Oil
Basket (Brent) +
Exchange Rate
Transport: annual
adjustment according to
USA inflation rate (CPI)
Fixed Charge: annual
adjustment by IGP-M
inflation rate
Variable Charge:
quarterly adjustment
based on Oil Basket
Fixed Charge: annual
adjustment by IGP-M
inflation rate
Variable Charge:
quarterly adjustment
based on Oil Basket
TCQ Contract: Current contracted daily volume of Bolivian gas is 8.75mm m3/day, which will be periodically reduced
until it reaches the volume of 8.10mm m3/day in August 2012
Firm Contract: Contracted daily volume of 4.27mm m3/day, which will be periodically increased until it reaches the
volume of 5.22mm m3/day in August 2012
Firm of Energy Contract: Petrobras supplies natural gas or indemnifies clients of the additional costs incurred due to the
consumption of an alternative fuel. Gas supply may be interrupted at the discretion of Petrobras, but with no risk of
supply cuts for Comgás consumers. Petrobras will also bear the cost of the financial impacts incurred by Comgás and its
clients in question
35. Área de concessãoCurrent Account
35
Regulatory Current Account (R$ mm)
Current Account
(5)
1229
153
264
469
528
(55)
(157)
(230)
(198)
(128)
4Q08 1Q09 2Q09 3Q09 4Q09 1Q10 2Q10 3Q10 4Q10 1Q11 2Q11 3Q11
REGULATORY CURRENT ACCOUNT
Compensation mechanism used to
reimburse the company or the
state in case the real cost of gas
differs from the cost used for
tariffs
Monthly calculated by the
regulator. However only
adjusted once a year (May)
Difference between the
cost of gas used for tariffs
and the real cost of gas
incurred
The balance is debited / credited
in a regulatory account
The effect of the regulatory
current account is considered only
for tax purposes, it is excluded
from financial accounting (IFRS)
Main implications: volatility in the
company’s results