Download to read offline

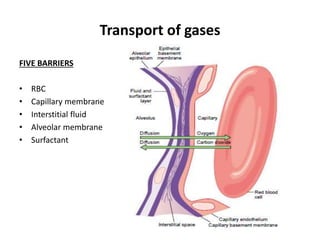


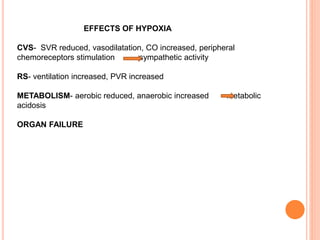
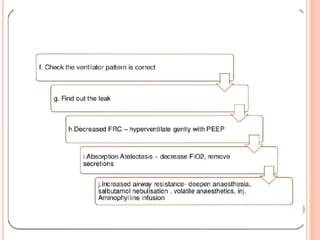
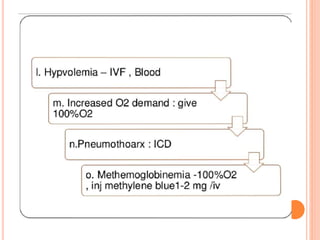
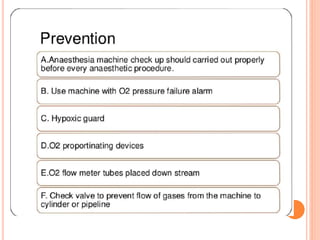
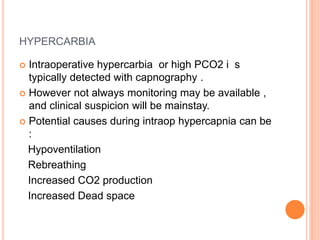
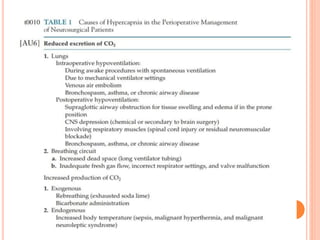
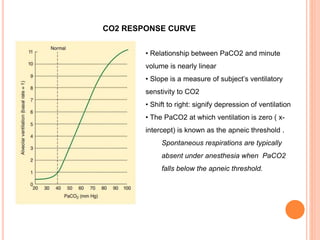
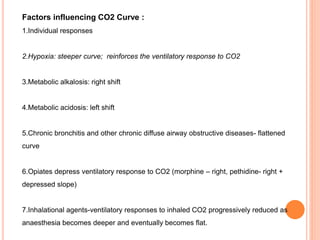
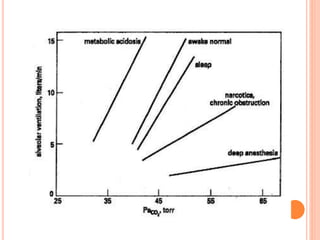
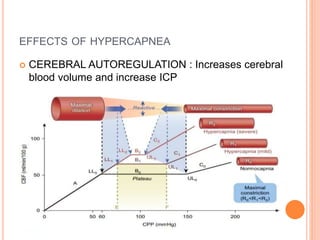


Dr. Shalini presented on respiratory physiology and gaseous transport. There are five barriers to gas transport: red blood cells, capillary membrane, interstitial fluid, alveolar membrane, and surfactant. Oxygen is transported via dissolved oxygen in plasma and bound to hemoglobin. Carbon dioxide is transported as dissolved CO2, ionized as bicarbonates, and chemically combined with proteins. Intraoperative hypoxia and hypercarbia can occur due to hypoventilation, rebreathing, increased CO2 production, or increased dead space. Effects of hypoxia include reduced systemic vascular resistance, increased cardiac output, and metabolic acidosis. Effects of hypercarbia include increased intracranial pressure


