This study used an F-Scan sensor system to determine peak plantar pressure in different foot positions. Subjects stood in various positions on one foot and two feet while the sensor recorded pressure data. The results showed that peak pressure was higher on one foot compared to two feet. Additionally, peak pressure was found to be most prevalent in the heel region of the foot across all test positions. Statistical analysis indicated there were no differences in pressure among the various standing positions. The study demonstrated the F-Scan system's ability to measure peak pressure and pressure distribution on the plantar surface of the foot.
Correlation between conventional clinical tests and a new movement assessment...Stavros Litsos
Correlation between conventional clinical tests and a new movement assessment battery - Bachelor thesis (poster)
Despite the complexity of movements performed in sports, physical examination is today done by conventional tests that evaluate joints and muscles individually (e.g. Smith press test, Figure1). Our study used a new movement assessment battery of 20 reach tests, which incorporates the complexity and diversity of natural human movements, taking into consideration that joints are interdependent in a movement and that the planes and sequences of a movement change during its performance. The purpose of this study was to determine whether or not there is a correlation between conventional mobility tests and the new assessment battery.
Current Problem
No simple system exists to measure forces exerted on crane rails
Forces are currently only analyzed through theory
Very difficult to accurately predict lateral and vertical forces hence
support designs may be inadequate
Potelet en atelier de maintenance
Rail encapsulé
Dalle de voie flottante
Rail noyé en résine polyuréthane
Chambre d'éclissage
Heurtoirs et tampons hydrauliques
GANTREX® Adjustable Chair
This new product compensates for movements of foundations often caused by settling, using a system of shims and elongated holes.
Une large palette de compétence: études, mesures, conception d’outillages, expertises et analyses de systèmes de chemins de roulement
Une retour d’expérience en matière de recherche de dysfonctionnements et contrôles géométriques
Des procédés exclusifs tels que l’optimisation des réglages de chemins de roulement, référentiels par plans optiques 3D
Take a deeper look at your overhead crane with Consultation ServicesKonecranes
Sometimes a more detailed evaluation is necessary than can be performed during regular crane inspections and preventive maintenance. Konecranes Consultation Services meet this need with advanced technology and trained specialists when a deeper look at your crane and its components is required.
PREVENTIVE AND CURATIVE IMPORTANCE OF THE BAROPODOMETRIC ANALYSIS FOR ERGONOM...Andresz26
La distribución de la presión en la superficie plantar puede revelar información no sólo sobre la estructura de los pies, también puede llevar a cabo la información sobre la postura del cuerpo entero no sólo para la salud sino también las condiciones patológicas. La aplicación de la ergonomía y la salud ocupacional da acceso a la corrección postural que en el largo plazo puede provocar lesiones profesionales que prestan precisión y seguridad. Este estudio es sobre 132 trabajadores de la Universidad de Las Américas.
http://www.udla.edu.ec/
13
The Scien Þc Method
Lab 1
14
Lab 1 : Scien Þc Method
15
Introduc on
What is science? You have likely taken several classes throughout your career as a student, and know
that it is more than just chapters in a book. Science is a process that uses evidence to understand the
history of the natural world and how it works. It is constantly changing as we understand more about
the natural world, and con nues to advance the understanding of the universe. Science begins with ob-
serva ons that can be measured in some way so that data can be collected in a useful manner by follow-
ing the scien Þc method.
Have you ever wondered why the sky is blue or why a plant grows toward a window? If so, you have al-
ready taken the Þrst step down the road of discovery. No ma er what the ques on, the scien Þc meth-
od can help Þnd an answer (or more than one answer!). Following the scien Þc method helps to insure
scien sts can minimize bias when tes ng a theory. It will help you to collect and organize informa on in
a useful way, looking for connec ons and pa erns in the data. As an experimenter, you should use the
scien Þc method as you conduct the experiments throughout this manual.
Concepts to explore:
Testable observa ons
Hypothesis
Null hypothesis
Experimental approach
Variables
Controls
Data collec on
Analysis
Figure 1: The process of the scien Þc method
Lab 1 : Scien Þc Method
16
The scien Þc method process begins with the formula on of a
hypothesis – a statement of what the experimenter thinks will
happen in certain situa ons. A hypothesis is an educated guess –
a proposed explana on for an event based on observa on(s). A
null hypothesis is a testable statement, that if proven true means
the hypothesis was incorrect. Both statements must be testable,
but only one can be true. Hypotheses are typically wri en in an if/
then format, such as:
Hypothesis:
If nutrients are added to soil, then plants grown in it will
grow faster than plants without added nutrients in the soil.
Null hypothesis:
If nutrients are added to the soil, then the
plants will grow the same as plants in soil
without added nutrients.
There are o en many ways to test a hypothesis.
When designing an experiment to test a hypothesis
there are three rules to follow:
1. The experiment must be replicable.
2. Only test one variable at a me.
3. Always include a control.
Variables are deÞned and measurable components of an experiment. Controlling the variables in an
experiment allows the scien st to quan tate the changes that occur so that results can be measured
and conclusions drawn. There are three types of variables:
Independent Variable: The variable that the scien st changes to a predetermined value
in order to test the hypothesis. There can only be one independent variable in each
experiment in order to pinpoint the change that a ects the outcome of the exper.
EFFECT OF POSTURAL CONTROL BIOMECHANICAL GAIN ON PSYCHOPHYSICAL DETECTION THR...ijbbjournal
A Sliding Linear Investigative Platform for Assessing Lower Limb Stability (SLIP-FALLS) was employed to study postural control biomechanical reaction to external perturbations in a short ≤16mm postural perturbation. Head acceleration were evaluated while blindfolded subjects stood on a platform that was given a short anterior perturbation presented in one of 2 sequential 4s intervals (2-Alternative-ForcedChoice) for a set of 30 trials. Anterior-Posterior head acceleration (Head Accl AP) were investigated among the movement and non- movement intervals for the healthy adults. A strong ringing signal was observed in Head Accl AP movement interval that was absent in non-movement interval. A positive power
law trading relationship was found between Head Accl AP gain and move length standing blindfolded subjects. This could explain the observed negative power law relationship between translation length and peak acceleration threshold in previous psychophysical detection threshold studies.
1. Determination of Peak Pressure Using
F-Scan ® Sensors
Dr. Antonio Valdevit, Bijan Mohazab, Michelle Osorio
Introduction
• The Tekscan® F-Scan ® system : in-shoe
plantar pressure analysis used effectively
in gait analysis to provide dynamic
pressure values.
• The system was tested to find peak
pressure and location of peak pressure by
having each subject engage in a multitude
of positions with his/her eyes opened or
closed on both two feet and on the
dominant foot.
Results
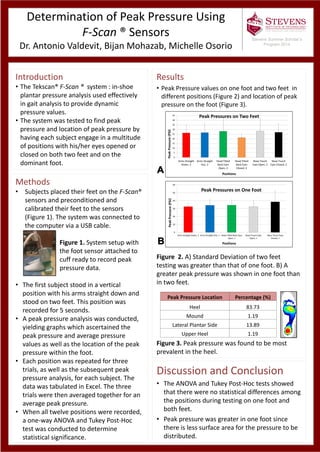
• Peak Pressure values on one foot and two feet in
different positions (Figure 2) and location of peak
pressure on the foot (Figure 3).
Figure 2. A) Standard Deviation of two feet
testing was greater than that of one foot. B) A
greater peak pressure was shown in one foot than
in two feet.
Figure 3. Peak pressure was found to be most
prevalent in the heel.
Methods
• Subjects placed their feet on the F-Scan®
sensors and preconditioned and
calibrated their feet to the sensors
(Figure 1). The system was connected to
the computer via a USB cable.
Figure 1. System setup with
the foot sensor attached to
cuff ready to record peak
pressure data.
• The first subject stood in a vertical
position with his arms straight down and
stood on two feet. This position was
recorded for 5 seconds.
• A peak pressure analysis was conducted,
yielding graphs which ascertained the
peak pressure and average pressure
values as well as the location of the peak
pressure within the foot.
• Each position was repeated for three
trials, as well as the subsequent peak
pressure analysis, for each subject. The
data was tabulated in Excel. The three
trials were then averaged together for an
average peak pressure.
• When all twelve positions were recorded,
a one-way ANOVA and Tukey Post-Hoc
test was conducted to determine
statistical significance.
Discussion and Conclusion
• The ANOVA and Tukey Post-Hoc tests showed
that there were no statistical differences among
the positions during testing on one foot and
both feet.
• Peak pressure was greater in one foot since
there is less surface area for the pressure to be
distributed.
Stevens Summer Scholar’s
Program 2014
0
5
10
15
20
25
30
35
40
45
Arms Straight
Down, 2
Arms Straight
Out, 2
Head Tilted
Back Eyes
Open, 2
Head Tilted
Back Eyes
Closed, 2
Nose Touch
Eyes Open, 2
Nose Touch
Eyes Closed, 2
PeakPressure(PSI)
Positions
Peak Pressures on Two Feet
0
10
20
30
40
50
60
Arms Straight Down, 1 Arms Straight Out, 1 Head Tilted Back Eyes
Open, 1
Nose Touch Eyes
Open, 1
Nose Touch Eyes
Closed, 1
PeakPressure(PSI)
Positions
Peak Pressures on One Foot
Peak Pressure Location Percentage (%)
Heel 83.73
Mound 1.19
Lateral Plantar Side 13.89
Upper Heel 1.19