More Related Content
Similar to Research poster 3d printing 36x48 (20)
Research poster 3d printing 36x48
- 1. RESEARCH POSTER PRESENTATION DESIGN © 2012
www.PosterPresentations.com
•The next step in the process was to print the test specimens on a MakerbotThing-O-Matic
•To ensure equivalent experimental conditions, specimens were printed in tandem. The control specimens were printed at 210°C with 100% infill using straight lines alternating 90°each layer to ensure as complete a fill as possible.
•Tensile specimens were printed at 220°C, 230°C, and 260°C, while holding all other variables constant.
•The specimens were taken toCarpenter Technology Corporation, Reading PA, andpulled on a TiniusOlsen H50KS tensile tester to determine the ultimate tensilestrength (UTS)of each piece.
•Results for UTS vs. deposition temperature were analyzed, using the average value between each pair of specimens.
Charles Hull created the 3-D printing system in 1984. The idea was to allow a user to create and test a 3-D model before investing into a full scale project. Initially the systems created by Hull’s company would print layer by layer using a UV laser to solidify photopolymers. By the late 1990’s engineered organs were created by using a 3-D printer to create the scaffolding for the structure, and in 2002 the first working 3-D kidney was created. This breakthrough led to research at Wake Forest Institute for Regenerative Medicine with the intent of printing organs and tissues with 3-D printing technology. This research would lead to the first fully 3-D printed prosthetic leg to be created and utilized in 2008; all parts including knee, foot, socket, etc. were created as one unit with no assembly required. In 2009 Makerbotindustries created an open-source hardware company with the intent of selling DIY kits for 3-D printing. This opened the amateur market to 3-D printing. In 2009 the first blood vessel was created using a bioprinter, and in 2012 the first 3-D printed prosthetic jaw was implanted on an 83-year old woman. This innovation has spurred new research into the possibilities of using the 3-D printing technology to promote bone tissue growth. The possibilities for the future of 3-D printing are endless; everything from constructing firearms, building homes, or recreating evidence for police investigations. There is even a car being created by RedEyeOn Demand, a US based manufacturer, that will be comprised of only 40 3-D printed thermoplastic parts.
Importance of Research
Additive manufacturing, as mentioned by President Obama in his State of the Union Address,is an emerging technology that is being utilized by research scientists and at-home experimenters alike. In order to fully capitalize on this powerful technology. a detailed understanding of the mechanical properties of the products must be evaluated. This project directly addresses that need.
Introduction: a Brief History of 3-D Printing
Specimen
Width
(in)
Thickness
(in)
Cross Area
(in2)
Gauge Length
(in)
Fillet Radius
(in)
Overall Length
(in)
ASTM- Standard
.5
.25
.125
2
.25
8
Utilized
.5
.25
.125
1.75
.25
3.75
Abstract
The first step was to determine the specimen dimensions to be used as the standard for the experiment. As a starting point the ASTM (American Society of Testing and Materials) provides standards for flat test specimens as shown in the chart below. However, the capabilities of the MakerbotThing-O-Maticlimits the dimensions to a 3.9375” cube. Therefore 6 specimens of varying dimensions were produced and tested to provide a range of initial results to examine, and the optimal specimen geometry relative to the ASTM standard and ultimate tensile strength was chosen.
Procedure
•The variation of UTS with infill structure was then investigated.
•The tested specimens were printed on the same 3-D printer, holding the temperature constant at 210°C.
•Specimens were printed with infill structure consisting of hollow, circular, rectangular, and hexagonal patterns, with infill density held constant at 30%.
•The following are photos of the internal structure of specimens printed with rectangular and circular infill patterns.
•The control specimens were printed at 210°C with 100% infill, using straight lines alternating 90°each layer to ensure as complete a fill as possible.
•The specimens were again taken to Carpenter Technology Corporation and pulled on a tensile tester.
•The following is a chart and table displaying the results from each of the tests. The average value between the pair of specimens was used.
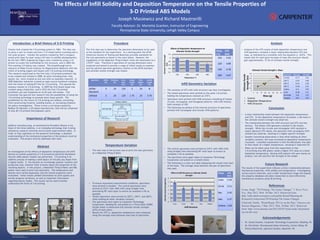
Analysis
•Analysis of the UTS results of both deposition temperature and infill geometry revealed a linear relationship between UTS and mass, as indicated by atrendlinewith the equation y=.3637x. This means that for each gram increase of mass this structure should gain approximately.37ksi of ultimatetensilestrength.
Conclusion
References
•A clear relationship exists between the deposition temperature and UTS.As the deposition temperature increased, a decrease in the ultimate tensile strength was observed.
•The relationship between the infill structure and UTS was less obvious. The hollow infill geometry resulted in the lowest strength. While the circular and rectangular infill resulted in nearly identical UTS values, the specimen with rectangular infill utilized less material, resulting in a higher specific strength.
•Another interesting observation is that while holding all other variables constant, the mass increased as deposition temperature increased.A possible explanation is that the ABSplastic was able to flow easier at a higher temperature, resulting in improved fill.
•What can be taken away from this experiment is that3-D printing onto ABS plastic yields a higher UTS value at a lower deposition temperature. Varying infill pattern will save money on product, but will sacrifice the strength of the model.
Future Research
The results of the experiment indicate a direct relationship between mechanical properties, infill solidity and temperature. Investigating various source materials, and a wider temperature range will expand the property database and allow researches to more effectively manufacture products using 3D printing.
Evans, Hugh. "3D Printing: The Game Changer."T. Rowe Price. N.p., May 2012. Web. 30 Mar. 2013. Retrieved from: http://individual.troweprice.com/public/Retail/Planning-&- Research/Connections/3D-Printing/The-Game-Changer
Chalcraft, Emilie. "Road-Ready 3D Car on the Way."Deezen.com. DeezenMagazine, 7 Mar. 2013. Web. 30 Mar. 2013. Retrieved from: http://www.dezeen.com/2013/03/07/road-ready-3d-printed- car-on-the-way/
An investigation of the effects of deposition temperature and infill density on tensile properties of 3-D printed Acrylonitrile-Butadiene- Styrene (ABS) plastic models was performed.3-D printing is an additive process of making a solid object of virtually any shape from a digital model.It has become an increasingly popular research and production tool, however little is known about the properties of the resulting objects.In this project, a MakerbotThing-O-Maticand ABS plastic were used to print test specimens.The temperature and density were varied separately, and the tensile properties were evaluated. Initial results yielded information on print quality and tensile property variations, as well as important information regarding failure modes.The resultscan be usedto better understand the limits of 3-D printing.
Temp.
(°C)
UTS
(ksi)
210
5.03
220
4.89
230
4.78
260
4.67
Shape
UTS
(ksi)
Lines
5.03
Circle
3.51
Rec.
3.45
Hex.
3.27
Hollow
2.83
Specimen
Mass (g)
UTS (ksi)
Control
12.77
5.03
220°C
12.97
4.89
230°C
12.91
4.78
260°C
13.30
4.67
Hollow
8.11
2.82
Circle
10.08
3.51
Rectangle
9.56
3.45
Hexagon
9.87
3.26
Faculty Advisor: Dr. Marietta Scanlon, Instructor of Engineering
Pennsylvania State University, Lehigh Valley Campus
Joseph Masiewiczand Richard Mastrorilli
The Effects of Infill Solidity and Deposition Temperature on the Tensile Properties of
3-D Printed ABS Models
Temperature Variation
Control
Deposition Temperature
Infill Structure
Infill Geometry Variation
Infill Structure
2
2.5
3
3.5
4
4.5
5
5.5
7
8
9
10
11
12
13
14
Ultimate Tensile Strength (ksi)
Mass (g)
Ultimate Tensile Strength v. Mass
Acknowledgements
•Dr. James Scanlon, Carpenter Technology Corporation, Reading, PA
•Dr. Hal Scholz, Pennsylvania State University, Center Valley, PA
•Felicia Mastrorilli, Aperture Studios, Nazareth, PA
0
1
2
3
4
5
6
Lines
Circle
Rec.
Hex.
Hollow
Ultimate Tensile Strength (ksi)
Effect of Infill Structure on Ultimate Tensile Strength
4.2
4.4
4.6
4.8
5
5.2
210
220
230
260
Ultimate Tensile Strength (ksi)
Effects of Deposition Temperature on Ultimate Tensile Strength
Temperature °C