More Related Content
Similar to Fish Feed Crude Fiber Levels Impact Tilapia Growth
Similar to Fish Feed Crude Fiber Levels Impact Tilapia Growth (20)
Fish Feed Crude Fiber Levels Impact Tilapia Growth
- 1. RESEARCH POSTER PRESENTATION DESIGN © 2012
www.PosterPresentations.com
The current annual average growth rate (3.2%), of the world
fish food supply has outpaced the world annual population
increase of 1.7% (FAO, 2012). By 2008, Uganda was the
second largest aquaculture producing country after Nigeria
(56%), producing up to 22% of food fish in sub-Saharan Africa
(FAO, 2010).It is no surprise, therefore, that today fish
export is the second largest foreign income earner after
coffee, despite the declined capture fishery catches (MAAIF,
2011).
Fish farming is constraints by several factors, but a high cost
of fish feeds is paramount, forming up to 50% of the total
variable production costs (Shang, 1992; Craig et al., 2002;
Munguti, 2006). In solution, many fish farmers with low-
input pond culture systems mix their own on-farm feed
rations from readily and locally available feedstuffs.
However, the performance of these feeds is usually low
despite having the required crude protein (CP) levels, due to
high crude fibre (CF) content. CF is the carbohydrate that
cannot be digested by fish (Cockerell et. al. (1971) and
Munguti et al. (2006).
BACKGROUND
OBJECTIVES
The study was done in Ngetta ZARDI, Lira. The CF was varied in three formulations containing fish meal (FM), maize bran (MB)
and local brewers´ waste, ``malwa´´ (BW). These were assigned to one cubic meter cages in triplicate, stocked with mixed sex
O. niloticus post-fingerlings at an average weight of 18.6 g) and stocking densities of 30 fish per cubic meter. The fish were fed at
5% body weight for 90 days, twice a day between10:00 and 16:00 hours by broadcasting. The fish were sampled and the physical-
chemical parameters (dissolved oxygen (DO), pH, temperature, conductivity and transparency) were collected at the inlet and
outlet between 9:00 and 10:00 hours every day at two depths of 0 cm and 25 cm. Chlorophyll a (Chl-a) data was collected
biweekly using a procedure adopted from APHA (1995).
The proximate composition (crude protein (CP, ether extracts (EE), Crude fibre (CF), nitrogen free extracts (NFE), moisture
content (DM) and ash) of feed ingredients and formulations (table 1) was done using methods as described in AOAC (1995).
Data was analysed using IBM SPSS Statistics 20. One-way analysis of variance (ANOVA) and Duncan’s multiple range test was used
to determine significant differences between means (Liti et al. 2006). Extended multiple regression was done to test the impact
of water quality on fish growth and Spearman's correlation used to determine the interactions between proximate nutrients in the
test diets and the growth performance parameters. Differences were declared significant at P < 0.05 and P < 0.01 depending on
the test.
MATERIALS & METHODS
Table 1: Proximate composition of the ingredients and test diets on dry matter basis.
(Mean ± SE; n = 3).
RESULTS
DISCUSSION
High CF content feeds have low palatability (Jauncey, 1998)
and have been reported to reduce growth and dietary
protein utilization in a number of fish species (Leary &
Lovell, 1975; Anderson et al., 1984; Fontainhas-ernandes et
al., 1999; Liti et al., 2007). The findings of this study attest
to this because CF had a strong negative correlation
(P<0.01) to specific growth rate (SGR) and food conversion
ratio (FCR) as in figure 1. Others in support of this argument
include; Tacon 1997; Lovell 1980; Hossain et al., 2003;
Bureau et al., 1998; Shao et al., 2002 and Fagbenro, 1998
(Munguti, 2007).
Gatlin, 2010, reports that CF levels in fish feeds less than 7%
of the diet could limit the amount of undigested material
entering the culture system that leads to water quality
deterioration.This is because cellulase activity is limited in
many fish species as fish lack endogenous, cellulose
digesting enzymes (Stickney & Shumway, 1974; Liti et al.,
2006).
Conclusion
Dietary crude fibre levels exceeding 7 % reduce fish growth.
REFERENCES
• A.O.A.C (1985). Official methods of Analysis. U.S.A.
• FAO (2010), 1061; 4. and FAO (2012). The state of world
fisheries and aquaculture. Rome .
• Gatlin, D.M. (2010). Principles of Fish Nutrition. SRAC.
5003.
• Jauncey, K. (1998). Tilapia feeds and feeding. U.K.
• Liti et al. (2007), Aquaculture Nutrition 12; 239 – 245 and
Aquaculture Research 37; 477- 483.
• Munguti, J. et al. (2006), Die Bodenkultur. 3; 57. and
(2007). pHD Thesis
CONTACT
National Agricultural Research and Development
Organisation, NARO.
Ngetta ZARDI
P.O.Box 52
Lira.
Main objective
To determine the optimal crude fibre levels in a fish feed for
better fish growth and yield.
Specific objectives
• Determine the nutritive value of the feed stuffs; fish
meal (FM), maize bran (MB) and local brewers´ waste,
``malwa´´ (BW) and the formulations out of them F1, F2
& F3.
• Determine which of the test diets (F1, F2 & F3) of varying
CF content performs best as fish feed.
Hypothesis
High crude fibre levels decrease tilapia fish growth.
Authors: Pauline Nakyewa and Aguzu Alex
EFFECT OF VARYING FISH FEED CRUDE FIBER LEVELS ON
NILE TILAPIA, Oreochromis niloticus L. GROWTH.
Nutrients
Feed
DM Ash EE CP CF NFE
g/kg DM
FM 874 + 0.9 182 + 1.9 187 + 1.3 660 + 0.6 13 + 0.1 66 + 7.1
MB 890 + 0.3 31 + 0.01 40 + 1.01 118 + 0.9 125 + 1.61 577 + 11.0
BW 900 + 0.2 12 + 1.6 81 + 0.5 174 + 0.4 179 + 0.1 455+ 1.4
F 1 925 + 0.0 5 + 0.1 102 + 0.1 25.1 + 0.3 54 + 0.0 628 + 0.6
F 2 910 + 0.2 4 + 0.2 71 + 0.4 25.3 + 0.1 69 + 0.7 662 + 0.1
F 3 901 + 1.3 10 + 0.1 38 + 0.0 25.1 + 2.0 81 + 0.9 668 + 0.2
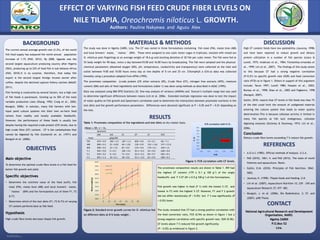
Figure 2: Standard error growth curves for O. niloticus fed
on different diets at 8 % body weight .
Figure 1: FCR correlation with CF levels.
The proximate composition results are shown in Table 1. BW had
the highest CF content (179 ± 0.1 g 100 g-1) of the single
feedstuffs and F 3 CF (81 ± 0.9 g 100 g-1) of the formulations.
Fish growth was higher in feed (F 1) with the lowest % CF, and
lowest in F3 with the highest % CF. However, F1 and F 2 growth
did not differ statistically (P > 0.05) but F 3 was significantly (P
< 0.05) lower.
The study revealed that CF had a strong positive correlation with
the feed conversion ratio, FCR (0.94) as shown in figure 1 but a
strong negative correlation with specific growth rate, SGR (0.90).
CF levels above 7 % reduced fish growth significantly
(P < 0.05) as evidenced in figure 2.