Download to read offline


![Introduction
• The first three phases of Data Analytics Lifecycle- discovery, data
preparation, and model planning, involve various aspects of data
exploration. The success of a data analysis project requires a deep
understanding of the data, it requires a tool for data mining and presenting
the data. We can use decision tree as a tool for data mining and R for
presenting the data.
• Data Mining is an analytic process designed to explore data (usually large
amounts of data - also known as "big data") in search of consistent patterns
and/or systematic relationships between variables, and then to validate the
findings by applying the detected patterns to new subsets of data. The
ultimate goal of data mining is prediction. The most common type of data
mining is Predictive data mining and it is the one that has the most direct
business applications. [1] 5](https://image.slidesharecdn.com/researchpaperpresentation-160505102700/85/Research-paper-presentation-5-320.jpg)
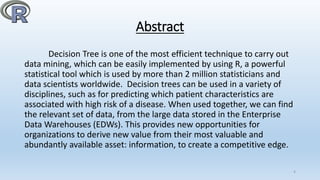
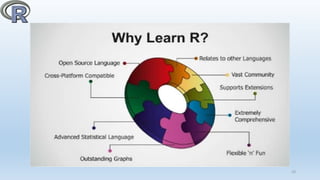
![Figure 1. A schematic view of how ‘R’ works. [2]
8](https://image.slidesharecdn.com/researchpaperpresentation-160505102700/85/Research-paper-presentation-8-320.jpg)
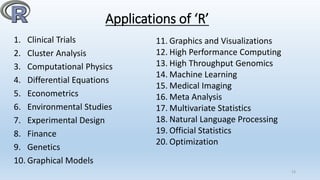
![Packages in ‘R’
• The most important single innovation in ‘R’ is the package
system, which provides a cross-platform system for distributing
and testing code and data.
• The Comprehensive R Archive Network (http://cran.r-
project.org) distributes public packages, but packages are also
useful for internal distribution.
• A package consists of a directory with a DESCRIPTION file
and subdirectories with code, data, documentation, etc. The
Writing R Extensions manual documents the package system,
and package.skeleton() simplifies package creation. [3]
11](https://image.slidesharecdn.com/researchpaperpresentation-160505102700/85/Research-paper-presentation-11-320.jpg)
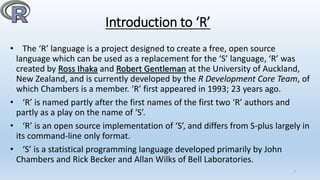
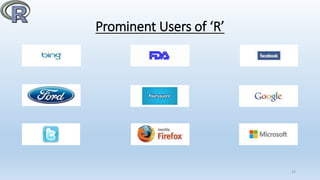
![Package Description
base Base R functions
datasets Base R datasets
grDevices Graphics devices for base and grid graphics
graphics R functions for base graphics
methods Formally defined methods and classes for R
objects
stats R statistical functions
utils R utility functions
12
Table 1. ‘R’ packages, loaded on startup. [4]
The libraries shown in Table 1 are loaded on the ‘R’ startup.](https://image.slidesharecdn.com/researchpaperpresentation-160505102700/85/Research-paper-presentation-12-320.jpg)
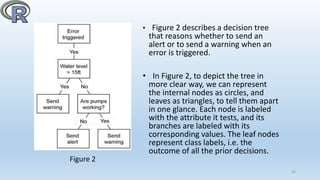
![INTRODUCTION TO DECISION TREE
• A decision tree is also called a prediction tree. A decision tree uses a
structure to specify sequences of decisions and consequences. Given
input X={X1, X2,..,Xn}, the goal is to predict a response or output
variable Y. [5] Each member of the set {X1,X2,…,Xn} is called an input
variable.
• A decision tree consists of nodes, and thus form a rooted tree, this
means that it is a directed tree with a node called root. There are no
incoming edges on root node, all other nodes in a decision tree have
exactly one incoming edge. An internal node is a node with an
incoming edge and outgoing edges, internal node is also known as
test node. Nodes with no outgoing edges are known as leaves or
terminal nodes.
15](https://image.slidesharecdn.com/researchpaperpresentation-160505102700/85/Research-paper-presentation-15-320.jpg)
![THE GENERAL DECISION TREE ALGORITHM
• The objective of a decision tree algorithm is to construct a tree ‘T’ from
a training set ‘S’. If all the records in ‘S’ belong to some class ‘C’, or if ‘S’
is sufficiently pure, then that node is considered a leaf node and
assigned the label ‘C’. The purity of a node is defined as its probability of
the corresponding class. [6]
• The algorithm constructs subtrees for the subsets of S recursively until
one of the following criteria is met: [7]
1. All the leaf nodes in the tree satisfy the minimum purity threshold.
2. The tree cannot be further split with the preset minimum purity
threshold.
3. Any other stopping criterion is satisfied (such as the maximum depth
of the tree).
17](https://image.slidesharecdn.com/researchpaperpresentation-160505102700/85/Research-paper-presentation-17-320.jpg)
![DECISION TREES IN ‘R’
• In ‘R’, ‘rpart’ is for modelling decision trees, and an optional package
‘rpart.plot’ enables the plotting of a tree. [8] The rpart package can
be used for classification by decision trees and can also be used to
generate regression trees.
• To grow a tree, use: [9]
rpart (formula, data=, method=, control=)
Where,
18](https://image.slidesharecdn.com/researchpaperpresentation-160505102700/85/Research-paper-presentation-18-320.jpg)
![• Entropy and information gain are common technical
terms/notations used in decision trees.
• Entropy is a measure of the number of random ways in which a
system may be arranged. For a data set ‘S’ containing ‘n’ records the
information entropy is defined as,[10]
• Let Hx is entropy of X defined as: [11]
(Here ‘Px’is the proportion of ‘S’)
19](https://image.slidesharecdn.com/researchpaperpresentation-160505102700/85/Research-paper-presentation-19-320.jpg)
![References
[1] Data Mining Techniques. [Online]. Available:
•http://documents.software.dell.com/Statistics/Tex
tbook/Data-Mining-Techniques [Accessed 21
November 2015].
[2] Emmanuel Paradis, “R for Beginners”, CRAN.
Figure 1, pp. 8. [Online]. Available:
•https://cran.r-project.org/doc/contrib/Paradis-
rdebuts_en.pdf [Accessed 22 August 2015].
[3] Thomas Lumley, “R Fundamentals and
Programming Techniques,” in R Packages, January
2015, pg. 416. [Online].
[4] Adedin Culhane, Harvard School of Public
Health, BIO503, January 2013, “Introduction to
Programming and Statistical Modelling in R”.
[Online]. Available:
http://isites.harvard.edu/fs/docs/icb.topic1202070.fil
es/Bio503_winter13.pdf [Accessed 22 August 2015]. 21
[5] EMC Education Services, “Data Science and Big Data
Analytics,” in Advanced Analytical Theory and Methods:
Classification, January 2015, pp. 192.
[6] EMC Education Services, “Data Science and Big Data
Analytics,” in Advanced Analytical Theory and Methods:
Classification, January 2015, pg. 197.
[7] EMC Education Services, “Data Science and Big Data
Analytics,” in Advanced Analytical Theory and Methods:
Classification, January 2015, pg. 197.
[8] EMC Education Services, “Data Science and Big Data
Analytics,” in Advanced Analytical Theory and Methods:
Classification, January 2015, pg. 206.](https://image.slidesharecdn.com/researchpaperpresentation-160505102700/85/Research-paper-presentation-21-320.jpg)
![[9] Data Mining Algorithms In R / Classification /
Decision Trees. [Online]. Available:
https://en.wikibooks.org/wiki/Data_Mining_Algo
rithms_In_R/Classification/Decision_Trees
[Accessed 27 November 2015].
[10] Venkatadri.M, Lokanatha C. Reddy. (2010, Apr.-
2010, Sept.). A comparative study on decision tree
classification algorithms in data mining.
International Journal of Computer Application in
Engineering, Technology and Sciences (IJ-CA-ETS).
[Online]. 1.1, pg. 1. Available:
https://www.academia.edu/
[11] Anuj Srivastava, Dr. Vinodini Katiyar, Navjot
Singh. (2015, June). AReview of Decision Tree
Algorithm: Big Data Analytics. International Journal
of Informative & Futuristic Research. ISSN (Online):
2347-1697, pg. 6.
22](https://image.slidesharecdn.com/researchpaperpresentation-160505102700/85/Research-paper-presentation-22-320.jpg)


The document explains the use of decision trees for data mining and their implementation using the R programming language, which is favored for its open-source nature and extensive library support. It outlines the decision tree structure and algorithm, detailing how R functions like 'rpart' facilitate modeling and visualization. Additionally, it emphasizes the significant advantages of R in comparison to other software tools like SAS and MATLAB for classification tasks.


![제 23회 보아즈(BOAZ) 빅데이터 컨퍼런스 - [MBOAX] : ABSA를 활용한 소비자 반응 분석 기반 운영 효율화 대시보드 설계](https://cdn.slidesharecdn.com/ss_thumbnails/3-1boaz23rdconferencemboax-260203102709-9d519923-thumbnail.jpg?width=640&height=640&fit=bounds)


