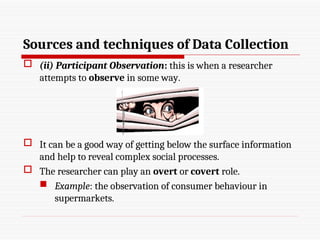
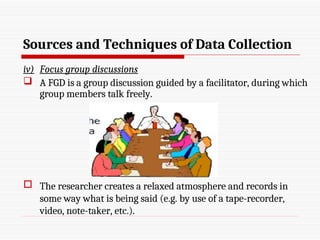
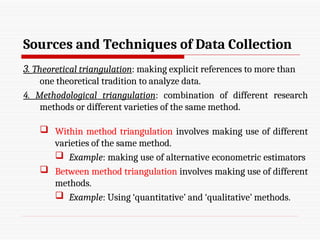
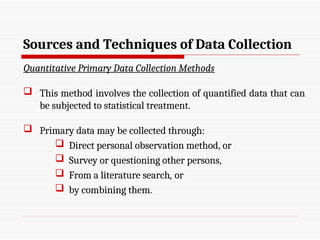
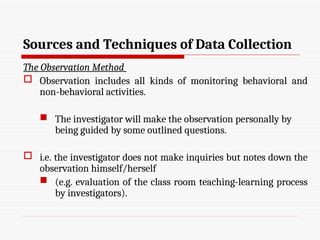
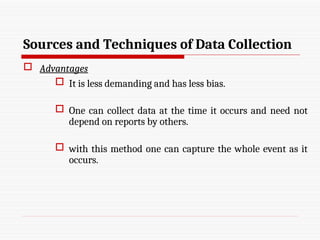
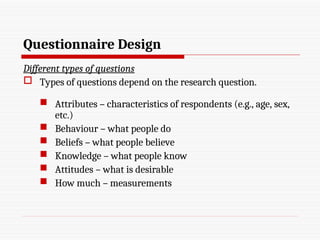
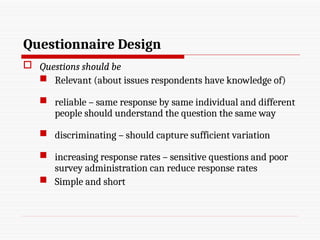
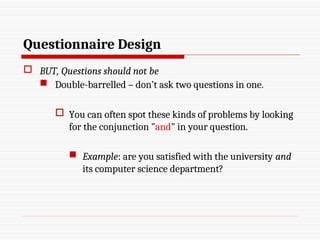
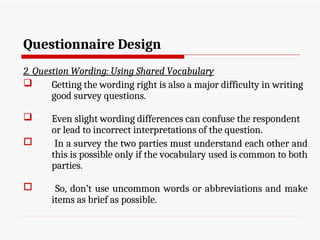
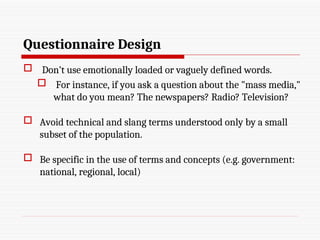
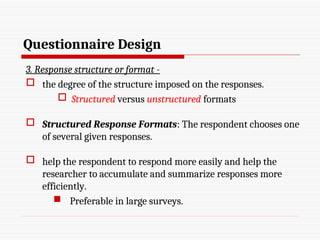
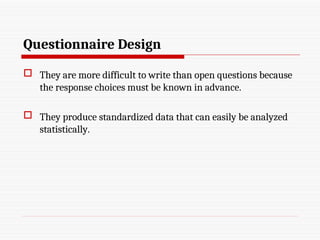
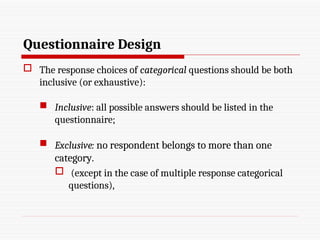
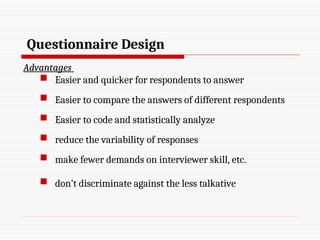
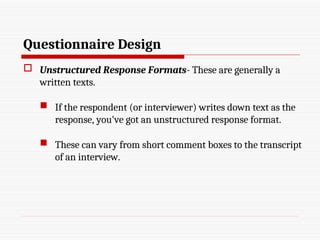
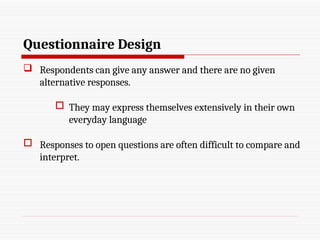
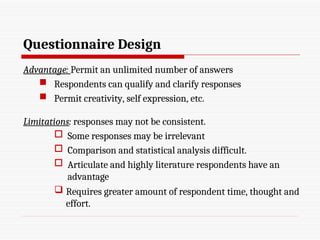
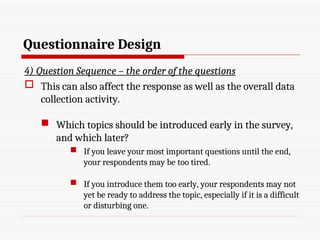
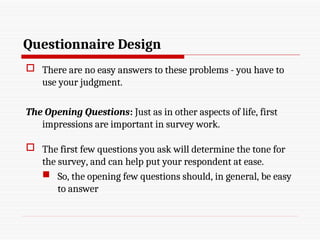
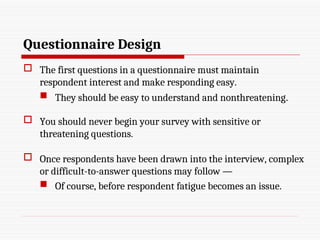
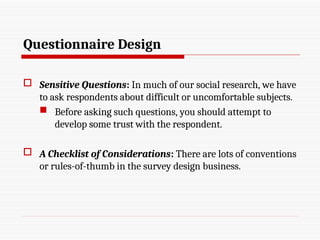
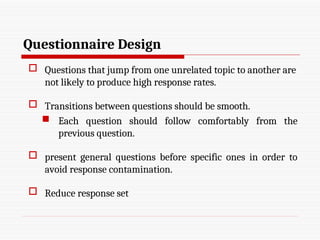
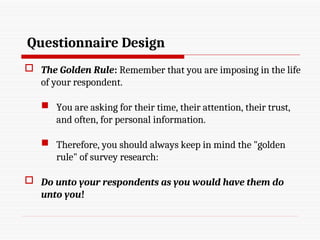
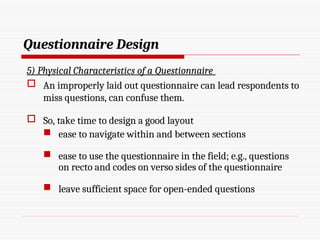
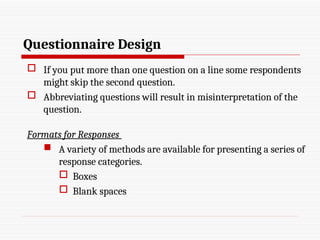
ACFN 3111-
Research Methods in Accounting & Finance
Chapter V
The Sources and Collection of Data
Content of the Lecture
1. Introduction
2. Data Collection methods
 Types and sources of Data
 Methods of primary Data collection
 Methods of secondary Data collection
3. Data management issues
4. Sources and Techniques of Data Collection
5. Questionnaire Design
Introduction
 Data are the foundations of research.
 The quality of any investigation heavily depends on the
quality of information or data used.
 So, proper data collection, retention, and sharing are vital
to the research enterprise.
 What is Data?
 Data refers to any group of facts, measurements, or
observations used to make inference about the problem of
investigation.
Introduction
 It can range from material created in a laboratory, to
information obtained in economic research, such as a filled-
out questionnaire, video and audio recordings, or photographs,
etc.
 We need to design strategies that would enable us to create
meaningful and unbiased data,
 that will not waste resources, and
 that will appropriately protect human and animal subjects.
Introduction
 When selecting data we need to be clear on:
 The data type (e.g., nominal, ordinal, interval or ratio
measures).
 Samples ("frames") and sample size, instruments.
 Methodologies for collecting data, etc.
 And, to ensure high quality output, data gathering should
be well planned.
Introduction
 Hence, we need to plan and define properly:
 The objective of the data collection exercise
 The kind of data (information) to be collected
 The source of the data
 The methods to be used to collect data
 This helps us to determine the statistical techniques to be
employed.
 It also helps us to avoid gathering of irrelevant
information.
Data Collection Methods
 Data collection is the process of gathering and measuring
information on the variables of interest.
 The data source could be:
 an area from where we can collect the data (i.e.
geographic location),
 persons to be interviewed,
 An entity or organization,
 discussions to be observed, etc.).
Data Collection Methods
 Although data collection methods may vary by discipline and
data types, the emphasis on ensuring accurate collection
remains the same.
 Some of the consequences from improperly collected data
may include:
 Inability to repeat and validate the study.
 Distorted and inaccurate findings.
 Wasted resources.
 Misleading other researchers.
 Harm to human participants and animal subjects.
Data Collection Methods
 More importantly, poor data collection may cause harm to
society when the results of the flawed research are used to
support public policy recommendations.
Data management issues
 Storage and Protection
 Data must be stored securely both during a research
project and after it ends.
 Risks like fire, water or other environmental damage, or
common technical failures like hard disk crashes, must
be considered.
 So, make backup copies of the data periodically and
store the copies in a secure location.
Data management issues
 Confidentiality
 refers to limiting information access and disclosure to
authorized users- preventing access by or disclosures to
unauthorized persons.
 So you need to decide
 who can handle which portion of data,
 at what point during the project,
 for what purpose, and so on
Data management issues
 Integrity
 Integrity refers to the trustworthiness of the information.
 Researchers need to have sufficient skills to ensure the
integrity of their data collection efforts.
 For instance, data collection requires a rigorous and
detailed recruitment and training plan for data collectors.
 So, data should not be modified inappropriately, whether
accidentally or deliberately.
Sources and Techniques of Data collection
 Sources of data can be grouped into primary and secondary
sources of data
Secondary Sources of data
 Secondary sources are those, which have been collected by
other individuals or agencies.
 i.e. refers to already existing information which have
previously been collected and reported by some
individual or organization for their own purposes.
Sources and Techniques of Data collection
 As much as possible secondary data should always be
considered first, if available.
 WHY REINVENT THE WHEEL IF THE DATA ALREADY
EXISTS!
Sources and Techniques of Data Collection
 But, when dealing with secondary data you should ask:
 Is the owner of the data making them available to you?
 Is it free of charge? If not, how will you pay?
 Are the data in a format that you can work with? etc.
 A description of the sampling technique, i.e., how the
sample was collected is also necessary, etc.
Sources and Techniques of Data Collection
Sources of Secondary Data
 Secondary data may be acquired from various sources:
 Documents (reports of various kinds, books, periodicals,
reference books (encyclopedia), university publications
(thesis, dissertations, etc.), policy documents, statistical
compilations, proceedings, personal documents
(historical documents, Data archives, etc.
 The Internet
Sources and Techniques of Data Collection
Advantages of Secondary data
 Can be found more quickly and cheaply.
 Most researches on past events or distant places have to
rely on secondary data sources.
Limitations
 Authenticity:
 genuine?
 credible?
 representative?
Sources and techniques of Data Collection
 Completeness???
 The information often does not meet one’s specific needs.
 Definitions might differ, units of measurements may
be different and different time periods may be
involved.
 Data could also be out of date.
Sources and Techniques of Data Collection
Primary Sources of Data
 These are data collected by the investigator (immediate
user) for the 1st
time.
 Two approaches to primary data collection:
 the qualitative approach and
 the quantitative approach
Sources and techniques of Data Collection
Qualitative data collection approaches
 Qualitative data can be acquired from:
 case studies,
 Participant Observation
 Rapid appraisal methods,
 focus group discussions and
 key informant interviews, etc.
i) Case studies: involves a detailed investigation of a particular
case.
Sources and techniques of Data Collection
 (ii) Participant Observation: this is when a researcher
attempts to observe in some way.
 It can be a good way of getting below the surface information
and help to reveal complex social processes.
 The researcher can play an overt or covert role.
 Example: the observation of consumer behaviour in
supermarkets.
Sources and Techniques of Data Collection
iii) Participatory Rapid Appraisal (PRA)
 PRA is a systematic expert observation usually by a
multidisciplinary team.
 The PRA method:
 takes only a short time to complete,
 tends to be relatively cheap, and
 make use of more 'informal' data collection procedures.
Sources and Techniques of Data Collection
iv) Focus group discussions
 A FGD is a group discussion guided by a facilitator, during which
group members talk freely.
 The researcher creates a relaxed atmosphere and records in
some way what is being said (e.g. by use of a tape-recorder,
video, note-taker, etc.).
Sources and Techniques of Data Collection
 Mostly used to gather opinions, from a selected group of people
on a particular and pre-determined topic, e.g. consumer topic;
political topic etc.
 About 10 people would be engaged in a discussion on the topic
in an informal setting.
 The researcher encourages free discussion, but is ready to
intervene if necessary to resolve group problems.
 The group of individuals are expected to have experience or
opinion on the topic.
Sources and Techniques of Data Collection
 Its purpose is to obtain in-depth information on concepts,
perceptions and ideas of a group.
 Focus groups can be a useful way of finding out what the
main issues and concerns of any group are.
 It is more than a question-answer interaction.
 group members discuss the topic and interact among
themselves with guidance from the facilitator.
Sources and Techniques of Data Collection
Why use focus groups?
 The main purpose of a focus group research is to draw upon
group’s attitudes, feelings, beliefs, experiences and reactions.
 attitudes, feelings and beliefs may likely be revealed via
interaction in social gatherings.
 Compared to individual interviews, which aim to obtain
individual attitudes, beliefs and feelings, focus groups elicit a
multiplicity of views.
Sources and Techniques of Data Collection
Strengths and weakness of FGDs
 It provides valuable information in a short period of time and
at relatively low cost if the groups have been well chosen, in
terms of composition and number.
 But, their use as a research tool is limited when it comes to
measuring the results objectively.
Sources and Techniques of Data Collection
 FGD should not be used for quantitative purposes, such as the
testing of hypotheses or the generalization of findings for
larger areas
 Which require more elaborate surveys.
 In addition, the logistical complexity of focus group research
is frequently cited as a deterrent.
Sources and Techniques of Data Collection
 In addition, it may be risky to use FGDs as a single tool because
in:
 group discussions, people tend to center their opinions on the
most common ones.
 In case of very sensitive topics group members may hesitate
to express their feelings and experiences freely.
 Therefore, it is advisable to combine FGDs with other methods
(in-depth interviews).
Sources and Techniques of Data Collection
v) Key Informant Interview
 An interviewing process with opinion leaders such as elected
officials, government officials, and business leaders, etc.
 This technique is particularly useful for:
 Raising community awareness about socio-economic
issues
 Learning minority viewpoints
 Gaining a deeper understanding of opinions and
perceptions, etc.
Sources and Techniques of Data Collection
v) Triangulation
 refers to the use of more than one approach to the
investigation of a research question in order to enhance
confidence in the findings.
 Why use triangulation
 The purpose of triangulation is to obtain confirmation of
findings through convergence of different perspectives.
 By combining multiple methods, and empirical materials,
researchers can overcome the weakness or biases and
problems that are associated with a single method.
Sources and Techniques of Data collection
Taxonomy of triangulation
1. Data triangulation: Involves gathering data at different times
and situations, from different subjects using different sampling
techniques.
 Example: Using time series data.
2. Investigator triangulation: involves using more than one
researcher to collect and analyze the data.
 Example: organizing scientific experiments to replicate each
other’s work.
Sources and Techniques of Data Collection
3. Theoretical triangulation: making explicit references to more than
one theoretical tradition to analyze data.
4. Methodological triangulation: combination of different research
methods or different varieties of the same method.
 Within method triangulation involves making use of different
varieties of the same method.
 Example: making use of alternative econometric estimators
 Between method triangulation involves making use of different
methods.
 Example: Using ‘quantitative’ and ‘qualitative’ methods.
Sources and Techniques of Data Collection
Quantitative Primary Data Collection Methods
 This method involves the collection of quantified data that can
be subjected to statistical treatment.
 Primary data may be collected through:
 Direct personal observation method, or
 Survey or questioning other persons,
 From a literature search, or
 by combining them.
Sources and Techniques of Data Collection
The Observation Method
 Observation includes all kinds of monitoring behavioral and
non-behavioral activities.
 The investigator will make the observation personally by
being guided by some outlined questions.
 i.e. the investigator does not make inquiries but notes down the
observation himself/herself
 (e.g. evaluation of the class room teaching-learning process
by investigators).
Sources and Techniques of Data Collection
 Advantages
 It is less demanding and has less bias.
 One can collect data at the time it occurs and need not
depend on reports by others.
 with this method one can capture the whole event as it
occurs.
Sources and techniques of Data Collection
Weakness of the Method
 The observer normally must be at the scene of the event when
it takes place.
 But it is often difficult or impossible to predict when and
where an event might occur.
 It is also a slow and expensive process.
 Its most reliable results are restricted to data that can be
determined by an open or surface indicator.
 Difficult to learn about past events and to gather information
on intensions, attitudes, opinions and preferences.
Sources and Techniques of Data Collection
The Survey Method: the most commonly used method in economics.
 To survey is to ask people questions in a questionnaire.
 In a survey, a trained interviewer asks the questions and
records responses on a specially designed form.
 The form contains all the questions which would extract
information from a respondent.
Sources and Techniques of Data Collection
Strength of the Survey Method
 It is a versatile or flexible method - capable of many
different uses.
 More efficient and economical than observations -surveying
using telephone or mail is less expensive.
 If planned correctly, a survey makes it easy for people to
participate.
 Same questions can be asked in several ways to double-check
for accuracy and consistency.
Sources and Techniques of Data Collection
Weakness of the Method
 The quality of information depends heavily on the ability and
willingness of the respondents.
 A respondent may interpret questions or concept
differently from what was intended by the researcher.
 A respondent may deliberately mislead the researcher by
giving false information.
Sources and Techniques of Data Collection
 People surveyed may not answer all questions.
 Low response rate is common.
 People can and do lie.
 Can’t test knowledge with mailed surveys.
Main modes of administration of a survey
Sources and Techniques of Data Collection
 Surveys could be carried out through:
 face to face personal interview
 telephone interview
 mail or e-mail, or by a combination.
 a) Personal Face to face Interview
 It is a two-way conversion where one person interviews
another person.
 interviewers ask the questions and mark the answers,
either on paper or by typing them onto a computer.
Sources and Techniques of Data Collection
 Advantages of face to face Interview:
 enhances respondent participation,
 guiding the questioning process,
 answering the respondent’s questions,
 clarifying the meaning of questions and responses,
 probing, clarifying and motivating the respondent to
complete the questionnaire,
 making sure that the questionnaire is answered in the pre-
defined sequence and by the respondent himself or herself.
 In addition, visual aids are possible in face-to-face interviews
but not in telephone surveys.
Sources and Techniques of Data Collection
 The depth and detail of the information that can be secured far
exceeds the information secured from telephone or mail
surveys.
 Interviewers can probe additional questions, gather
supplemental information.
 Interviewers can make adjustments to the language of the
interview because they can observe the problems and effects
with which the interviewer is faced.
Sources and Techniques of Data Collection
Limitations of the Method
 The method is an expensive enterprise – (e.g., locating
respondents) – US$50-80.
 Hence, personal interviews are generally used only
when subjects are not likely to respond to other
methods.
 susceptible to interviewers’ bias/mistakes
 Interviewer may also be reluctant to visit unfamiliar
places.
Sources and Techniques of Data Collection
b) Telephone Interview
 Telephone can be a helpful medium of communication in
setting up interviews.
 telephone numbers are picked, using some sampling
technique, from a telephone directory.
 Then the survey will be administered by calling and
interviewing those who are selected in the sample via
telephone.
 Telephone surveys are the fastest method of gathering
information from a relatively large sample - generally last
less than ten minutes.
Sources and Techniques of Data Collection
Strengths of this method
 Moderate travel and administrative costs
 Faster completion of study
 Responses can be directly entered on to the computer
 Speed of administration; no geographic limitations; etc.
Sources and Techniques of Data Collection
Limitations of this method
 Respondents must be available by phone.
 The length of the interview period is short.
 limited in length and scope.
 those interviewed by phone find the experience to be less
rewarding than a personal interview.
Sources and Techniques of Data Collection
C) Interviewing by mail (Solicited responses)
 Self-administrated questionnaires may be used in surveys.
 Questionnaires will be sent to respondents through their email
or postal address.
 Respondents are expected to fill out the questionnaires and
send them back the same way.
 Self-administered surveys do not need interviewers.
 Respondents mark, write or type the answers themselves.
Sources and Techniques of Data Collection
 They are ideal for large sample sizes, or when the sample comes
from a wide geographic area.
 Questionnaires must be easily understandable since there is no
possibility for respondents to ask how to mark answers or what a
question might mean.
Advantages
 Lower cost than personal interview
 Persons who might otherwise be inaccessible can be contacted
(major corporate executives)
 Less interviewer bias
 better protects privacy/anonymity
Sources and Techniques of Data Collection
Disadvantages
 Non response error is high
 Large amount of information may not be acquired
 Literacy of the respondents is necessary, and the language of
the respondents must be known in advance.
 We have no control who responds or whom the respondent
consults.
 We have no control for the bias originating from the self-
selection process (respondents choose freely whether they
respond or not).
Sources and Techniques of Data Collection
d) Online Surveys (E-mail / Internet)
 Internet surveys allow researchers to reach a large sample more
quickly.
 Sample size requirements can be met easily.
 Internet surveys are relatively new and little is known about the
effect of sampling bias in internet surveys.
Advantages:
 Very inexpensive -saves inputting costs as well
 Respondents feel privacy
Sources and Techniques of Data Collection
Disadvantages:
 A sample of Internet users is representative only of Internet
users, who tend to be younger, better educated, and more
affluent than the general population.
 Very biased toward wealthy and the young.
 The demographic profile of the internet user does not always
represent the general population.
 Therefore, before doing an e-mail or internet survey,
carefully consider the effect that this bias might have on the
results.
Questionnaire Design
 The instrument design begins by drafting specific
measurement questions in the form of a questionnaire.
 A questionnaire is a research instrument consisting of a
set of questions intended to capture responses from
respondents.
 Questionnaires consist of questions.
 A well formed questionnaire is key to good research
Questionnaire Design
 The construction of a questionnaire requires a marriage of
art and science to achieve two primary goals:
 address the survey objectives,
 smooth conversational flow.
 But, why use questionnaires?
Questionnaire Design
 Questionnaires are easy to analyze.
 Data entry and tabulation can be easily done with many
computer software packages.
 Questionnaires are familiar to most people.
 Nearly everyone has had some experience completing
questionnaires and they generally do not make people
apprehensive.
 Questionnaires reduce bias.
 There is uniform question presentation.
Questionnaire Design
 Questions may be unstructured (respondents provide a response
in their own words) or structured (respondents select an answer
from a given set of choices).
 Structured questionnaires can be designed as:
 Dichotomous: having only two alternative responses E.g. are
you married? Yes No
 Multiple choice: having numerous alternative responses
 E.g. what is your marital status?
 Married Single
 Widowed Divorced
Questionnaire Design
The main Components of a questionnaire
 Identification data: respondent’s name, address, time and
date of interview, code of interviewer, etc.
 Covering letter: brief purpose of the survey, who is doing it,
time involved, ethical statements, etc.
 Instruction: clear and concise instructions on how to
complete the questionnaire.
 Information sought: the actual information needed - major
portion of the questionnaire
Questionnaire Design
 The following can have important implications on the survey
response.
 Question content
 Question wording
 Response form
 Question sequence
Questionnaire Design
1. Question Content
 Responses obtained in survey research are sensitive to the
types of questions asked.
 For each question in your survey, you should ask yourself
how well it addresses the content you are trying to get at.
 So you need to examine each question to see if you need
to ask it at all and,
 if you need to ask it at the level of detail you currently
have.
Questionnaire Design
 Question content usually depends on the respondent’s
 ability, and
 willingness to answer the question accurately.
a) Respondents’ ability: Do respondents have the needed
information?
 Check whether the respondent is likely to have the necessary
information to be able to answer the question.
 Questions that overtax the respondent’s recall ability
may not be appropriate.
Questionnaire Design
b) Willingness of respondent to answer
 Whether the respondent will have any difficulty answering the
question truthfully.
 Respondents may be unwilling to share it because:
 The situation is not appropriate for disclosing the
information – embarrassing or sensitive
 Disclosure of information is a potential threat to the
respondent
 They consider the topic to be irrelevant and
uninteresting
Questionnaire Design
 If there is some reason why they may not, consider rewording
the question to secure more complete and truthful information.
 For instance: some people are sensitive about answering
questions about their exact age or income.
 In this case, you might give them response brackets to
choose from (e.g., between 30 and 40 years old, between
$50,000 and $100,000 annual income).
Questionnaire Design
 Use indirect statements i.e., “other people”
 You might get reasonable estimates if you ask the
respondent how much money "people with similar
qualification" typically get.
 Apply appropriate questioning sequences that will lead a
respondent from „safe“ question gradually to those that are
more sensitive.
 Begin with non-threatening and interesting questions.
Questionnaire Design
 Provide incentives as a motivation.
 What does the respondent get for completing your
questionnaire?
 Altruism may not be an effective motivator.
 Attaching an incentive to the questionnaire works well. (of
course, you have to consider the ethical implications of
such a practice!).
Questionnaire Design
Different types of questions
 Types of questions depend on the research question.
 Attributes – characteristics of respondents (e.g., age, sex,
etc.)
 Behaviour – what people do
 Beliefs – what people believe
 Knowledge – what people know
 Attitudes – what is desirable
 How much – measurements
Questionnaire Design
 Questions should be
 Relevant (about issues respondents have knowledge of)
 reliable – same response by same individual and different
people should understand the question the same way
 discriminating – should capture sufficient variation
 increasing response rates – sensitive questions and poor
survey administration can reduce response rates
 Simple and short
Questionnaire Design
 BUT, Questions should not be
 Double-barrelled – don’t ask two questions in one.
 You can often spot these kinds of problems by looking
for the conjunction "and" in your question.
 Example: are you satisfied with the university and
its computer science department?
Questionnaire Design
 Avoid leading or biased questions– pushing people to answer in
a certain way
 For instance: If you ask a question like: What do you see as
the benefits of a tax cut?
 you're only asking about one side of the issue.
 You might get a very different picture if you also asked
about the disadvantages of tax cuts.
 Words like usually, often, sometimes, occasionally, seldom,
etc., are ambiguous.
Questionnaire Design
2. Question Wording: Using Shared Vocabulary
 Getting the wording right is also a major difficulty in writing
good survey questions.
 Even slight wording differences can confuse the respondent
or lead to incorrect interpretations of the question.
 In a survey the two parties must understand each other and
this is possible only if the vocabulary used is common to both
parties.
 So, don’t use uncommon words or abbreviations and make
items as brief as possible.
Questionnaire Design
 Don’t use emotionally loaded or vaguely defined words.
 For instance, if you ask a question about the "mass media,"
what do you mean? The newspapers? Radio? Television?
 Avoid technical and slang terms understood only by a small
subset of the population.
 Be specific in the use of terms and concepts (e.g. government:
national, regional, local)
Questionnaire Design
 Be specific when using a time period (“during last week”
instead of “recently”).
 Specify the time frame precisely.
 Make sure that facts within the question are accurate.
 Use correct grammar.
Questionnaire Design
3. Response structure or format -
 the degree of the structure imposed on the responses.
 Structured versus unstructured formats
 Structured Response Formats: The respondent chooses one
of several given responses.
 help the respondent to respond more easily and help the
researcher to accumulate and summarize responses more
efficiently.
 Preferable in large surveys.
Questionnaire Design
 They are more difficult to write than open questions because
the response choices must be known in advance.
 They produce standardized data that can easily be analyzed
statistically.
Questionnaire Design
 The response choices of categorical questions should be both
inclusive (or exhaustive):
 Inclusive: all possible answers should be listed in the
questionnaire;
 Exclusive: no respondent belongs to more than one
category.
 (except in the case of multiple response categorical
questions),
Questionnaire Design
Advantages
 Easier and quicker for respondents to answer
 Easier to compare the answers of different respondents
 Easier to code and statistically analyze
 reduce the variability of responses
 make fewer demands on interviewer skill, etc.
 don’t discriminate against the less talkative
Questionnaire Design
Limitations
 Can suggest ideas that the respondents would not
otherwise have
 too many choices can confuse respondents
Questionnaire Design
 Unstructured Response Formats- These are generally a
written texts.
 If the respondent (or interviewer) writes down text as the
response, you've got an unstructured response format.
 These can vary from short comment boxes to the transcript
of an interview.
Questionnaire Design
 Respondents can give any answer and there are no given
alternative responses.
 They may express themselves extensively in their own
everyday language
 Responses to open questions are often difficult to compare and
interpret.
Questionnaire Design
Advantage: Permit an unlimited number of answers
 Respondents can qualify and clarify responses
 Permit creativity, self expression, etc.
Limitations: responses may not be consistent.
 Some responses may be irrelevant
 Comparison and statistical analysis difficult.
 Articulate and highly literature respondents have an
advantage
 Requires greater amount of respondent time, thought and
effort.
Questionnaire Design
4) Question Sequence – the order of the questions
 This can also affect the response as well as the overall data
collection activity.
 Which topics should be introduced early in the survey,
and which later?
 If you leave your most important questions until the end,
your respondents may be too tired.
 If you introduce them too early, your respondents may not
yet be ready to address the topic, especially if it is a difficult
or disturbing one.
Questionnaire Design
 There are no easy answers to these problems - you have to
use your judgment.
The Opening Questions: Just as in other aspects of life, first
impressions are important in survey work.
 The first few questions you ask will determine the tone for
the survey, and can help put your respondent at ease.
 So, the opening few questions should, in general, be easy
to answer
Questionnaire Design
 The first questions in a questionnaire must maintain
respondent interest and make responding easy.
 They should be easy to understand and nonthreatening.
 You should never begin your survey with sensitive or
threatening questions.
 Once respondents have been drawn into the interview, complex
or difficult-to-answer questions may follow —
 Of course, before respondent fatigue becomes an issue.
Questionnaire Design
 Sensitive Questions: In much of our social research, we have
to ask respondents about difficult or uncomfortable subjects.
 Before asking such questions, you should attempt to
develop some trust with the respondent.
 A Checklist of Considerations: There are lots of conventions
or rules-of-thumb in the survey design business.
Questionnaire Design
 Here's a checklist of some of the most important items you can
use to review your instrument:
 Start with easy, nonthreatening questions put more
difficult, threatening questions near end
 Grouping questions that are similar will make the
questionnaire easier to complete, and the respondent will
feel more comfortable.
 Ask about one topic at a time
 When switching topics, use a transition
Questionnaire Design
 Questions that jump from one unrelated topic to another are
not likely to produce high response rates.
 Transitions between questions should be smooth.
 Each question should follow comfortably from the
previous question.
 present general questions before specific ones in order to
avoid response contamination.
 Reduce response set
Questionnaire Design
 The Golden Rule: Remember that you are imposing in the life
of your respondent.
 You are asking for their time, their attention, their trust,
and often, for personal information.
 Therefore, you should always keep in mind the "golden
rule" of survey research:
 Do unto your respondents as you would have them do
unto you!
Questionnaire Design
 Finally
 Thank the respondent at the beginning for allowing you
to conduct your study
 Be sensitive to the needs of the respondent
 Be alert for any sign that the respondent is uncomfortable
 Thank the respondent at the end for participating
Questionnaire Design
5) Physical Characteristics of a Questionnaire
 An improperly laid out questionnaire can lead respondents to
miss questions, can confuse them.
 So, take time to design a good layout
 ease to navigate within and between sections
 ease to use the questionnaire in the field; e.g., questions
on recto and codes on verso sides of the questionnaire
 leave sufficient space for open-ended questions
Questionnaire Design
 If you put more than one question on a line some respondents
might skip the second question.
 Abbreviating questions will result in misinterpretation of the
question.
Formats for Responses
 A variety of methods are available for presenting a series of
response categories.
 Boxes
 Blank spaces
Questionnaire Design
Providing Instructions
 Every questionnaire whether self administered or
administered by an interviewer should contain clear
instructions.
 General instructions: basic instructions to be followed in
completing it.
 Introduction: If a questionnaire is arranged into subsections it
is useful to introduce each section with a short statement
concerning its content and purpose.
Questionnaire Design
 Specific Instructions: Some questions may require special
instructions.
 Interviewers instruction: It is important to provide clear
complementary instruction where appropriate to the
interviewer.
Questionnaire Design
6) Reproducing the questionnaire - Nowadays less important
 A neatly reproduced instrument will encourage a higher
response rate, thereby providing better data.
 Pilot Survey: The final test of a questionnaire is to try it
on representatives of the target audience.
 Measurement levels (in decreasing order of precision)
1. A ratio variable is measured on a mathematical scale with
equal intervals and a fixed zero point
 Eg Journey time from London to Brussels was 2 hours in 2006, but
1½ hours in 2009 (so 25% faster)
2. An interval variable is measured on a mathematical scale
with equal intervals and an arbitrary zero point
 Eg It was 5o
C yesterday, but 10o
C today (so it was warmer by 5o
C,
but not twice as warm because 0o
C does not mean there is no
temperature)
 As they are measured on a mathematical scale, ratio and
interval variables are quantitative variables
95
Types of Measurement Scales
3. An ordinal variable uses numerical codes to identify the order or rank
of each category
 Eg Order of preference (1st
, 2nd
, 3rd
)
 Rating scales (eg where 5 = strongly agree, 4 = agree, 3 =
neutral, 2 = disagree and 1 = strongly disagree) can be treated as
ordinal or interval variables
4. A nominal variable uses numerical codes to identify named categories
 Eg Geographical location where 1 = England, 2 = Wales, 3 =
Scotland, 4 = Northern Ireland
 As they are not measured on a mathematical scale, ordinal and
nominal variables are categorical variables
96
Types of Measurement Scales
 We can summarize our description of the four scales this way: If you
can say that:
 One object is different from another, you have a nominal scale;
 One object is bigger or better or more of anything than another, you have an
ordinal scale;
 One object is so many units (degrees, inches) more than another, you have an
interval scale;
 One object is so many times as big or bright or tall or heavy as another, you have a
ratio scale.
Types of Measurement Scales
 Other distinctions
 A quantitative variable (ie all ratio and interval
variables) can be
 A continuous variable where the data can take any value
within a given range (eg time = 7 or 7½ hours)
 Or a discrete variable where the data can take only one of a
range of distinct values (eg Employees = 7 but not 7½)
 A dichotomous variable has two groups and can be
 A categorical dichotomous variable with two categories (eg
gender might be coded 1 if female and 0 if not)
 Or a quantitative dichotomous variable known as a dummy
variable (coded 1 if characteristic is present and 0 if not)
98
Types of Measurement Scales
 The measurement level of the variable determines which
descriptive statistics are appropriates
 Your choice depends on your research questions, which
may also require the use of inferential statistics
Exploratory analysis Descriptive statistics Measurement level
Frequency distribution Percentage frequency Ratio, interval, ordinal, nominal
Measures of central
tendency
Mean
Median
Mode
Ratio, interval
Ratio, interval, ordinal
Ratio, interval, ordinal, nominal
Measures of dispersion Range
Standard deviation
Ratio, interval
Ratio, interval
Measures of normality Skewness
Kurtosis
Ratio, interval
Ratio, interval
99
Types of Measurement Scales
Exercise 1
Classifying variables (more than one answer may apply)
 A ratio variable can be
 Categorical / Continuous / Discrete / Interval / Quantitative
 A categorical variable can be
 Continuous / Dichotomous / Discrete / Interval / Nominal
 A dummy variable can be
 Categorical / Continuous / Dichotomous / Quantitative
 A quantitative variable can be
 Categorical / Continuous / Discrete / Interval / Ratio
 A dichotomous variable can be
 Categorical / Continuous / Dummy / Interval / Quantitative
101
Solution 1
Classifying variables
1. A ratio variable can be
 Categorical/ Continuous/ Discrete/ Interval/ Quantitative
2. A categorical variable can be
 Continuous/ Dichotomous/ Discrete/ Interval/ Nominal
3. A dummy variable can be
 Categorical/ Continuous/ Dichotomous/ Quantitative
4. A quantitative variable can be
 Categorical/ Continuous/ Discrete/ Interval/ Ratio
5. A dichotomous variable can be
 Categorical/ Continuous/ Dummy/ Interval/ Quantitative
102
Exercise 2
1. An environmental scientist collects water samples from streams and
rivers near large industrial plants and saves exactly 1 liter of water
from each sample. Then, back at the lab, the researcher determines the
amounts of certain health-jeopardizing bacteria in each sample. What
measurement scale does the measurement of bacteria content reflect?
2. A market researcher is studying the relationship between (a) a
country’s average annual relative humidity levels and (b) the number
of raincoats sold in the country during the year. What scales underlie
the two variables in this study?
Exercise 2
3. A sports journalist in Spain wants to determine whether a football
club’s fan club membership correlates to the frequency with which
the club has won in the Spanish football league during the past five
years. The researcher can easily obtain information about fan club
membership and wins from the club’s records. To simplify data
collection, the researcher uses the following coding scheme for the fan
club membership: 1 = FC Barcelona, 2 = Real Madrid, and 3 = Atletico
de Madrid. What measurement scale(s) underlie (a) fan club
membership and (b) frequency of wins?
Exercise 2
4. A new audio system was installed in a theatre that has a seating
capacity of 500 people. The seating area has been divided into three
distinct areas: platinum, gold, and silver. At the end of every show in
one week, the audience was asked to fill out a questionnaire to
determine the effectiveness of the new audio system. What
measurement scale does the researcher’s coding scheme for the
seating area represent?
Exercise 2
5. An advertiser is studying the impact of a chocolate commercial on
different age groups. He puts the age groups in four categories: Group 1
includes 3- to 12-year-olds, Group 2 includes teenagers aged 13 to 19, Group
3 includes adults aged 20 to 49, and Group 4 includes people aged 50 and
above. What kind of scale is the classification of age groups in this study?
6. A car manufacturer is studying sales patterns over five years of four
different types of car that vary in size and available utilities: hatchbacks
(small cars with no trunk space), midsized sedans (cars with limited
trunk space and more utilities compared to hatchbacks), sedans (proper
trunk space and all utilities), and luxury sedans (big trunk space and
luxurious interiors). Based on size and available utilities, which
measurement scale does the type of car reflect?
Exercise 2
7. A child psychologist is developing an instrument designed to measure
the social etiquette of small children. The instrument includes 25
statements; for example, “wishes elders when they meet them,”
“courteous to their sibling,” and “says please when asking for
something or thank you when someone has helped.” Parents must rate
each of these statements on a 5-point scale as follows:
0 never; 1 rarely; 2 sometimes; 3 often; 4 always
Parents who answer “never” to each of the 25 questions get the lowest
possible score of 0 on the instrument. Parents who answer “always” to
each of the 25 questions get the highest possible score of 100 on the
instrument. Thus, scores on the instrument range
from 0 to 100. What kind of scale do the scores represent?

Research Methods - Cha accounting third year5.ppt

  • 1.
    ACFN 3111- Research Methodsin Accounting & Finance Chapter V The Sources and Collection of Data
  • 2.
    Content of theLecture Content of the Lecture 1. Introduction 2. Data Collection methods  Types and sources of Data  Methods of primary Data collection  Methods of secondary Data collection 3. Data management issues 4. Sources and Techniques of Data Collection 5. Questionnaire Design
  • 3.
    Introduction  Data arethe foundations of research.  The quality of any investigation heavily depends on the quality of information or data used.  So, proper data collection, retention, and sharing are vital to the research enterprise.  What is Data?  Data refers to any group of facts, measurements, or observations used to make inference about the problem of investigation.
  • 4.
    Introduction  It canrange from material created in a laboratory, to information obtained in economic research, such as a filled- out questionnaire, video and audio recordings, or photographs, etc.  We need to design strategies that would enable us to create meaningful and unbiased data,  that will not waste resources, and  that will appropriately protect human and animal subjects.
  • 5.
    Introduction  When selectingdata we need to be clear on:  The data type (e.g., nominal, ordinal, interval or ratio measures).  Samples ("frames") and sample size, instruments.  Methodologies for collecting data, etc.  And, to ensure high quality output, data gathering should be well planned.
  • 6.
    Introduction  Hence, weneed to plan and define properly:  The objective of the data collection exercise  The kind of data (information) to be collected  The source of the data  The methods to be used to collect data  This helps us to determine the statistical techniques to be employed.  It also helps us to avoid gathering of irrelevant information.
  • 7.
    Data Collection Methods Data collection is the process of gathering and measuring information on the variables of interest.  The data source could be:  an area from where we can collect the data (i.e. geographic location),  persons to be interviewed,  An entity or organization,  discussions to be observed, etc.).
  • 8.
    Data Collection Methods Although data collection methods may vary by discipline and data types, the emphasis on ensuring accurate collection remains the same.  Some of the consequences from improperly collected data may include:  Inability to repeat and validate the study.  Distorted and inaccurate findings.  Wasted resources.  Misleading other researchers.  Harm to human participants and animal subjects.
  • 9.
    Data Collection Methods More importantly, poor data collection may cause harm to society when the results of the flawed research are used to support public policy recommendations.
  • 10.
    Data management issues Storage and Protection  Data must be stored securely both during a research project and after it ends.  Risks like fire, water or other environmental damage, or common technical failures like hard disk crashes, must be considered.  So, make backup copies of the data periodically and store the copies in a secure location.
  • 11.
    Data management issues Confidentiality  refers to limiting information access and disclosure to authorized users- preventing access by or disclosures to unauthorized persons.  So you need to decide  who can handle which portion of data,  at what point during the project,  for what purpose, and so on
  • 12.
    Data management issues Integrity  Integrity refers to the trustworthiness of the information.  Researchers need to have sufficient skills to ensure the integrity of their data collection efforts.  For instance, data collection requires a rigorous and detailed recruitment and training plan for data collectors.  So, data should not be modified inappropriately, whether accidentally or deliberately.
  • 13.
    Sources and Techniquesof Data collection  Sources of data can be grouped into primary and secondary sources of data Secondary Sources of data  Secondary sources are those, which have been collected by other individuals or agencies.  i.e. refers to already existing information which have previously been collected and reported by some individual or organization for their own purposes.
  • 14.
    Sources and Techniquesof Data collection  As much as possible secondary data should always be considered first, if available.  WHY REINVENT THE WHEEL IF THE DATA ALREADY EXISTS!
  • 15.
    Sources and Techniquesof Data Collection  But, when dealing with secondary data you should ask:  Is the owner of the data making them available to you?  Is it free of charge? If not, how will you pay?  Are the data in a format that you can work with? etc.  A description of the sampling technique, i.e., how the sample was collected is also necessary, etc.
  • 16.
    Sources and Techniquesof Data Collection Sources of Secondary Data  Secondary data may be acquired from various sources:  Documents (reports of various kinds, books, periodicals, reference books (encyclopedia), university publications (thesis, dissertations, etc.), policy documents, statistical compilations, proceedings, personal documents (historical documents, Data archives, etc.  The Internet
  • 17.
    Sources and Techniquesof Data Collection Advantages of Secondary data  Can be found more quickly and cheaply.  Most researches on past events or distant places have to rely on secondary data sources. Limitations  Authenticity:  genuine?  credible?  representative?
  • 18.
    Sources and techniquesof Data Collection  Completeness???  The information often does not meet one’s specific needs.  Definitions might differ, units of measurements may be different and different time periods may be involved.  Data could also be out of date.
  • 19.
    Sources and Techniquesof Data Collection Primary Sources of Data  These are data collected by the investigator (immediate user) for the 1st time.  Two approaches to primary data collection:  the qualitative approach and  the quantitative approach
  • 20.
    Sources and techniquesof Data Collection Qualitative data collection approaches  Qualitative data can be acquired from:  case studies,  Participant Observation  Rapid appraisal methods,  focus group discussions and  key informant interviews, etc. i) Case studies: involves a detailed investigation of a particular case.
  • 21.
    Sources and techniquesof Data Collection  (ii) Participant Observation: this is when a researcher attempts to observe in some way.  It can be a good way of getting below the surface information and help to reveal complex social processes.  The researcher can play an overt or covert role.  Example: the observation of consumer behaviour in supermarkets.
  • 22.
    Sources and Techniquesof Data Collection iii) Participatory Rapid Appraisal (PRA)  PRA is a systematic expert observation usually by a multidisciplinary team.  The PRA method:  takes only a short time to complete,  tends to be relatively cheap, and  make use of more 'informal' data collection procedures.
  • 23.
    Sources and Techniquesof Data Collection iv) Focus group discussions  A FGD is a group discussion guided by a facilitator, during which group members talk freely.  The researcher creates a relaxed atmosphere and records in some way what is being said (e.g. by use of a tape-recorder, video, note-taker, etc.).
  • 24.
    Sources and Techniquesof Data Collection  Mostly used to gather opinions, from a selected group of people on a particular and pre-determined topic, e.g. consumer topic; political topic etc.  About 10 people would be engaged in a discussion on the topic in an informal setting.  The researcher encourages free discussion, but is ready to intervene if necessary to resolve group problems.  The group of individuals are expected to have experience or opinion on the topic.
  • 25.
    Sources and Techniquesof Data Collection  Its purpose is to obtain in-depth information on concepts, perceptions and ideas of a group.  Focus groups can be a useful way of finding out what the main issues and concerns of any group are.  It is more than a question-answer interaction.  group members discuss the topic and interact among themselves with guidance from the facilitator.
  • 26.
    Sources and Techniquesof Data Collection Why use focus groups?  The main purpose of a focus group research is to draw upon group’s attitudes, feelings, beliefs, experiences and reactions.  attitudes, feelings and beliefs may likely be revealed via interaction in social gatherings.  Compared to individual interviews, which aim to obtain individual attitudes, beliefs and feelings, focus groups elicit a multiplicity of views.
  • 27.
    Sources and Techniquesof Data Collection Strengths and weakness of FGDs  It provides valuable information in a short period of time and at relatively low cost if the groups have been well chosen, in terms of composition and number.  But, their use as a research tool is limited when it comes to measuring the results objectively.
  • 28.
    Sources and Techniquesof Data Collection  FGD should not be used for quantitative purposes, such as the testing of hypotheses or the generalization of findings for larger areas  Which require more elaborate surveys.  In addition, the logistical complexity of focus group research is frequently cited as a deterrent.
  • 29.
    Sources and Techniquesof Data Collection  In addition, it may be risky to use FGDs as a single tool because in:  group discussions, people tend to center their opinions on the most common ones.  In case of very sensitive topics group members may hesitate to express their feelings and experiences freely.  Therefore, it is advisable to combine FGDs with other methods (in-depth interviews).
  • 30.
    Sources and Techniquesof Data Collection v) Key Informant Interview  An interviewing process with opinion leaders such as elected officials, government officials, and business leaders, etc.  This technique is particularly useful for:  Raising community awareness about socio-economic issues  Learning minority viewpoints  Gaining a deeper understanding of opinions and perceptions, etc.
  • 31.
    Sources and Techniquesof Data Collection v) Triangulation  refers to the use of more than one approach to the investigation of a research question in order to enhance confidence in the findings.  Why use triangulation  The purpose of triangulation is to obtain confirmation of findings through convergence of different perspectives.  By combining multiple methods, and empirical materials, researchers can overcome the weakness or biases and problems that are associated with a single method.
  • 32.
    Sources and Techniquesof Data collection Taxonomy of triangulation 1. Data triangulation: Involves gathering data at different times and situations, from different subjects using different sampling techniques.  Example: Using time series data. 2. Investigator triangulation: involves using more than one researcher to collect and analyze the data.  Example: organizing scientific experiments to replicate each other’s work.
  • 33.
    Sources and Techniquesof Data Collection 3. Theoretical triangulation: making explicit references to more than one theoretical tradition to analyze data. 4. Methodological triangulation: combination of different research methods or different varieties of the same method.  Within method triangulation involves making use of different varieties of the same method.  Example: making use of alternative econometric estimators  Between method triangulation involves making use of different methods.  Example: Using ‘quantitative’ and ‘qualitative’ methods.
  • 34.
    Sources and Techniquesof Data Collection Quantitative Primary Data Collection Methods  This method involves the collection of quantified data that can be subjected to statistical treatment.  Primary data may be collected through:  Direct personal observation method, or  Survey or questioning other persons,  From a literature search, or  by combining them.
  • 35.
    Sources and Techniquesof Data Collection The Observation Method  Observation includes all kinds of monitoring behavioral and non-behavioral activities.  The investigator will make the observation personally by being guided by some outlined questions.  i.e. the investigator does not make inquiries but notes down the observation himself/herself  (e.g. evaluation of the class room teaching-learning process by investigators).
  • 36.
    Sources and Techniquesof Data Collection  Advantages  It is less demanding and has less bias.  One can collect data at the time it occurs and need not depend on reports by others.  with this method one can capture the whole event as it occurs.
  • 37.
    Sources and techniquesof Data Collection Weakness of the Method  The observer normally must be at the scene of the event when it takes place.  But it is often difficult or impossible to predict when and where an event might occur.  It is also a slow and expensive process.  Its most reliable results are restricted to data that can be determined by an open or surface indicator.  Difficult to learn about past events and to gather information on intensions, attitudes, opinions and preferences.
  • 38.
    Sources and Techniquesof Data Collection The Survey Method: the most commonly used method in economics.  To survey is to ask people questions in a questionnaire.  In a survey, a trained interviewer asks the questions and records responses on a specially designed form.  The form contains all the questions which would extract information from a respondent.
  • 39.
    Sources and Techniquesof Data Collection Strength of the Survey Method  It is a versatile or flexible method - capable of many different uses.  More efficient and economical than observations -surveying using telephone or mail is less expensive.  If planned correctly, a survey makes it easy for people to participate.  Same questions can be asked in several ways to double-check for accuracy and consistency.
  • 40.
    Sources and Techniquesof Data Collection Weakness of the Method  The quality of information depends heavily on the ability and willingness of the respondents.  A respondent may interpret questions or concept differently from what was intended by the researcher.  A respondent may deliberately mislead the researcher by giving false information.
  • 41.
    Sources and Techniquesof Data Collection  People surveyed may not answer all questions.  Low response rate is common.  People can and do lie.  Can’t test knowledge with mailed surveys.
  • 42.
    Main modes ofadministration of a survey Main modes of administration of a survey
  • 43.
    Sources and Techniquesof Data Collection  Surveys could be carried out through:  face to face personal interview  telephone interview  mail or e-mail, or by a combination.  a) Personal Face to face Interview  It is a two-way conversion where one person interviews another person.  interviewers ask the questions and mark the answers, either on paper or by typing them onto a computer.
  • 44.
    Sources and Techniquesof Data Collection  Advantages of face to face Interview:  enhances respondent participation,  guiding the questioning process,  answering the respondent’s questions,  clarifying the meaning of questions and responses,  probing, clarifying and motivating the respondent to complete the questionnaire,  making sure that the questionnaire is answered in the pre- defined sequence and by the respondent himself or herself.  In addition, visual aids are possible in face-to-face interviews but not in telephone surveys.
  • 45.
    Sources and Techniquesof Data Collection  The depth and detail of the information that can be secured far exceeds the information secured from telephone or mail surveys.  Interviewers can probe additional questions, gather supplemental information.  Interviewers can make adjustments to the language of the interview because they can observe the problems and effects with which the interviewer is faced.
  • 46.
    Sources and Techniquesof Data Collection Limitations of the Method  The method is an expensive enterprise – (e.g., locating respondents) – US$50-80.  Hence, personal interviews are generally used only when subjects are not likely to respond to other methods.  susceptible to interviewers’ bias/mistakes  Interviewer may also be reluctant to visit unfamiliar places.
  • 47.
    Sources and Techniquesof Data Collection b) Telephone Interview  Telephone can be a helpful medium of communication in setting up interviews.  telephone numbers are picked, using some sampling technique, from a telephone directory.  Then the survey will be administered by calling and interviewing those who are selected in the sample via telephone.  Telephone surveys are the fastest method of gathering information from a relatively large sample - generally last less than ten minutes.
  • 48.
    Sources and Techniquesof Data Collection Strengths of this method  Moderate travel and administrative costs  Faster completion of study  Responses can be directly entered on to the computer  Speed of administration; no geographic limitations; etc.
  • 49.
    Sources and Techniquesof Data Collection Limitations of this method  Respondents must be available by phone.  The length of the interview period is short.  limited in length and scope.  those interviewed by phone find the experience to be less rewarding than a personal interview.
  • 50.
    Sources and Techniquesof Data Collection C) Interviewing by mail (Solicited responses)  Self-administrated questionnaires may be used in surveys.  Questionnaires will be sent to respondents through their email or postal address.  Respondents are expected to fill out the questionnaires and send them back the same way.  Self-administered surveys do not need interviewers.  Respondents mark, write or type the answers themselves.
  • 51.
    Sources and Techniquesof Data Collection  They are ideal for large sample sizes, or when the sample comes from a wide geographic area.  Questionnaires must be easily understandable since there is no possibility for respondents to ask how to mark answers or what a question might mean. Advantages  Lower cost than personal interview  Persons who might otherwise be inaccessible can be contacted (major corporate executives)  Less interviewer bias  better protects privacy/anonymity
  • 52.
    Sources and Techniquesof Data Collection Disadvantages  Non response error is high  Large amount of information may not be acquired  Literacy of the respondents is necessary, and the language of the respondents must be known in advance.  We have no control who responds or whom the respondent consults.  We have no control for the bias originating from the self- selection process (respondents choose freely whether they respond or not).
  • 53.
    Sources and Techniquesof Data Collection d) Online Surveys (E-mail / Internet)  Internet surveys allow researchers to reach a large sample more quickly.  Sample size requirements can be met easily.  Internet surveys are relatively new and little is known about the effect of sampling bias in internet surveys. Advantages:  Very inexpensive -saves inputting costs as well  Respondents feel privacy
  • 54.
    Sources and Techniquesof Data Collection Disadvantages:  A sample of Internet users is representative only of Internet users, who tend to be younger, better educated, and more affluent than the general population.  Very biased toward wealthy and the young.  The demographic profile of the internet user does not always represent the general population.  Therefore, before doing an e-mail or internet survey, carefully consider the effect that this bias might have on the results.
  • 55.
    Questionnaire Design  Theinstrument design begins by drafting specific measurement questions in the form of a questionnaire.  A questionnaire is a research instrument consisting of a set of questions intended to capture responses from respondents.  Questionnaires consist of questions.  A well formed questionnaire is key to good research
  • 56.
    Questionnaire Design  Theconstruction of a questionnaire requires a marriage of art and science to achieve two primary goals:  address the survey objectives,  smooth conversational flow.  But, why use questionnaires?
  • 57.
    Questionnaire Design  Questionnairesare easy to analyze.  Data entry and tabulation can be easily done with many computer software packages.  Questionnaires are familiar to most people.  Nearly everyone has had some experience completing questionnaires and they generally do not make people apprehensive.  Questionnaires reduce bias.  There is uniform question presentation.
  • 58.
    Questionnaire Design  Questionsmay be unstructured (respondents provide a response in their own words) or structured (respondents select an answer from a given set of choices).  Structured questionnaires can be designed as:  Dichotomous: having only two alternative responses E.g. are you married? Yes No  Multiple choice: having numerous alternative responses  E.g. what is your marital status?  Married Single  Widowed Divorced
  • 59.
    Questionnaire Design The mainComponents of a questionnaire  Identification data: respondent’s name, address, time and date of interview, code of interviewer, etc.  Covering letter: brief purpose of the survey, who is doing it, time involved, ethical statements, etc.  Instruction: clear and concise instructions on how to complete the questionnaire.  Information sought: the actual information needed - major portion of the questionnaire
  • 60.
    Questionnaire Design  Thefollowing can have important implications on the survey response.  Question content  Question wording  Response form  Question sequence
  • 61.
    Questionnaire Design 1. QuestionContent  Responses obtained in survey research are sensitive to the types of questions asked.  For each question in your survey, you should ask yourself how well it addresses the content you are trying to get at.  So you need to examine each question to see if you need to ask it at all and,  if you need to ask it at the level of detail you currently have.
  • 62.
    Questionnaire Design  Questioncontent usually depends on the respondent’s  ability, and  willingness to answer the question accurately. a) Respondents’ ability: Do respondents have the needed information?  Check whether the respondent is likely to have the necessary information to be able to answer the question.  Questions that overtax the respondent’s recall ability may not be appropriate.
  • 63.
    Questionnaire Design b) Willingnessof respondent to answer  Whether the respondent will have any difficulty answering the question truthfully.  Respondents may be unwilling to share it because:  The situation is not appropriate for disclosing the information – embarrassing or sensitive  Disclosure of information is a potential threat to the respondent  They consider the topic to be irrelevant and uninteresting
  • 64.
    Questionnaire Design  Ifthere is some reason why they may not, consider rewording the question to secure more complete and truthful information.  For instance: some people are sensitive about answering questions about their exact age or income.  In this case, you might give them response brackets to choose from (e.g., between 30 and 40 years old, between $50,000 and $100,000 annual income).
  • 65.
    Questionnaire Design  Useindirect statements i.e., “other people”  You might get reasonable estimates if you ask the respondent how much money "people with similar qualification" typically get.  Apply appropriate questioning sequences that will lead a respondent from „safe“ question gradually to those that are more sensitive.  Begin with non-threatening and interesting questions.
  • 66.
    Questionnaire Design  Provideincentives as a motivation.  What does the respondent get for completing your questionnaire?  Altruism may not be an effective motivator.  Attaching an incentive to the questionnaire works well. (of course, you have to consider the ethical implications of such a practice!).
  • 67.
    Questionnaire Design Different typesof questions  Types of questions depend on the research question.  Attributes – characteristics of respondents (e.g., age, sex, etc.)  Behaviour – what people do  Beliefs – what people believe  Knowledge – what people know  Attitudes – what is desirable  How much – measurements
  • 68.
    Questionnaire Design  Questionsshould be  Relevant (about issues respondents have knowledge of)  reliable – same response by same individual and different people should understand the question the same way  discriminating – should capture sufficient variation  increasing response rates – sensitive questions and poor survey administration can reduce response rates  Simple and short
  • 69.
    Questionnaire Design  BUT,Questions should not be  Double-barrelled – don’t ask two questions in one.  You can often spot these kinds of problems by looking for the conjunction "and" in your question.  Example: are you satisfied with the university and its computer science department?
  • 70.
    Questionnaire Design  Avoidleading or biased questions– pushing people to answer in a certain way  For instance: If you ask a question like: What do you see as the benefits of a tax cut?  you're only asking about one side of the issue.  You might get a very different picture if you also asked about the disadvantages of tax cuts.  Words like usually, often, sometimes, occasionally, seldom, etc., are ambiguous.
  • 71.
    Questionnaire Design 2. QuestionWording: Using Shared Vocabulary  Getting the wording right is also a major difficulty in writing good survey questions.  Even slight wording differences can confuse the respondent or lead to incorrect interpretations of the question.  In a survey the two parties must understand each other and this is possible only if the vocabulary used is common to both parties.  So, don’t use uncommon words or abbreviations and make items as brief as possible.
  • 72.
    Questionnaire Design  Don’tuse emotionally loaded or vaguely defined words.  For instance, if you ask a question about the "mass media," what do you mean? The newspapers? Radio? Television?  Avoid technical and slang terms understood only by a small subset of the population.  Be specific in the use of terms and concepts (e.g. government: national, regional, local)
  • 73.
    Questionnaire Design  Bespecific when using a time period (“during last week” instead of “recently”).  Specify the time frame precisely.  Make sure that facts within the question are accurate.  Use correct grammar.
  • 74.
    Questionnaire Design 3. Responsestructure or format -  the degree of the structure imposed on the responses.  Structured versus unstructured formats  Structured Response Formats: The respondent chooses one of several given responses.  help the respondent to respond more easily and help the researcher to accumulate and summarize responses more efficiently.  Preferable in large surveys.
  • 75.
    Questionnaire Design  Theyare more difficult to write than open questions because the response choices must be known in advance.  They produce standardized data that can easily be analyzed statistically.
  • 76.
    Questionnaire Design  Theresponse choices of categorical questions should be both inclusive (or exhaustive):  Inclusive: all possible answers should be listed in the questionnaire;  Exclusive: no respondent belongs to more than one category.  (except in the case of multiple response categorical questions),
  • 77.
    Questionnaire Design Advantages  Easierand quicker for respondents to answer  Easier to compare the answers of different respondents  Easier to code and statistically analyze  reduce the variability of responses  make fewer demands on interviewer skill, etc.  don’t discriminate against the less talkative
  • 78.
    Questionnaire Design Limitations  Cansuggest ideas that the respondents would not otherwise have  too many choices can confuse respondents
  • 79.
    Questionnaire Design  UnstructuredResponse Formats- These are generally a written texts.  If the respondent (or interviewer) writes down text as the response, you've got an unstructured response format.  These can vary from short comment boxes to the transcript of an interview.
  • 80.
    Questionnaire Design  Respondentscan give any answer and there are no given alternative responses.  They may express themselves extensively in their own everyday language  Responses to open questions are often difficult to compare and interpret.
  • 81.
    Questionnaire Design Advantage: Permitan unlimited number of answers  Respondents can qualify and clarify responses  Permit creativity, self expression, etc. Limitations: responses may not be consistent.  Some responses may be irrelevant  Comparison and statistical analysis difficult.  Articulate and highly literature respondents have an advantage  Requires greater amount of respondent time, thought and effort.
  • 82.
    Questionnaire Design 4) QuestionSequence – the order of the questions  This can also affect the response as well as the overall data collection activity.  Which topics should be introduced early in the survey, and which later?  If you leave your most important questions until the end, your respondents may be too tired.  If you introduce them too early, your respondents may not yet be ready to address the topic, especially if it is a difficult or disturbing one.
  • 83.
    Questionnaire Design  Thereare no easy answers to these problems - you have to use your judgment. The Opening Questions: Just as in other aspects of life, first impressions are important in survey work.  The first few questions you ask will determine the tone for the survey, and can help put your respondent at ease.  So, the opening few questions should, in general, be easy to answer
  • 84.
    Questionnaire Design  Thefirst questions in a questionnaire must maintain respondent interest and make responding easy.  They should be easy to understand and nonthreatening.  You should never begin your survey with sensitive or threatening questions.  Once respondents have been drawn into the interview, complex or difficult-to-answer questions may follow —  Of course, before respondent fatigue becomes an issue.
  • 85.
    Questionnaire Design  SensitiveQuestions: In much of our social research, we have to ask respondents about difficult or uncomfortable subjects.  Before asking such questions, you should attempt to develop some trust with the respondent.  A Checklist of Considerations: There are lots of conventions or rules-of-thumb in the survey design business.
  • 86.
    Questionnaire Design  Here'sa checklist of some of the most important items you can use to review your instrument:  Start with easy, nonthreatening questions put more difficult, threatening questions near end  Grouping questions that are similar will make the questionnaire easier to complete, and the respondent will feel more comfortable.  Ask about one topic at a time  When switching topics, use a transition
  • 87.
    Questionnaire Design  Questionsthat jump from one unrelated topic to another are not likely to produce high response rates.  Transitions between questions should be smooth.  Each question should follow comfortably from the previous question.  present general questions before specific ones in order to avoid response contamination.  Reduce response set
  • 88.
    Questionnaire Design  TheGolden Rule: Remember that you are imposing in the life of your respondent.  You are asking for their time, their attention, their trust, and often, for personal information.  Therefore, you should always keep in mind the "golden rule" of survey research:  Do unto your respondents as you would have them do unto you!
  • 89.
    Questionnaire Design  Finally Thank the respondent at the beginning for allowing you to conduct your study  Be sensitive to the needs of the respondent  Be alert for any sign that the respondent is uncomfortable  Thank the respondent at the end for participating
  • 90.
    Questionnaire Design 5) PhysicalCharacteristics of a Questionnaire  An improperly laid out questionnaire can lead respondents to miss questions, can confuse them.  So, take time to design a good layout  ease to navigate within and between sections  ease to use the questionnaire in the field; e.g., questions on recto and codes on verso sides of the questionnaire  leave sufficient space for open-ended questions
  • 91.
    Questionnaire Design  Ifyou put more than one question on a line some respondents might skip the second question.  Abbreviating questions will result in misinterpretation of the question. Formats for Responses  A variety of methods are available for presenting a series of response categories.  Boxes  Blank spaces
  • 92.
    Questionnaire Design Providing Instructions Every questionnaire whether self administered or administered by an interviewer should contain clear instructions.  General instructions: basic instructions to be followed in completing it.  Introduction: If a questionnaire is arranged into subsections it is useful to introduce each section with a short statement concerning its content and purpose.
  • 93.
    Questionnaire Design  SpecificInstructions: Some questions may require special instructions.  Interviewers instruction: It is important to provide clear complementary instruction where appropriate to the interviewer.
  • 94.
    Questionnaire Design 6) Reproducingthe questionnaire - Nowadays less important  A neatly reproduced instrument will encourage a higher response rate, thereby providing better data.  Pilot Survey: The final test of a questionnaire is to try it on representatives of the target audience.
  • 95.
     Measurement levels(in decreasing order of precision) 1. A ratio variable is measured on a mathematical scale with equal intervals and a fixed zero point  Eg Journey time from London to Brussels was 2 hours in 2006, but 1½ hours in 2009 (so 25% faster) 2. An interval variable is measured on a mathematical scale with equal intervals and an arbitrary zero point  Eg It was 5o C yesterday, but 10o C today (so it was warmer by 5o C, but not twice as warm because 0o C does not mean there is no temperature)  As they are measured on a mathematical scale, ratio and interval variables are quantitative variables 95 Types of Measurement Scales
  • 96.
    3. An ordinalvariable uses numerical codes to identify the order or rank of each category  Eg Order of preference (1st , 2nd , 3rd )  Rating scales (eg where 5 = strongly agree, 4 = agree, 3 = neutral, 2 = disagree and 1 = strongly disagree) can be treated as ordinal or interval variables 4. A nominal variable uses numerical codes to identify named categories  Eg Geographical location where 1 = England, 2 = Wales, 3 = Scotland, 4 = Northern Ireland  As they are not measured on a mathematical scale, ordinal and nominal variables are categorical variables 96 Types of Measurement Scales
  • 97.
     We cansummarize our description of the four scales this way: If you can say that:  One object is different from another, you have a nominal scale;  One object is bigger or better or more of anything than another, you have an ordinal scale;  One object is so many units (degrees, inches) more than another, you have an interval scale;  One object is so many times as big or bright or tall or heavy as another, you have a ratio scale. Types of Measurement Scales
  • 98.
     Other distinctions A quantitative variable (ie all ratio and interval variables) can be  A continuous variable where the data can take any value within a given range (eg time = 7 or 7½ hours)  Or a discrete variable where the data can take only one of a range of distinct values (eg Employees = 7 but not 7½)  A dichotomous variable has two groups and can be  A categorical dichotomous variable with two categories (eg gender might be coded 1 if female and 0 if not)  Or a quantitative dichotomous variable known as a dummy variable (coded 1 if characteristic is present and 0 if not) 98 Types of Measurement Scales
  • 99.
     The measurementlevel of the variable determines which descriptive statistics are appropriates  Your choice depends on your research questions, which may also require the use of inferential statistics Exploratory analysis Descriptive statistics Measurement level Frequency distribution Percentage frequency Ratio, interval, ordinal, nominal Measures of central tendency Mean Median Mode Ratio, interval Ratio, interval, ordinal Ratio, interval, ordinal, nominal Measures of dispersion Range Standard deviation Ratio, interval Ratio, interval Measures of normality Skewness Kurtosis Ratio, interval Ratio, interval 99 Types of Measurement Scales
  • 100.
  • 101.
    Exercise 1 Classifying variables(more than one answer may apply)  A ratio variable can be  Categorical / Continuous / Discrete / Interval / Quantitative  A categorical variable can be  Continuous / Dichotomous / Discrete / Interval / Nominal  A dummy variable can be  Categorical / Continuous / Dichotomous / Quantitative  A quantitative variable can be  Categorical / Continuous / Discrete / Interval / Ratio  A dichotomous variable can be  Categorical / Continuous / Dummy / Interval / Quantitative 101
  • 102.
    Solution 1 Classifying variables 1.A ratio variable can be  Categorical/ Continuous/ Discrete/ Interval/ Quantitative 2. A categorical variable can be  Continuous/ Dichotomous/ Discrete/ Interval/ Nominal 3. A dummy variable can be  Categorical/ Continuous/ Dichotomous/ Quantitative 4. A quantitative variable can be  Categorical/ Continuous/ Discrete/ Interval/ Ratio 5. A dichotomous variable can be  Categorical/ Continuous/ Dummy/ Interval/ Quantitative 102
  • 103.
    Exercise 2 1. Anenvironmental scientist collects water samples from streams and rivers near large industrial plants and saves exactly 1 liter of water from each sample. Then, back at the lab, the researcher determines the amounts of certain health-jeopardizing bacteria in each sample. What measurement scale does the measurement of bacteria content reflect? 2. A market researcher is studying the relationship between (a) a country’s average annual relative humidity levels and (b) the number of raincoats sold in the country during the year. What scales underlie the two variables in this study?
  • 104.
    Exercise 2 3. Asports journalist in Spain wants to determine whether a football club’s fan club membership correlates to the frequency with which the club has won in the Spanish football league during the past five years. The researcher can easily obtain information about fan club membership and wins from the club’s records. To simplify data collection, the researcher uses the following coding scheme for the fan club membership: 1 = FC Barcelona, 2 = Real Madrid, and 3 = Atletico de Madrid. What measurement scale(s) underlie (a) fan club membership and (b) frequency of wins?
  • 105.
    Exercise 2 4. Anew audio system was installed in a theatre that has a seating capacity of 500 people. The seating area has been divided into three distinct areas: platinum, gold, and silver. At the end of every show in one week, the audience was asked to fill out a questionnaire to determine the effectiveness of the new audio system. What measurement scale does the researcher’s coding scheme for the seating area represent?
  • 106.
    Exercise 2 5. Anadvertiser is studying the impact of a chocolate commercial on different age groups. He puts the age groups in four categories: Group 1 includes 3- to 12-year-olds, Group 2 includes teenagers aged 13 to 19, Group 3 includes adults aged 20 to 49, and Group 4 includes people aged 50 and above. What kind of scale is the classification of age groups in this study? 6. A car manufacturer is studying sales patterns over five years of four different types of car that vary in size and available utilities: hatchbacks (small cars with no trunk space), midsized sedans (cars with limited trunk space and more utilities compared to hatchbacks), sedans (proper trunk space and all utilities), and luxury sedans (big trunk space and luxurious interiors). Based on size and available utilities, which measurement scale does the type of car reflect?
  • 107.
    Exercise 2 7. Achild psychologist is developing an instrument designed to measure the social etiquette of small children. The instrument includes 25 statements; for example, “wishes elders when they meet them,” “courteous to their sibling,” and “says please when asking for something or thank you when someone has helped.” Parents must rate each of these statements on a 5-point scale as follows: 0 never; 1 rarely; 2 sometimes; 3 often; 4 always Parents who answer “never” to each of the 25 questions get the lowest possible score of 0 on the instrument. Parents who answer “always” to each of the 25 questions get the highest possible score of 100 on the instrument. Thus, scores on the instrument range from 0 to 100. What kind of scale do the scores represent?