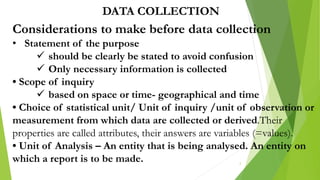
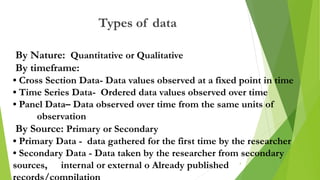
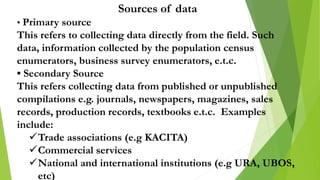
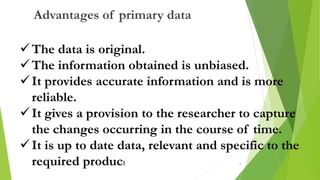
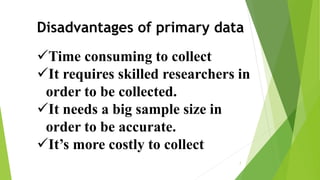
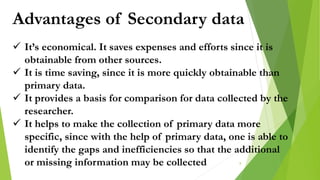
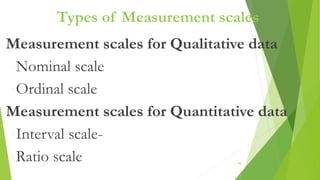
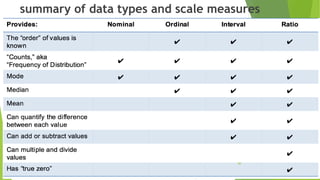
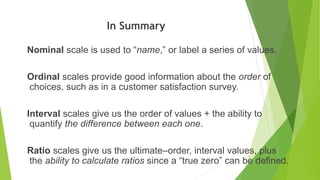
Data Collection Methods
1
Considerations to make before data collection
• Statement of the purpose
 should be clearly be stated to avoid confusion
 Only necessary information is collected
• Scope of inquiry
 based on space or time- geographical and time
• Choice of statistical unit/ Unit of inquiry /unit of observation or
measurement from which data are collected or derived.Their
properties are called attributes, their answers are variables (=values).
• Unit of Analysis – An entity that is being analysed. An entity on
which a report is to be made.
DATA COLLECTION
2
What is Data?
 Data is informational set of facts and numbers that can
analyzed to enable decision-making and conclusions.
 Data can take the form of text, observations, figures,
images, numbers, graphs, or symbols.
 For example, data might include:
individual prices, weights, addresses, ages, names,
temperatures, dates, or distances.
 Data is a raw form of knowledge which, on its own, has
no significant value or purpose.
By Nature: Quantitative or Qualitative
By timeframe:
• Cross Section Data- Data values observed at a fixed point in time
• Time Series Data- Ordered data values observed over time
• Panel Data– Data observed over time from the same units of
observation
By Source: Primary or Secondary
• Primary Data - data gathered for the first time by the researcher
• Secondary Data - Data taken by the researcher from secondary
sources, internal or external o Already published
Types of data
4
Sources of data
• Primary source
This refers to collecting data directly from the field. Such
data, information collected by the population census
enumerators, business survey enumerators, e.t.c.
• Secondary Source
This refers collecting data from published or unpublished
compilations e.g. journals, newspapers, magazines, sales
records, production records, textbooks e.t.c. Examples
include:
Trade associations (e.g KACITA)
Commercial services
National and international institutions (e.g URA, UBOS,
etc)
5
The data is original.
The information obtained is unbiased.
It provides accurate information and is more
reliable.
It gives a provision to the researcher to capture
the changes occurring in the course of time.
It is up to date data, relevant and specific to the
required product
Advantages of primary data
6
Disadvantages of primary data
Time consuming to collect
It requires skilled researchers in
order to be collected.
It needs a big sample size in
order to be accurate.
It’s more costly to collect
7
Advantages of Secondary data
 It’s economical. It saves expenses and efforts since it is
obtainable from other sources.
 It is time saving, since it is more quickly obtainable than
primary data.
 It provides a basis for comparison for data collected by the
researcher.
 It helps to make the collection of primary data more
specific, since with the help of primary data, one is able to
identify the gaps and inefficiencies so that the additional
or missing information may be collected 8
Disadvantages of Secondary data
Accuracy of secondary data is not
known.
 Data may be outdated.
It may not fit in the framework of the
research factors for example units used.
Users of such data may not have as
thorough understanding of the
background as the original researcher.
9
 Data collection technique
 Depends on time available, literacy of the
respondents, language, availability of the
resources, the accuracy required
Methods of data collections
Observation,
Interviews,
Use of questionnaires,
Use of mechanical devices,
Observation
 Uses own eyes to get information relevant to the research.
 Advantages
Subjective bias is minimized,
Information obtained is always most current / up to date.
Easy to handle/carry out, it does not require respondents.
 Disadvantages
Expensive,
Limited information is obtained,
Unforeseen factors can interfere with the process, not all
things are visible.
Interview Method
 Researcher and a respondent come face to face
 Researcher asks questions as the respondent answers.
 Personal interview or a telephone interview, or Skype.
 Normally structured with pre-determined questions.
 Advantages
Realistic information can be obtained,
There is opportunity for probing questions allowing in depth
details
Flexibility, easy to conduct and control.
Interview Method
 Disadvantages
Very expensive,
There may be some bias,
People are not easily approachable,
Time consuming.
Deliberate false information may be given.
Questionnaires
 An instrument to collect data in form of questions that are
answered by the respondent and returned to the researcher
 Can be sent by mail or personally delivered
 Most commonly used by researchers in data collection.
 Questionnaires can be structured or unstructured.
 Structured questionnaires provide alternatives answers of which the
respondents are expected to choose.
 Unstructured questionnaires, the questions are answered in the
respondent’s own words.
Questionnaires
 Advantages
Less costly,
Least biased
Gives respondents enough time to answer the questions,
Can cover a larger area.
 Disadvantages
Few questionnaires are returned,
Can only be used by the literate,
low flexibility in answering,
Can be very slow,
Developing a Questionnaire
 Factors to consider when constructing a questionnaire
Keep the research problem in ,
Keep questions simple and in line with the intended
response and audience.
Check the sequence and formats of the questions.
Scrutinize and remove all technical defects.
Carry out a pilot study to test the questionnaire.
Selection of Data Collection Method
When selecting a data collection method consider
the following factors:
Type of inquiry to be carried out.
Available resources in terms of people and funds.
Time available to do the research.
The end user and nature of inference to be
made.
Sampling
 A Sample is a small sub-group obtained from the population. Each
member of the sample is referred to as a subject
 Why sample
 Time and budget constraints
 Accessibility to elements
Sampling (cont’d)
 Population (Universe)
 A group of individuals, events or objects having a common observable
characteristic
 Example
 All P7 students in Uganda
 All indigenous trees in National Forests
 All students of MUBS
 Census –Investigation of all elements in a population
 A Researcher first defines the population to which He or She wants to
generalize the results. This is the target population or Universe
Sampling designs/ sampling techniques
• A sampling design is a process by which units of the population
are drawn into the sample.
• The selection of the units can either be based on probabilities or
no probabilities involved hence resulting into two broad sampling
designs;-
• Probability and non sampling techniques
• For probability sampling, each unit in the study population has
same chance of being included into the sample.
• It is also referred to as random sampling or sampling without
bias
• Under non probability sampling, there is no randomness in the
selection of sampling units into the sample.
• Sampling is not based on chance. It is therefore also referred to
as non random sampling or sampling with bias
21
TYPES OF SAMPLING TECHNIQUES
Sampling Techniques
Probability Sampling
 Simple Random
 Stratified Random
 Custer Sampling
 Systematic sampling
 Multi-stage sampling
Non-probability Sampling
 Convenience Sampling
 Purposive Sampling
 Snowballing Sampling
 Quota Sampling
A probability sampling
 Sampling method that utilizes some form of random selection.
Random selection method
Simple random sampling. Here all elements have equal
chance to be representative, and all elements are part of the
population
Systematic random sampling. Here the sample is chosen
systematically by choosing at random the first and then every
nth element.
Stratified random sampling. Here the population is divided
into strata’s using either proportionate or non proportionate
stratification
No of elements in the strata x the required sample
Total population
A probability sampling
Cluster Sampling
Identify the population
Define clusters forming the population
Determine the required sample size
List clusters in a random order
Select randomly the number of clusters depending on sample
size
All members in the cluster are included in the sample as
units of observation
Example: Schools, towns, hospitals Government Ministries
A probability sampling
Single-stage cluster sampling vs two-stage cluster
sampling,
Limits generalization
 Area sampling. This relates to geographical locations. When
cluster sampling is based on geographical sub divisions, it’s
is known as area sampling. E.g. if you are to consider
districts from the east, to represent the whole country.
 Multi stage sampling. Here we use more than one sampling
technique to come up with a more reliable sample.
SAMPLING FRAME
 Sampling Frame
A list of all items in your population. A population is general while
a sampling frame is specific.
 population is too large to access directly;
 perhaps some elements of the population are more difficult to
locate
 there are numerous pragmatic problems that arise in sampling
populations
 Sampling frames must be assessed for all the above features, but
 particularly for completeness and potential bias
SAMPLE SIZE
 Sampling frame error- Occurs when certain sample
elements are excluded or when the entire population is
not accurately represented in the sampling frame.
 Sample Size
The Cochran formula is: n=
𝒁𝟐𝒑 𝟏−𝒑
𝒅𝟐 for N>10,000
p= proportion of the target population estimated to have
characteristic being measured
d= the level of statistical significance
Z= the standard normal deviation at the required significance
EXAMPLE
Suppose we are doing a study on the inhabitants of a large town, and
want to find out how many households serve breakfast in the
mornings. We don’t have much information on the subject to begin
with, so we’re going to assume that half of the families serve
breakfast: this gives us maximum variability. So p = 0.5. Now let’s say
we want 95% confidence, and at least 5 percent—plus or minus—
precision. A 95 % confidence level gives us Z values of 1.96, per the
normal tables, so we get
((1.96)2 (0.5) (0.5)) / (0.05)2 = 385.
So a random sample of 385 households in our target population should
be enough to give us the confidence levels we need.
SAMPLE SIZE (Con’d)
For small populations and for N<10,000
𝒏𝒇 =
𝒏
𝟏+
𝒏−𝟏
𝑵
Here n is Cochran’s sample size recommendation, N is the
population size, and n is the new, adjusted sample size. In
our earlier example, if there were just 1000 households in
the target population, we would calculate
385 / (1 + ( 384 / 1000 )) = 278
SAMPLE SIZE (Con’d)
 Yamane’s Formula
n =
𝑵
𝟏+𝑵(𝒆)𝟐
Consider a population of 5,000
N= 5000
e = 0.05
n =
5000
1+5000(0.05)2 =
5000
1+12.5
=370
SAMPLE SIZE (Con’d)
Krejcie & Morgan (1970) came up
with a table for determining
sample size for a given
population for easy reference
SAMPLE SIZE (Con’d)
Krejcie & Morgan (1970)
STRATA NUMBERS
TM 50 100(50/500)
MM 150 100x(150/500)
W 300 100x(300/500)
TOTAL 500 100
Non probability sampling
Used when approaching the sampling problem
with a specific plan in mind.
Convenience (accidental),
Purposive sampling or Judgmental
Snowballing
Quota Sampling
Non probability sampling (Biased Sampling)
Convenience (accidental)
Selection of sample based on convenience to the
researcher
Purposive sampling or Judgmental Sampling
Sample selection based on researchers own
knowledge, skills and experience
Focuses on the right respondents of the research
process
Non probability sampling (Biased Sampling)
 Snowball Sampling
Initial subjects are identified using purposeful sampling
The few identified name others with similar
characteristics
Applied when the population needed is not well known
by the researcher
Example: A study of former Uganda Airlines, Life after
retirement etc.
Non probability sampling (Biased Sampling)
 Quota Sampling
Choice of respondents based on predetermined
characteristics
Sample has the same characteristics as the wider population
Procedure
Step 1: Divide the population into strata. First, you identify
important strata, subgroups in your population of interest
Step 2: Determine a quota for each stratum. Next, you estimate
the proportions of each stratum in the population.
Step 3: Continue recruiting until the quota for each stratum is met.
Measurement Scales
Characteristics of Good Measures
Is the measure relevant?
Is the measure credible?
Is the measure valid?
Is the measure reliable?
IPDET © 2009 39
Relevance
Does the
measure
capture what
matters?
Do not
measure what
is easy instead
of what is
needed
IPDET © 2009 40
Credibility
Is the measure believable? Will
it be viewed as a reasonable
and appropriate way to capture
the information sought?
IPDET © 2009 41
Internal Validity
How well does
the measure
capture what
it is supposed
to?
Are waiting
lists a valid
measure of
demand?
IPDET © 2009 42
Reliability
A measure’s
precision and
stability- extent to
which the same
result would be
obtained with
repeated trials
How reliable are:
birth weights of
newborn infants?
speeds measured by
a stopwatch?
IPDET © 2009 43
Types of Measurement scales
Measurement scales for Qualitative data
•Nominal scale
•Ordinal scale
Measurement scales for Quantitative data
•Interval scale-
•Ratio scale 44
Nominal scale
•It is used for variables that can be measured by
classification only. Non-numerical in nature.
It involves only naming.
•Categories without a meaningful order identify
nominal data (Gender, political affiliation,
industry classification, ethnic/cultural groups).
45
Sex of respondent 1=Male
2=Female
Religious affiliation 1= Anglican
2= Catholic
3= Born again2= Eastern
4= Moslem3= Northern
5= Others ...
Position held 1=Owner
2=Manager
3=Director
4=Other, Specify……………
Examples of nominal scales
46
It involves ordering (its what’s important and
significant)
• It is a measurable scale which focuses or bases on
ranking of ordered Categories.eg in athletics
competition we have the first, second, third
…………….etc
47
Ordinal scale
Response scale 1= SD 2= D 3= N 4= A 5= SA
Tax Registration
Tax officers are helpful to us when it comes to registering for taxes.
We find it easy registering for taxes
We do not lose so much time at registration for taxes
Interval scale
Interval scales are numeric scales in which we
know not only the order, but also the exact
differences between the values.
An example of an interval scale is the Fahrenheit
scale for measuring temperature i.e.
the increments are known, consistent, and
measurable.
48
Ratio scales are the best when it comes to
measurement scales because they tell us about
– 1.The order,
2. The exact value between units,
3. They also have an absolute zero
• Good examples of ratio variables include height
and weight. 49
Ratio scale
summary of data types and scale measures
50
In Summary
Nominal scale is used to “name,” or label a series of values.
Ordinal scales provide good information about the order of
choices, such as in a customer satisfaction survey.
Interval scales give us the order of values + the ability to
quantify the difference between each one.
Ratio scales give us the ultimate–order, interval values, plus
the ability to calculate ratios since a “true zero” can be defined.
51
52
Questions or Comments
?

This document presents an invaluable class notes for Quantitative Methods Topic 1&2 On Data Collection Methods

  • 1.
  • 2.
    Considerations to makebefore data collection • Statement of the purpose  should be clearly be stated to avoid confusion  Only necessary information is collected • Scope of inquiry  based on space or time- geographical and time • Choice of statistical unit/ Unit of inquiry /unit of observation or measurement from which data are collected or derived.Their properties are called attributes, their answers are variables (=values). • Unit of Analysis – An entity that is being analysed. An entity on which a report is to be made. DATA COLLECTION 2
  • 3.
    What is Data? Data is informational set of facts and numbers that can analyzed to enable decision-making and conclusions.  Data can take the form of text, observations, figures, images, numbers, graphs, or symbols.  For example, data might include: individual prices, weights, addresses, ages, names, temperatures, dates, or distances.  Data is a raw form of knowledge which, on its own, has no significant value or purpose.
  • 4.
    By Nature: Quantitativeor Qualitative By timeframe: • Cross Section Data- Data values observed at a fixed point in time • Time Series Data- Ordered data values observed over time • Panel Data– Data observed over time from the same units of observation By Source: Primary or Secondary • Primary Data - data gathered for the first time by the researcher • Secondary Data - Data taken by the researcher from secondary sources, internal or external o Already published Types of data 4
  • 5.
    Sources of data •Primary source This refers to collecting data directly from the field. Such data, information collected by the population census enumerators, business survey enumerators, e.t.c. • Secondary Source This refers collecting data from published or unpublished compilations e.g. journals, newspapers, magazines, sales records, production records, textbooks e.t.c. Examples include: Trade associations (e.g KACITA) Commercial services National and international institutions (e.g URA, UBOS, etc) 5
  • 6.
    The data isoriginal. The information obtained is unbiased. It provides accurate information and is more reliable. It gives a provision to the researcher to capture the changes occurring in the course of time. It is up to date data, relevant and specific to the required product Advantages of primary data 6
  • 7.
    Disadvantages of primarydata Time consuming to collect It requires skilled researchers in order to be collected. It needs a big sample size in order to be accurate. It’s more costly to collect 7
  • 8.
    Advantages of Secondarydata  It’s economical. It saves expenses and efforts since it is obtainable from other sources.  It is time saving, since it is more quickly obtainable than primary data.  It provides a basis for comparison for data collected by the researcher.  It helps to make the collection of primary data more specific, since with the help of primary data, one is able to identify the gaps and inefficiencies so that the additional or missing information may be collected 8
  • 9.
    Disadvantages of Secondarydata Accuracy of secondary data is not known.  Data may be outdated. It may not fit in the framework of the research factors for example units used. Users of such data may not have as thorough understanding of the background as the original researcher. 9
  • 10.
     Data collectiontechnique  Depends on time available, literacy of the respondents, language, availability of the resources, the accuracy required
  • 11.
    Methods of datacollections Observation, Interviews, Use of questionnaires, Use of mechanical devices,
  • 12.
    Observation  Uses owneyes to get information relevant to the research.  Advantages Subjective bias is minimized, Information obtained is always most current / up to date. Easy to handle/carry out, it does not require respondents.  Disadvantages Expensive, Limited information is obtained, Unforeseen factors can interfere with the process, not all things are visible.
  • 13.
    Interview Method  Researcherand a respondent come face to face  Researcher asks questions as the respondent answers.  Personal interview or a telephone interview, or Skype.  Normally structured with pre-determined questions.  Advantages Realistic information can be obtained, There is opportunity for probing questions allowing in depth details Flexibility, easy to conduct and control.
  • 14.
    Interview Method  Disadvantages Veryexpensive, There may be some bias, People are not easily approachable, Time consuming. Deliberate false information may be given.
  • 15.
    Questionnaires  An instrumentto collect data in form of questions that are answered by the respondent and returned to the researcher  Can be sent by mail or personally delivered  Most commonly used by researchers in data collection.  Questionnaires can be structured or unstructured.  Structured questionnaires provide alternatives answers of which the respondents are expected to choose.  Unstructured questionnaires, the questions are answered in the respondent’s own words.
  • 16.
    Questionnaires  Advantages Less costly, Leastbiased Gives respondents enough time to answer the questions, Can cover a larger area.  Disadvantages Few questionnaires are returned, Can only be used by the literate, low flexibility in answering, Can be very slow,
  • 17.
    Developing a Questionnaire Factors to consider when constructing a questionnaire Keep the research problem in , Keep questions simple and in line with the intended response and audience. Check the sequence and formats of the questions. Scrutinize and remove all technical defects. Carry out a pilot study to test the questionnaire.
  • 18.
    Selection of DataCollection Method When selecting a data collection method consider the following factors: Type of inquiry to be carried out. Available resources in terms of people and funds. Time available to do the research. The end user and nature of inference to be made.
  • 19.
    Sampling  A Sampleis a small sub-group obtained from the population. Each member of the sample is referred to as a subject  Why sample  Time and budget constraints  Accessibility to elements
  • 20.
    Sampling (cont’d)  Population(Universe)  A group of individuals, events or objects having a common observable characteristic  Example  All P7 students in Uganda  All indigenous trees in National Forests  All students of MUBS  Census –Investigation of all elements in a population  A Researcher first defines the population to which He or She wants to generalize the results. This is the target population or Universe
  • 21.
    Sampling designs/ samplingtechniques • A sampling design is a process by which units of the population are drawn into the sample. • The selection of the units can either be based on probabilities or no probabilities involved hence resulting into two broad sampling designs;- • Probability and non sampling techniques • For probability sampling, each unit in the study population has same chance of being included into the sample. • It is also referred to as random sampling or sampling without bias • Under non probability sampling, there is no randomness in the selection of sampling units into the sample. • Sampling is not based on chance. It is therefore also referred to as non random sampling or sampling with bias 21
  • 22.
    TYPES OF SAMPLINGTECHNIQUES Sampling Techniques Probability Sampling  Simple Random  Stratified Random  Custer Sampling  Systematic sampling  Multi-stage sampling Non-probability Sampling  Convenience Sampling  Purposive Sampling  Snowballing Sampling  Quota Sampling
  • 23.
    A probability sampling Sampling method that utilizes some form of random selection. Random selection method Simple random sampling. Here all elements have equal chance to be representative, and all elements are part of the population Systematic random sampling. Here the sample is chosen systematically by choosing at random the first and then every nth element. Stratified random sampling. Here the population is divided into strata’s using either proportionate or non proportionate stratification No of elements in the strata x the required sample Total population
  • 24.
    A probability sampling ClusterSampling Identify the population Define clusters forming the population Determine the required sample size List clusters in a random order Select randomly the number of clusters depending on sample size All members in the cluster are included in the sample as units of observation Example: Schools, towns, hospitals Government Ministries
  • 25.
    A probability sampling Single-stagecluster sampling vs two-stage cluster sampling, Limits generalization  Area sampling. This relates to geographical locations. When cluster sampling is based on geographical sub divisions, it’s is known as area sampling. E.g. if you are to consider districts from the east, to represent the whole country.  Multi stage sampling. Here we use more than one sampling technique to come up with a more reliable sample.
  • 26.
    SAMPLING FRAME  SamplingFrame A list of all items in your population. A population is general while a sampling frame is specific.  population is too large to access directly;  perhaps some elements of the population are more difficult to locate  there are numerous pragmatic problems that arise in sampling populations  Sampling frames must be assessed for all the above features, but  particularly for completeness and potential bias
  • 27.
    SAMPLE SIZE  Samplingframe error- Occurs when certain sample elements are excluded or when the entire population is not accurately represented in the sampling frame.  Sample Size The Cochran formula is: n= 𝒁𝟐𝒑 𝟏−𝒑 𝒅𝟐 for N>10,000 p= proportion of the target population estimated to have characteristic being measured d= the level of statistical significance Z= the standard normal deviation at the required significance
  • 28.
    EXAMPLE Suppose we aredoing a study on the inhabitants of a large town, and want to find out how many households serve breakfast in the mornings. We don’t have much information on the subject to begin with, so we’re going to assume that half of the families serve breakfast: this gives us maximum variability. So p = 0.5. Now let’s say we want 95% confidence, and at least 5 percent—plus or minus— precision. A 95 % confidence level gives us Z values of 1.96, per the normal tables, so we get ((1.96)2 (0.5) (0.5)) / (0.05)2 = 385. So a random sample of 385 households in our target population should be enough to give us the confidence levels we need.
  • 29.
    SAMPLE SIZE (Con’d) Forsmall populations and for N<10,000 𝒏𝒇 = 𝒏 𝟏+ 𝒏−𝟏 𝑵 Here n is Cochran’s sample size recommendation, N is the population size, and n is the new, adjusted sample size. In our earlier example, if there were just 1000 households in the target population, we would calculate 385 / (1 + ( 384 / 1000 )) = 278
  • 30.
    SAMPLE SIZE (Con’d) Yamane’s Formula n = 𝑵 𝟏+𝑵(𝒆)𝟐 Consider a population of 5,000 N= 5000 e = 0.05 n = 5000 1+5000(0.05)2 = 5000 1+12.5 =370
  • 31.
    SAMPLE SIZE (Con’d) Krejcie& Morgan (1970) came up with a table for determining sample size for a given population for easy reference
  • 32.
  • 33.
    STRATA NUMBERS TM 50100(50/500) MM 150 100x(150/500) W 300 100x(300/500) TOTAL 500 100
  • 34.
    Non probability sampling Usedwhen approaching the sampling problem with a specific plan in mind. Convenience (accidental), Purposive sampling or Judgmental Snowballing Quota Sampling
  • 35.
    Non probability sampling(Biased Sampling) Convenience (accidental) Selection of sample based on convenience to the researcher Purposive sampling or Judgmental Sampling Sample selection based on researchers own knowledge, skills and experience Focuses on the right respondents of the research process
  • 36.
    Non probability sampling(Biased Sampling)  Snowball Sampling Initial subjects are identified using purposeful sampling The few identified name others with similar characteristics Applied when the population needed is not well known by the researcher Example: A study of former Uganda Airlines, Life after retirement etc.
  • 37.
    Non probability sampling(Biased Sampling)  Quota Sampling Choice of respondents based on predetermined characteristics Sample has the same characteristics as the wider population Procedure Step 1: Divide the population into strata. First, you identify important strata, subgroups in your population of interest Step 2: Determine a quota for each stratum. Next, you estimate the proportions of each stratum in the population. Step 3: Continue recruiting until the quota for each stratum is met.
  • 39.
    Measurement Scales Characteristics ofGood Measures Is the measure relevant? Is the measure credible? Is the measure valid? Is the measure reliable? IPDET © 2009 39
  • 40.
    Relevance Does the measure capture what matters? Donot measure what is easy instead of what is needed IPDET © 2009 40
  • 41.
    Credibility Is the measurebelievable? Will it be viewed as a reasonable and appropriate way to capture the information sought? IPDET © 2009 41
  • 42.
    Internal Validity How welldoes the measure capture what it is supposed to? Are waiting lists a valid measure of demand? IPDET © 2009 42
  • 43.
    Reliability A measure’s precision and stability-extent to which the same result would be obtained with repeated trials How reliable are: birth weights of newborn infants? speeds measured by a stopwatch? IPDET © 2009 43
  • 44.
    Types of Measurementscales Measurement scales for Qualitative data •Nominal scale •Ordinal scale Measurement scales for Quantitative data •Interval scale- •Ratio scale 44
  • 45.
    Nominal scale •It isused for variables that can be measured by classification only. Non-numerical in nature. It involves only naming. •Categories without a meaningful order identify nominal data (Gender, political affiliation, industry classification, ethnic/cultural groups). 45
  • 46.
    Sex of respondent1=Male 2=Female Religious affiliation 1= Anglican 2= Catholic 3= Born again2= Eastern 4= Moslem3= Northern 5= Others ... Position held 1=Owner 2=Manager 3=Director 4=Other, Specify…………… Examples of nominal scales 46
  • 47.
    It involves ordering(its what’s important and significant) • It is a measurable scale which focuses or bases on ranking of ordered Categories.eg in athletics competition we have the first, second, third …………….etc 47 Ordinal scale Response scale 1= SD 2= D 3= N 4= A 5= SA Tax Registration Tax officers are helpful to us when it comes to registering for taxes. We find it easy registering for taxes We do not lose so much time at registration for taxes
  • 48.
    Interval scale Interval scalesare numeric scales in which we know not only the order, but also the exact differences between the values. An example of an interval scale is the Fahrenheit scale for measuring temperature i.e. the increments are known, consistent, and measurable. 48
  • 49.
    Ratio scales arethe best when it comes to measurement scales because they tell us about – 1.The order, 2. The exact value between units, 3. They also have an absolute zero • Good examples of ratio variables include height and weight. 49 Ratio scale
  • 50.
    summary of datatypes and scale measures 50
  • 51.
    In Summary Nominal scaleis used to “name,” or label a series of values. Ordinal scales provide good information about the order of choices, such as in a customer satisfaction survey. Interval scales give us the order of values + the ability to quantify the difference between each one. Ratio scales give us the ultimate–order, interval values, plus the ability to calculate ratios since a “true zero” can be defined. 51
  • 52.