UNIT
2
Dr. Suyash Bhardwaj
AssistantProfessor
Department of Computer Science & Engineering
Faculty of Engineering & Technology
Gurukula Kangri Deemed to be University
2.
Contents
• Data CollectionStrategies
• Data Pre-Processing Overview
• Data Cleaning
• Data Integration and
Transformation
• Data Reduction
• Data Discretization.
3.
What is
data?
• Datais a collection of Raw Facts and Figures,
which when put into meaningful form produce
information.
• This information can be used to generate wisdom
that helps in taking decisions.
4.
Why Do WeNeed Data Collection?
• Everywhere data is applied to deduce results
• In Courts data is historical references of similar
cases
• In Medical Institutions, data is patients history
and vital stats
• In Civil Engineering data is measurement of
variable factors
• In Chemical Industry data is %of chemical to mix
to get desired result
5.
What is DataCollection?
• Data Collection is the process of collecting,
measuring and analyzing different types of
information using a set of standard validated
techniques.
• The main objective of data collection is to gather
information-rich and reliable data, and analyze them
to make critical business decisions.
6.
What is DataCollection?
• Once the data is collected, it goes through a
rigorous process of data cleaning and data
processing to make this data truly useful for
businesses.
• There are two main methods of data collection in
research based on the information that is
required, namely: Primary Data Collection,
Secondary Data Collection
7.
Methods of data
collection
•Primary Data Collection: This involves collecting new data
directly from the source. Primary data collection methods
include: Surveys, Interviews, Focus groups, Observations,
Experiments, Case studies
• Secondary Data Collection: This involves collecting data that
has already been collected and processed by someone else.
Secondary data collection methods include: Government
publications, Industry reports, Academic literature, Market
research reports, Historical data, Social media data
8.
Primary Data CollectionMethods
• Primary data refers to data collected from first-
hand experience directly from the main source.
• It refers to data that has never been used in the
past.
• The data gathered by primary data collection methods
are generally regarded as the best kind of data in
research.
• The methods of collecting primary data can be
further divided into
• Quantitative Data Collection Methods
• Qualitative Data Collection Methods
9.
Types of PrimaryData
collection Methods
• Quantitative data collection methods: These methods involve
collecting numerical data that can be analyzed using statistical
methods.
• Examples of quantitative data collection methods include
surveys,
experiments, and structured observations.
• Qualitative data collection methods: These methods involve
collecting non-numerical data that cannot be easily quantified or
analyzed using statistical methods.
• Examples of qualitative data collection methods include
interviews, focus groups, case studies, and ethnography.
10.
Quantitative
Primary Data CollectionMethods
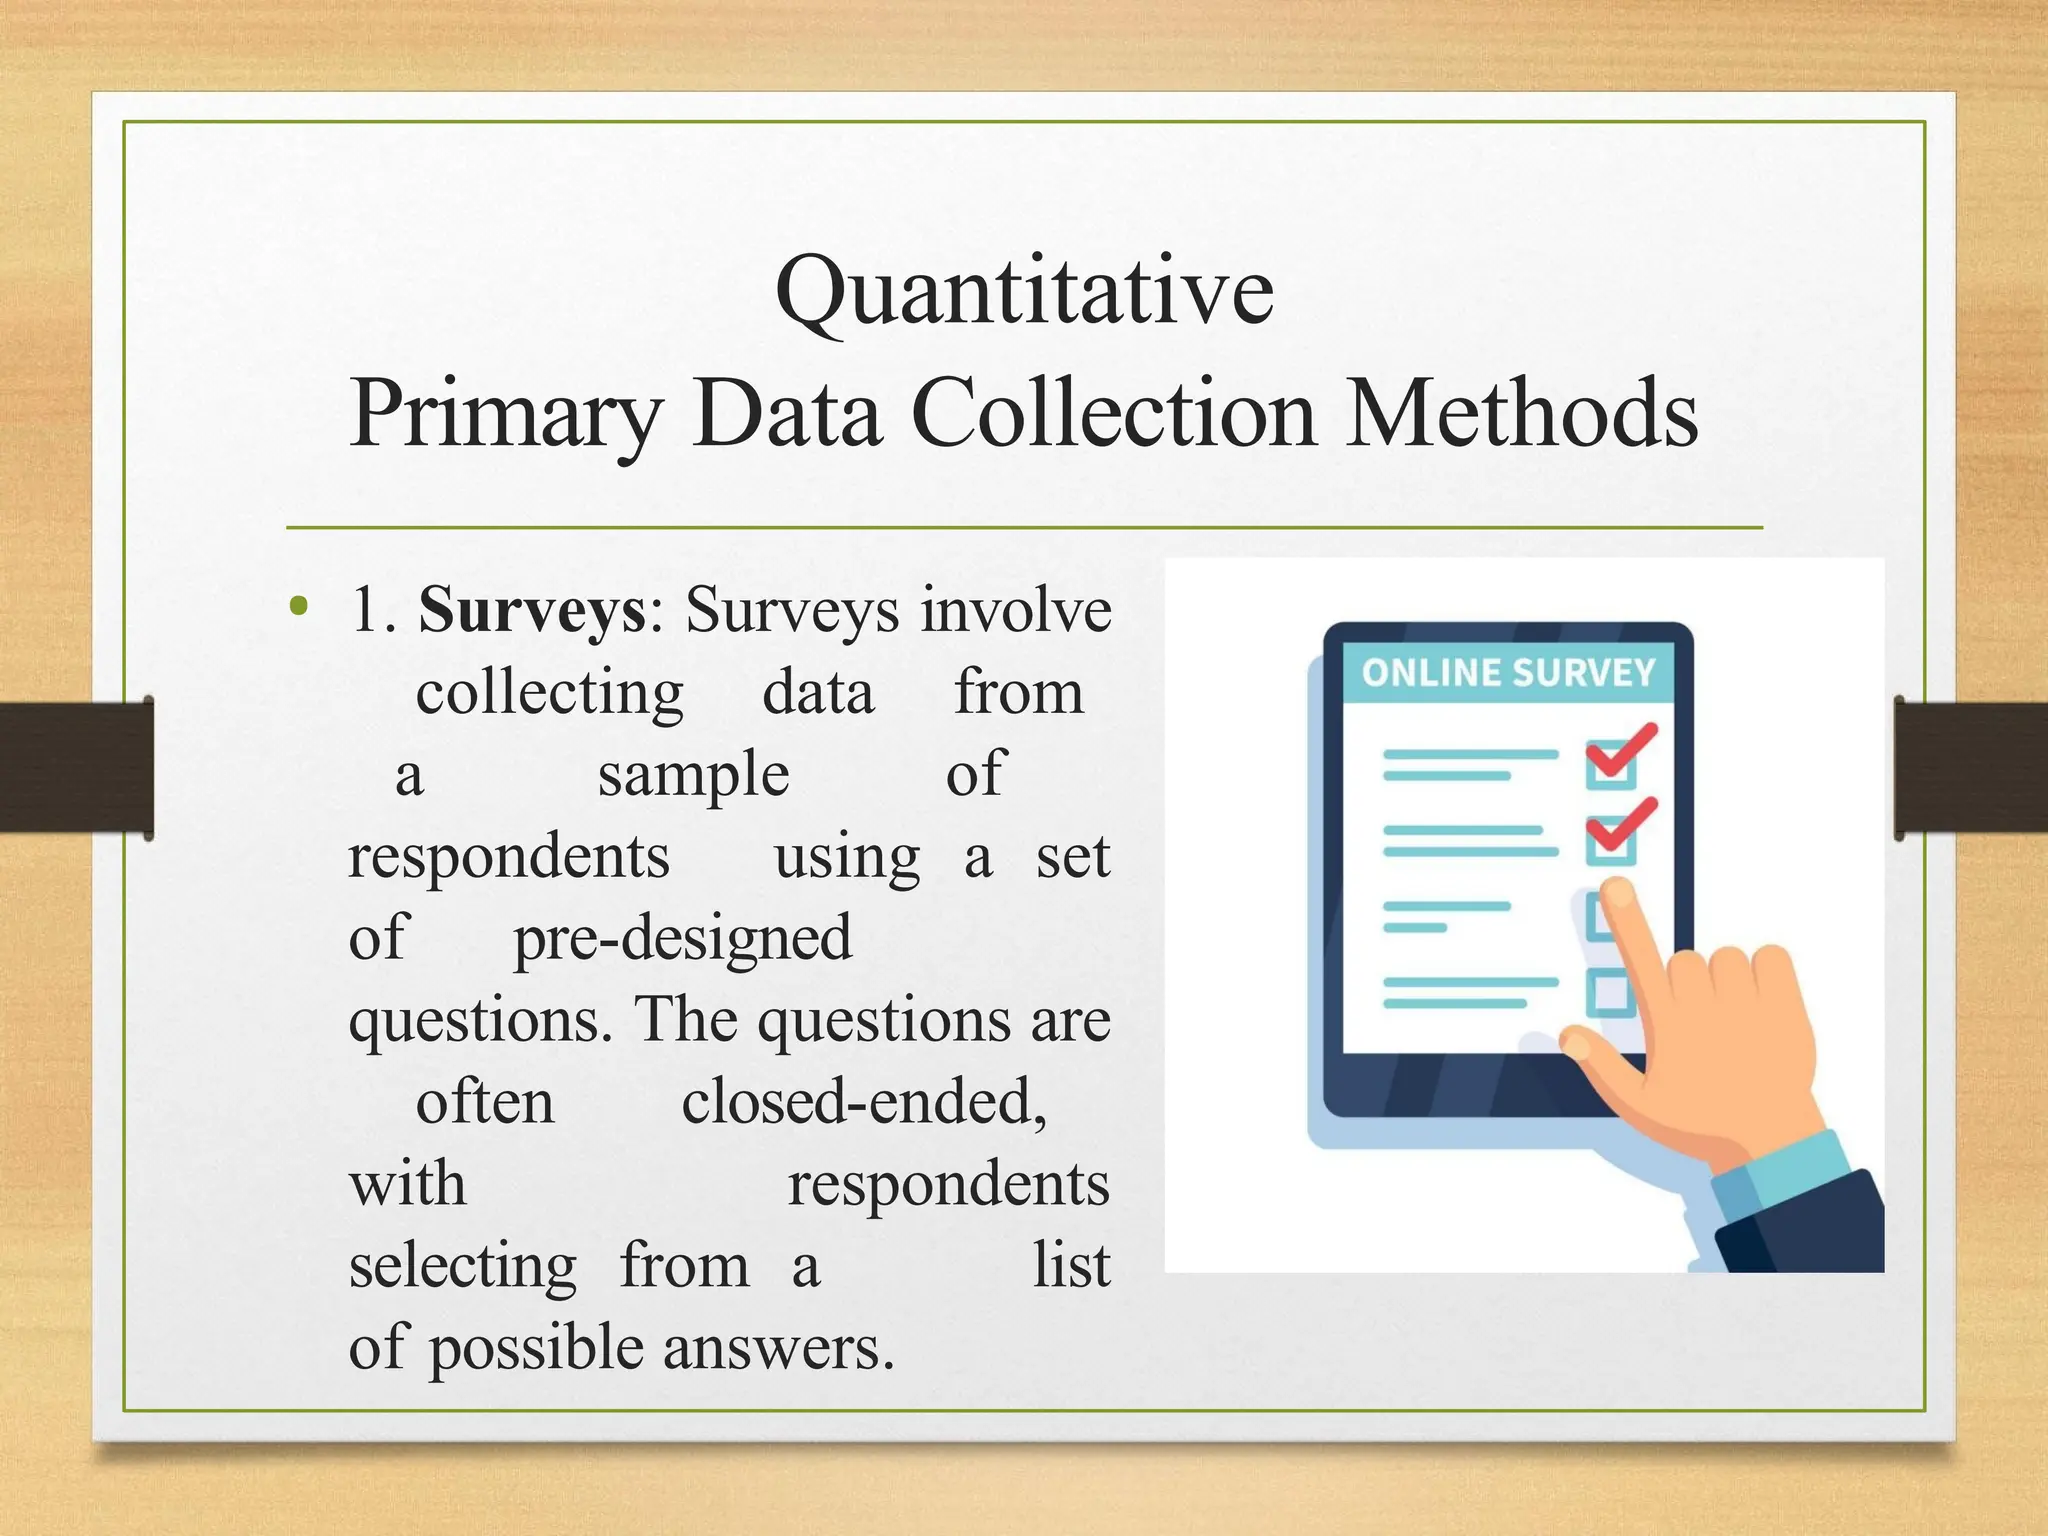
• 1. Surveys: Surveys involve
collecting data from
a sample of
respondents using a set
of pre-designed
questions. The questions are
often closed-ended,
with respondents
selecting from a list
of possible answers.
11.
Quantitative
Primary Data CollectionMethods
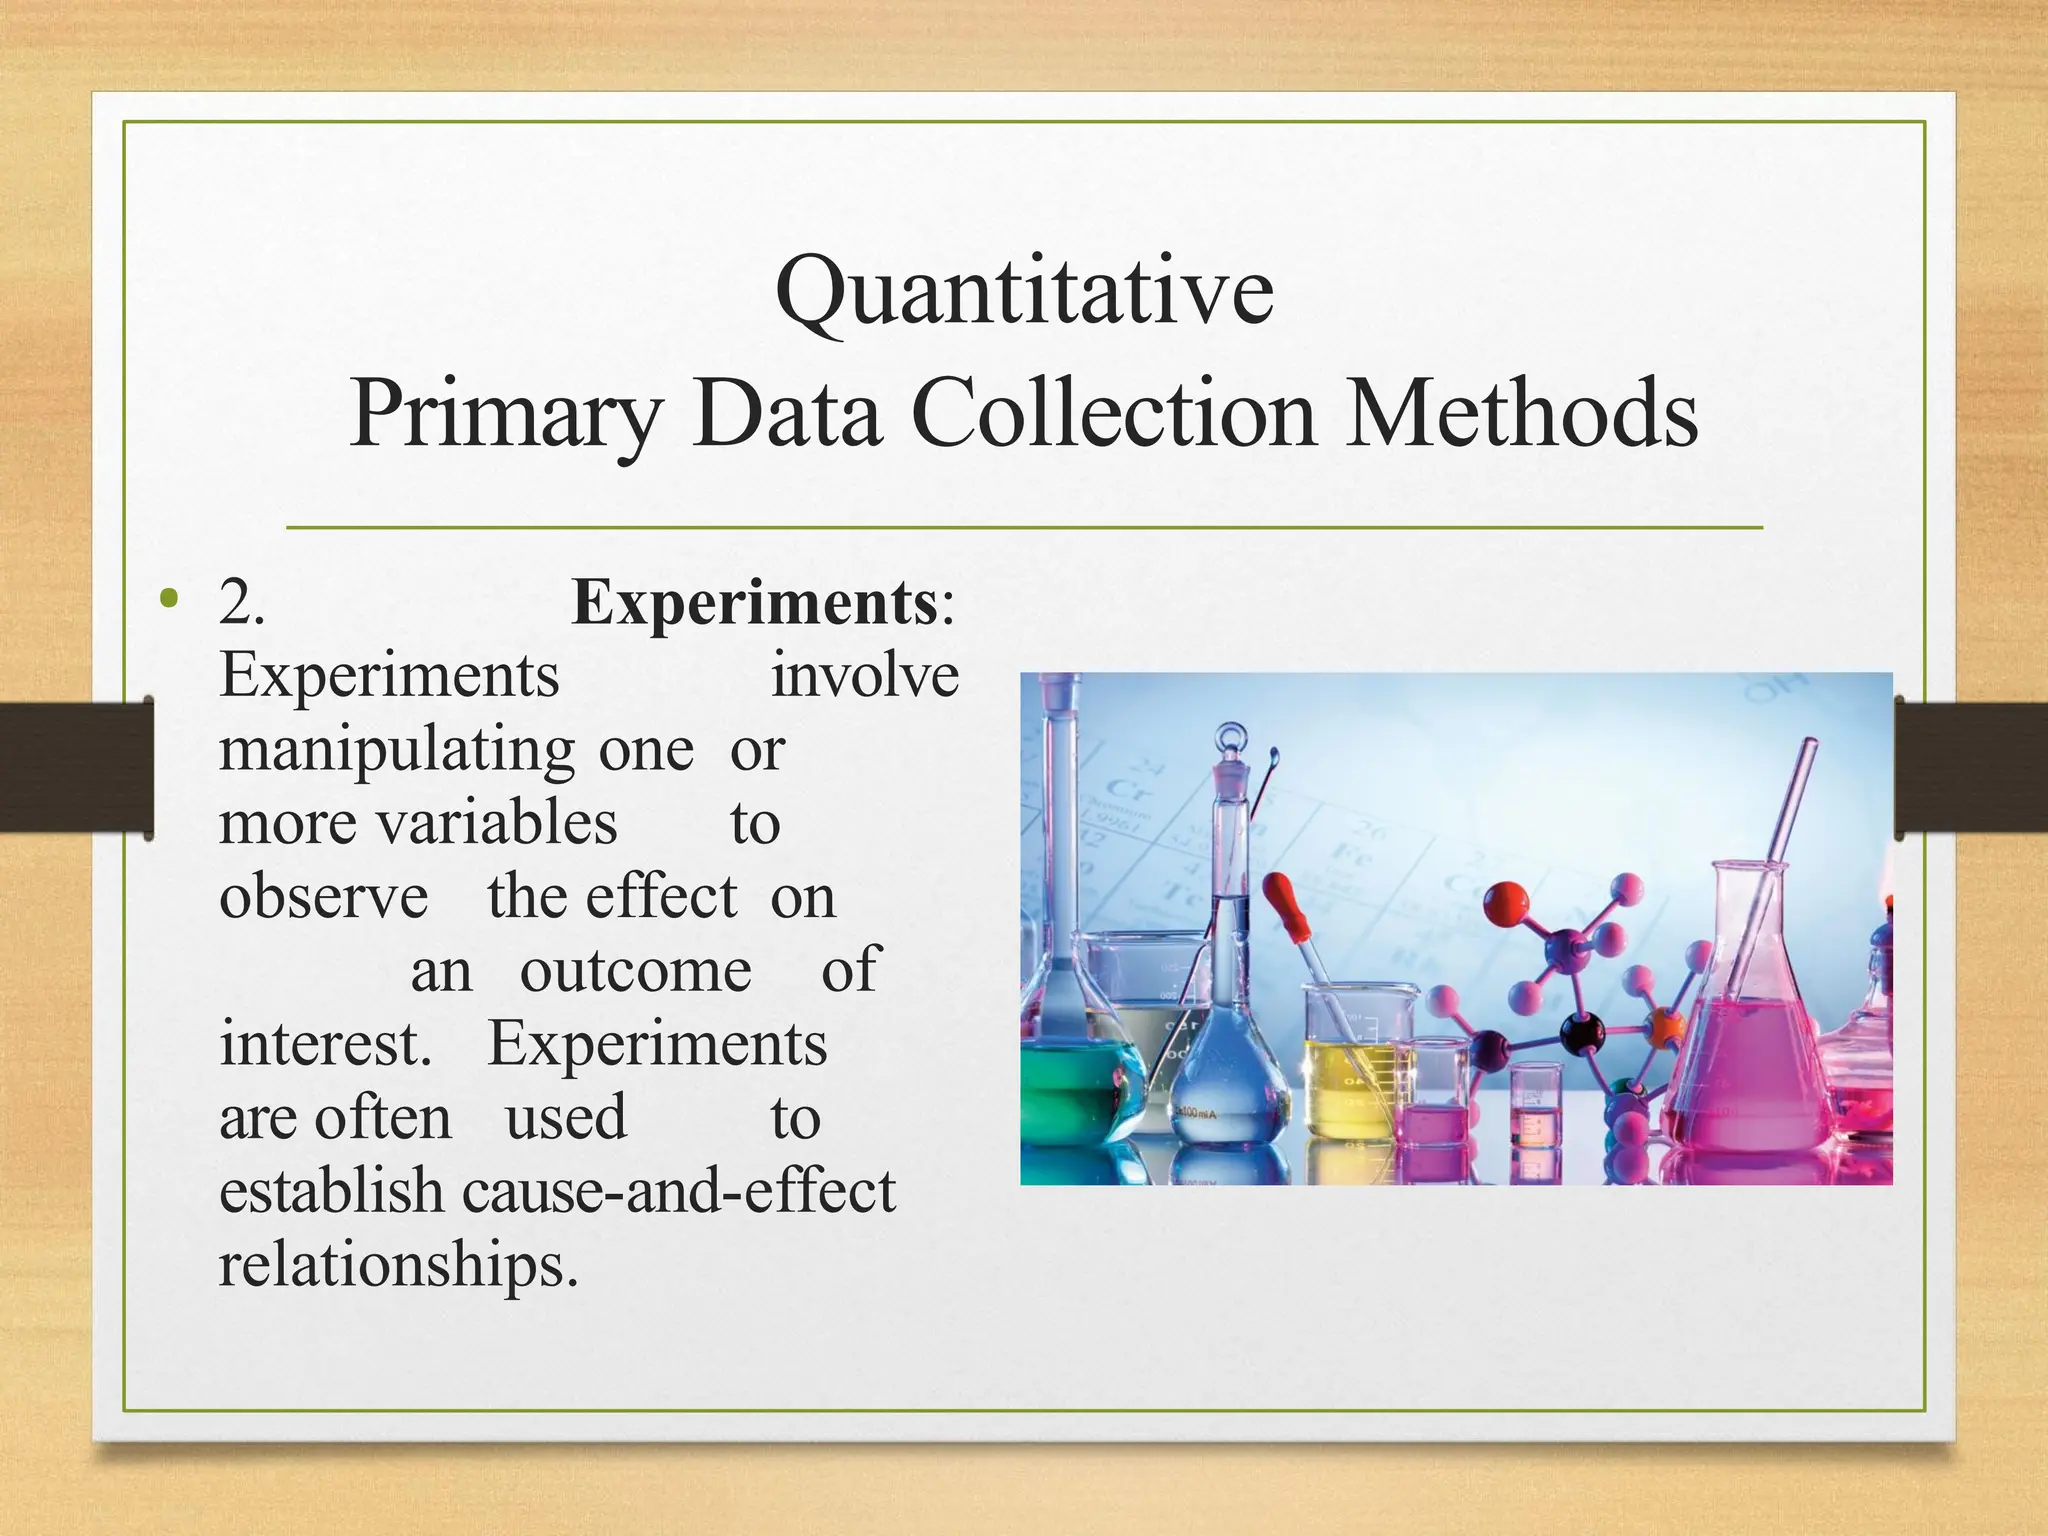
• 2. Experiments:
Experiments involve
manipulating one or
more variables to
observe the effect on
an outcome of
interest. Experiments
are often used to
establish cause-and-effect
relationships.
12.
Quantitative
Primary Data CollectionMethods
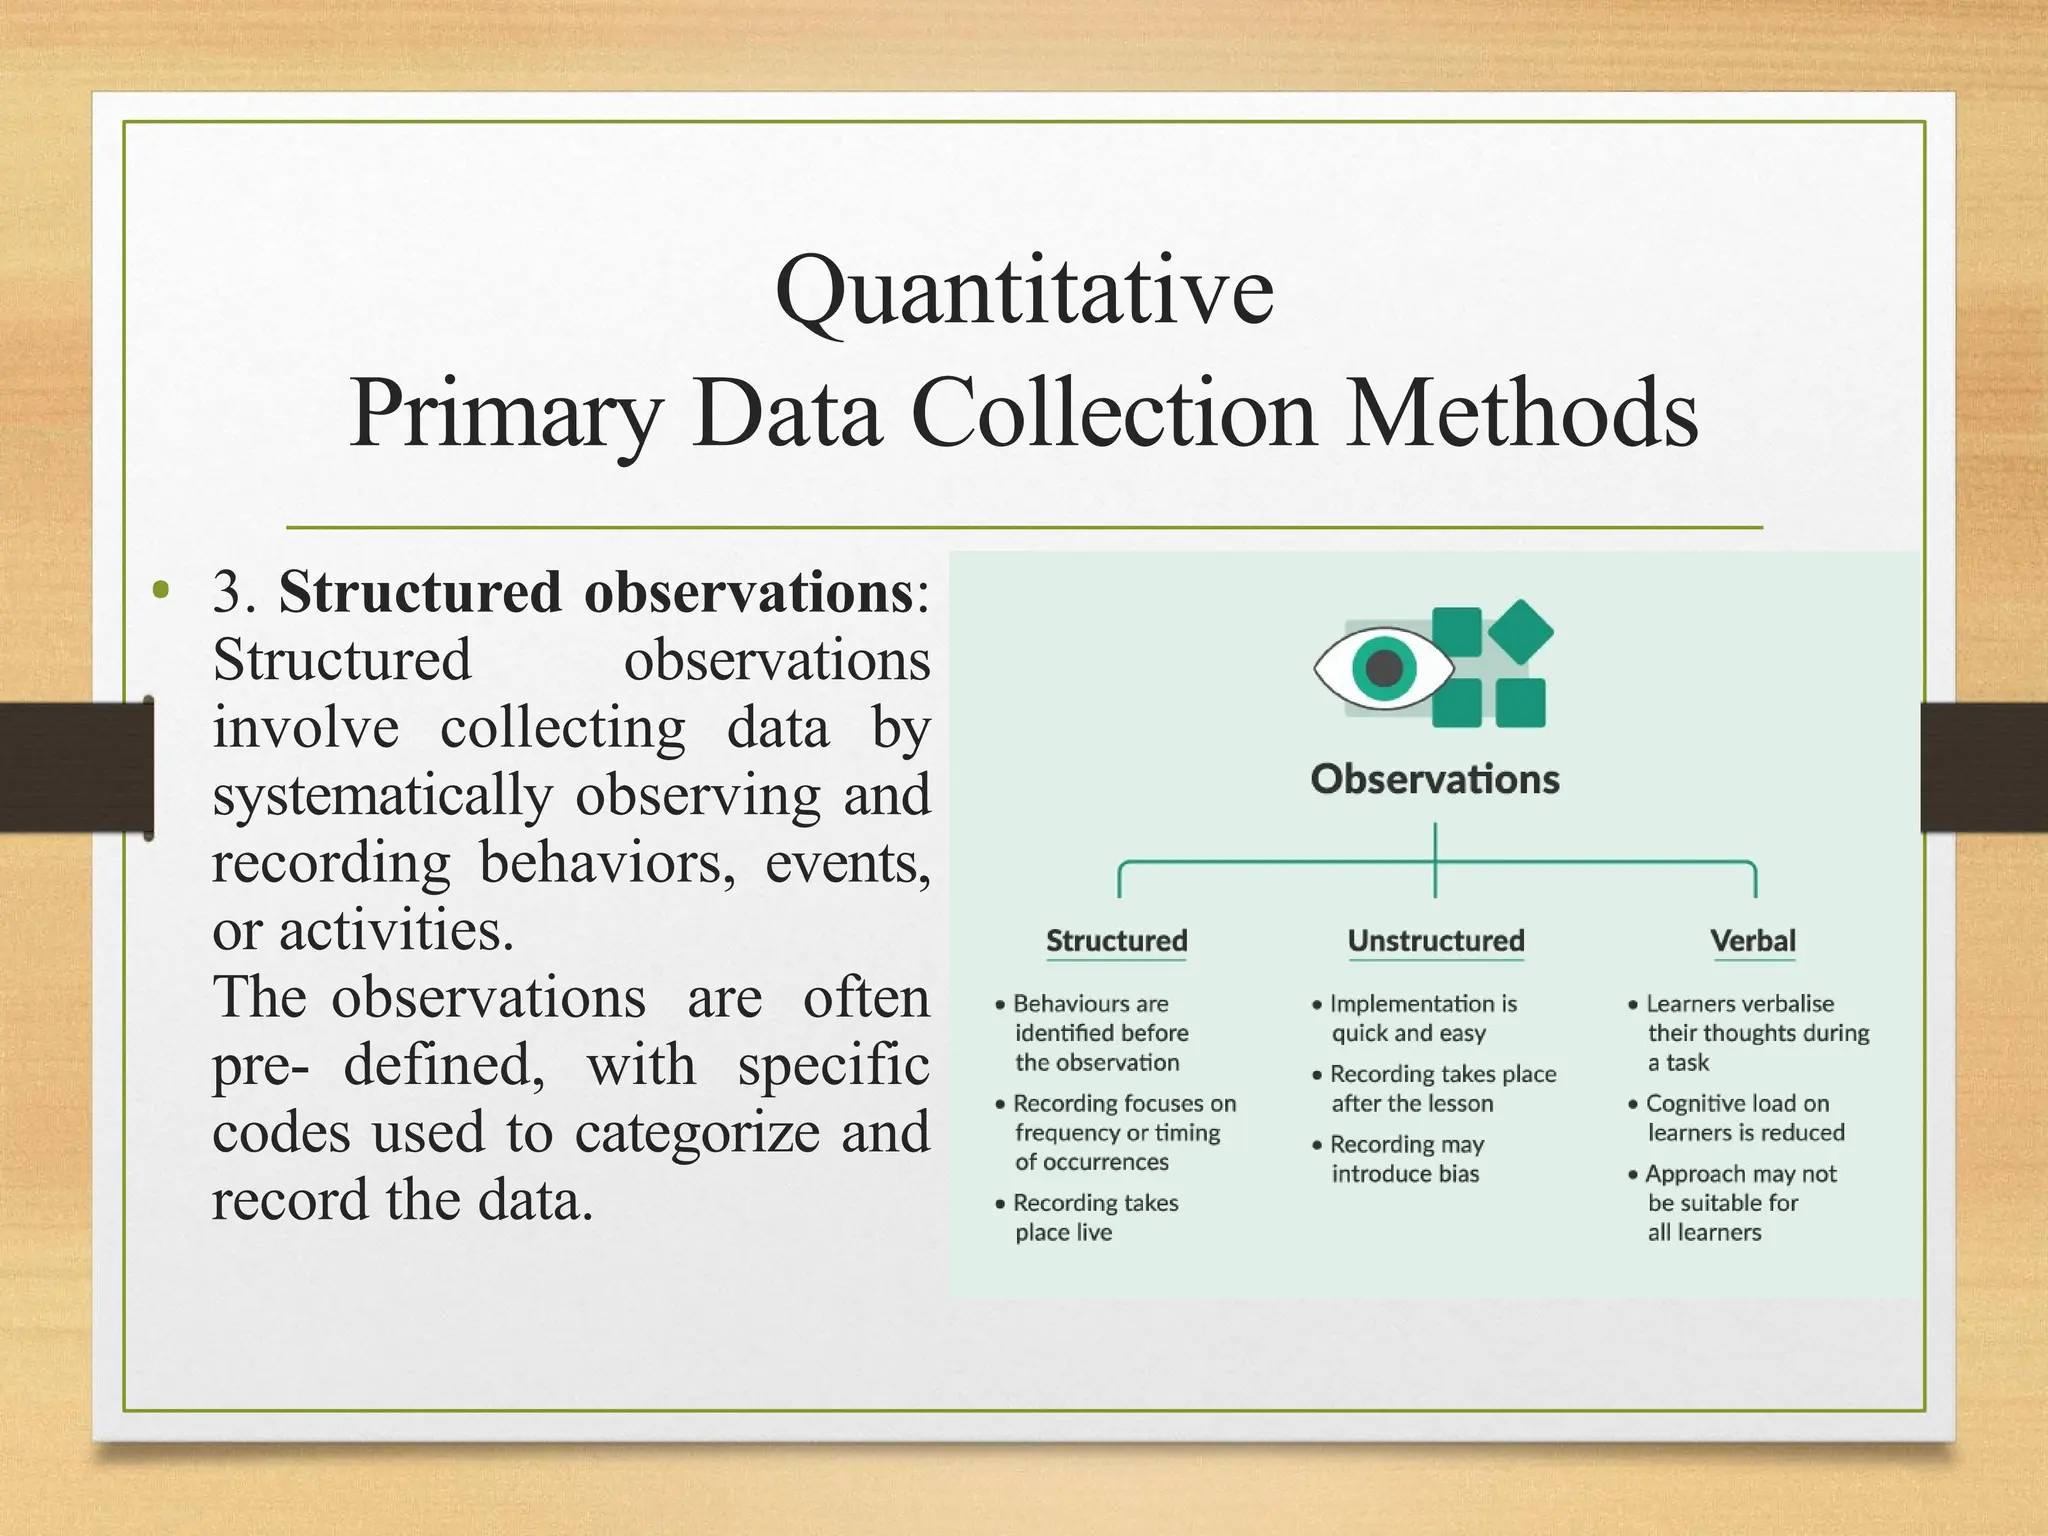
• 3. Structured observations:
Structured observations
involve collecting data by
systematically observing and
recording behaviors, events,
or activities.
The observations are often
pre- defined, with specific
codes used to categorize and
record the data.
13.
Quantitative
Primary Data CollectionMethods
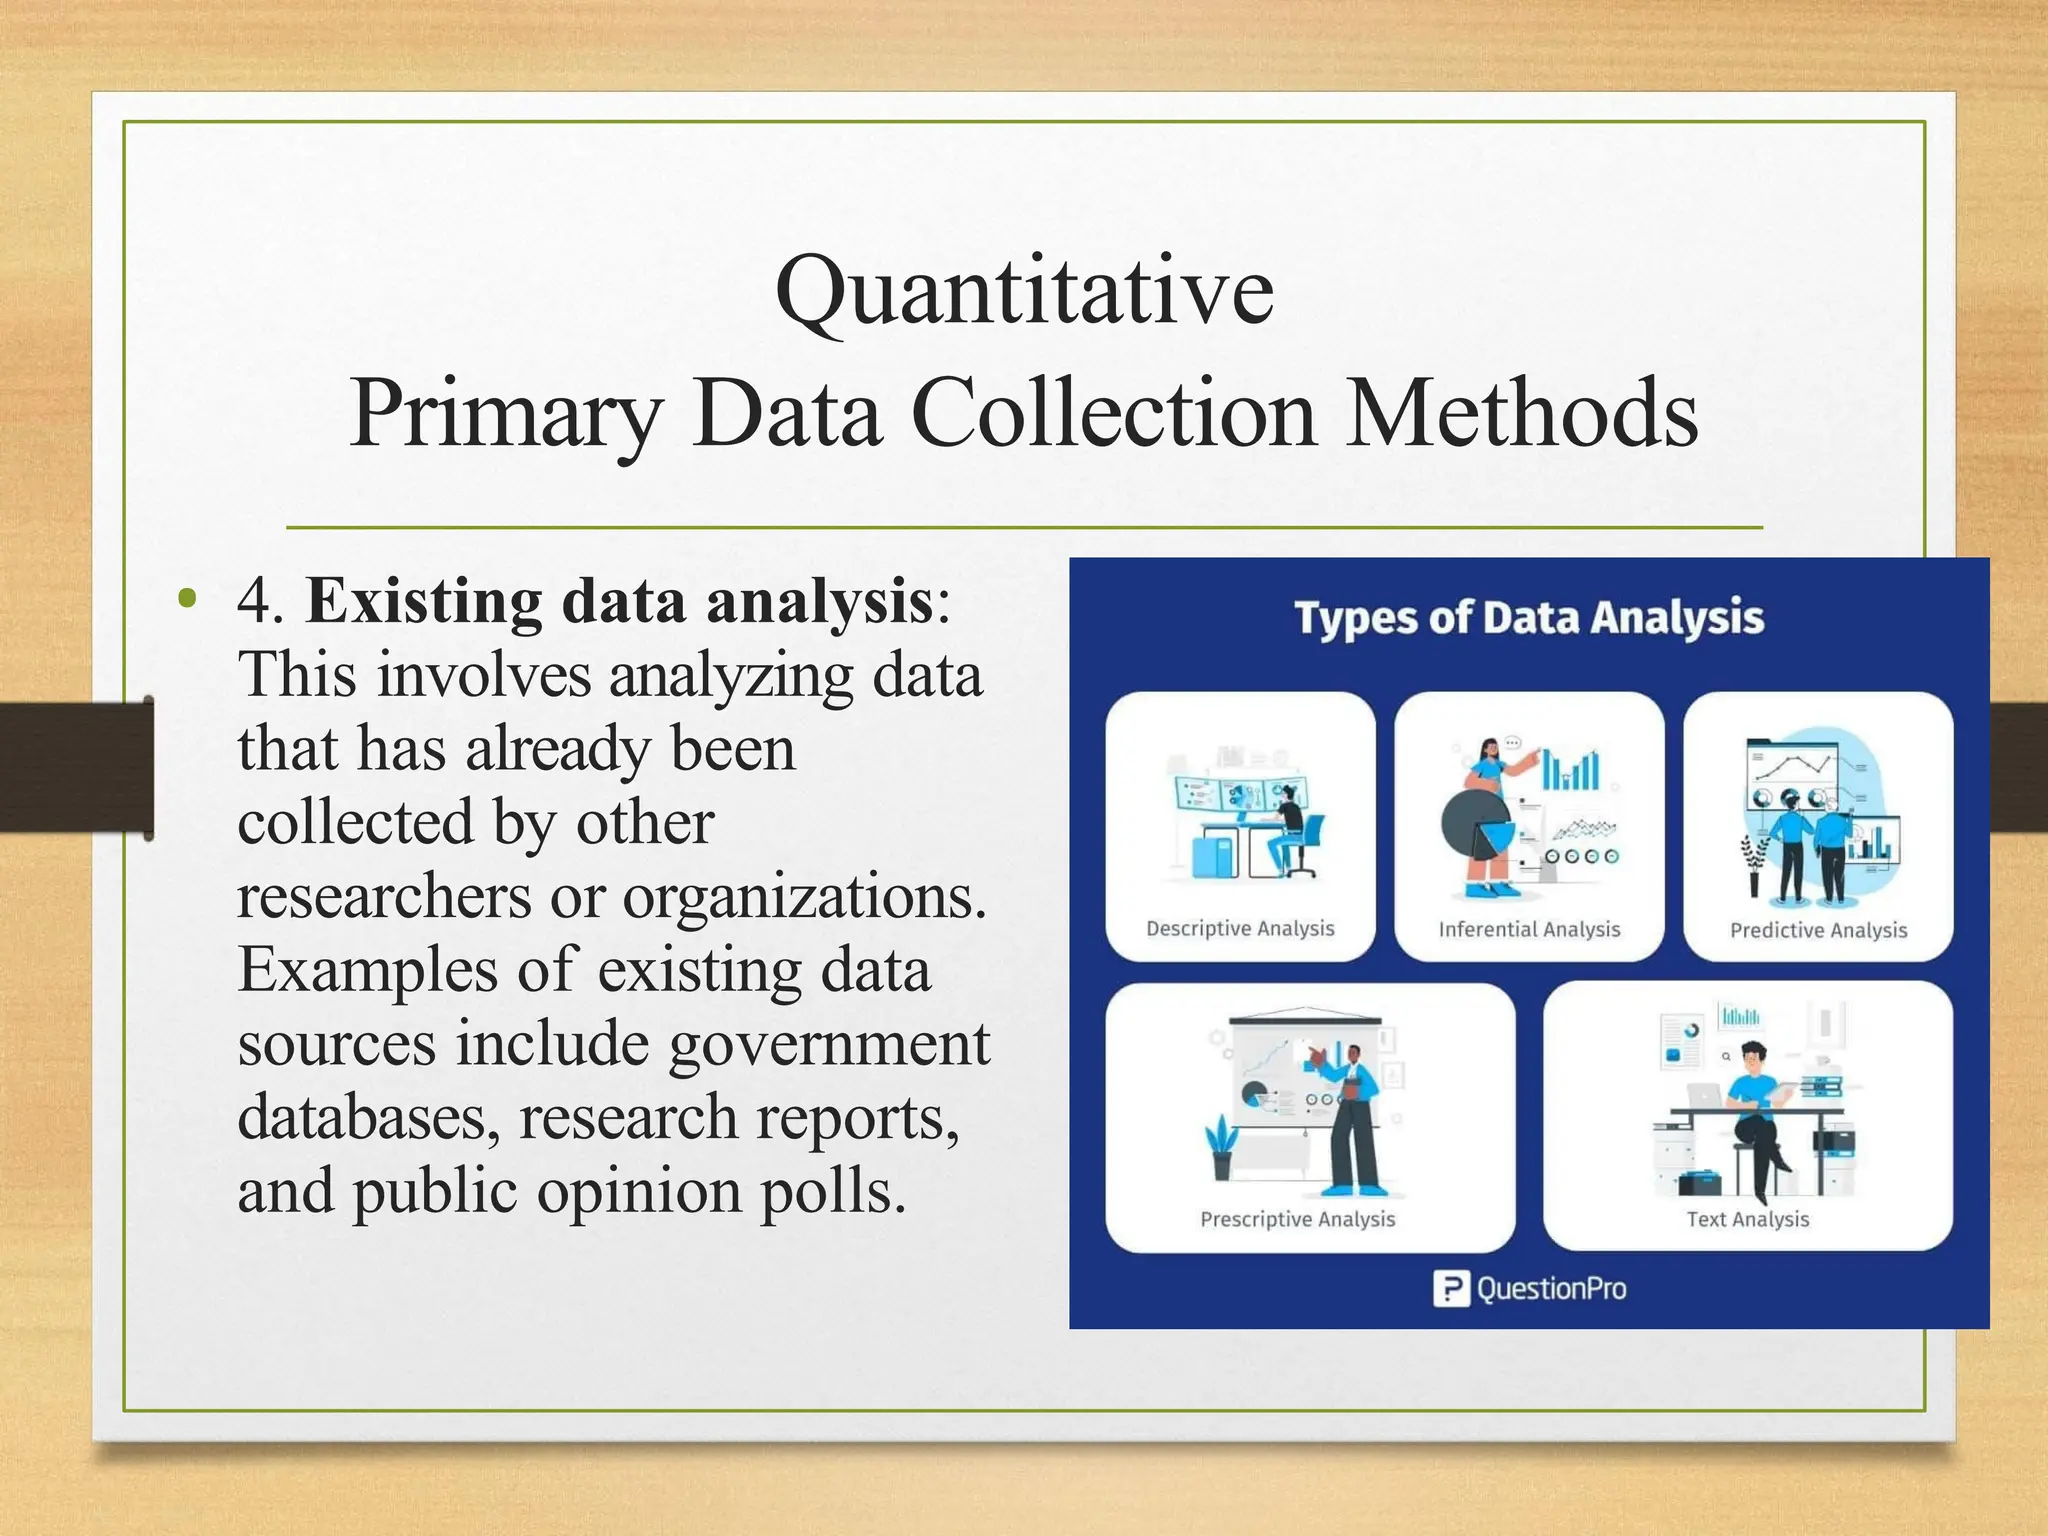
• 4. Existing data analysis:
This involves analyzing data
that has already been
collected by other
researchers or organizations.
Examples of existing data
sources include government
databases, research reports,
and public opinion polls.
14.
Quantitative
Primary Data CollectionMethods
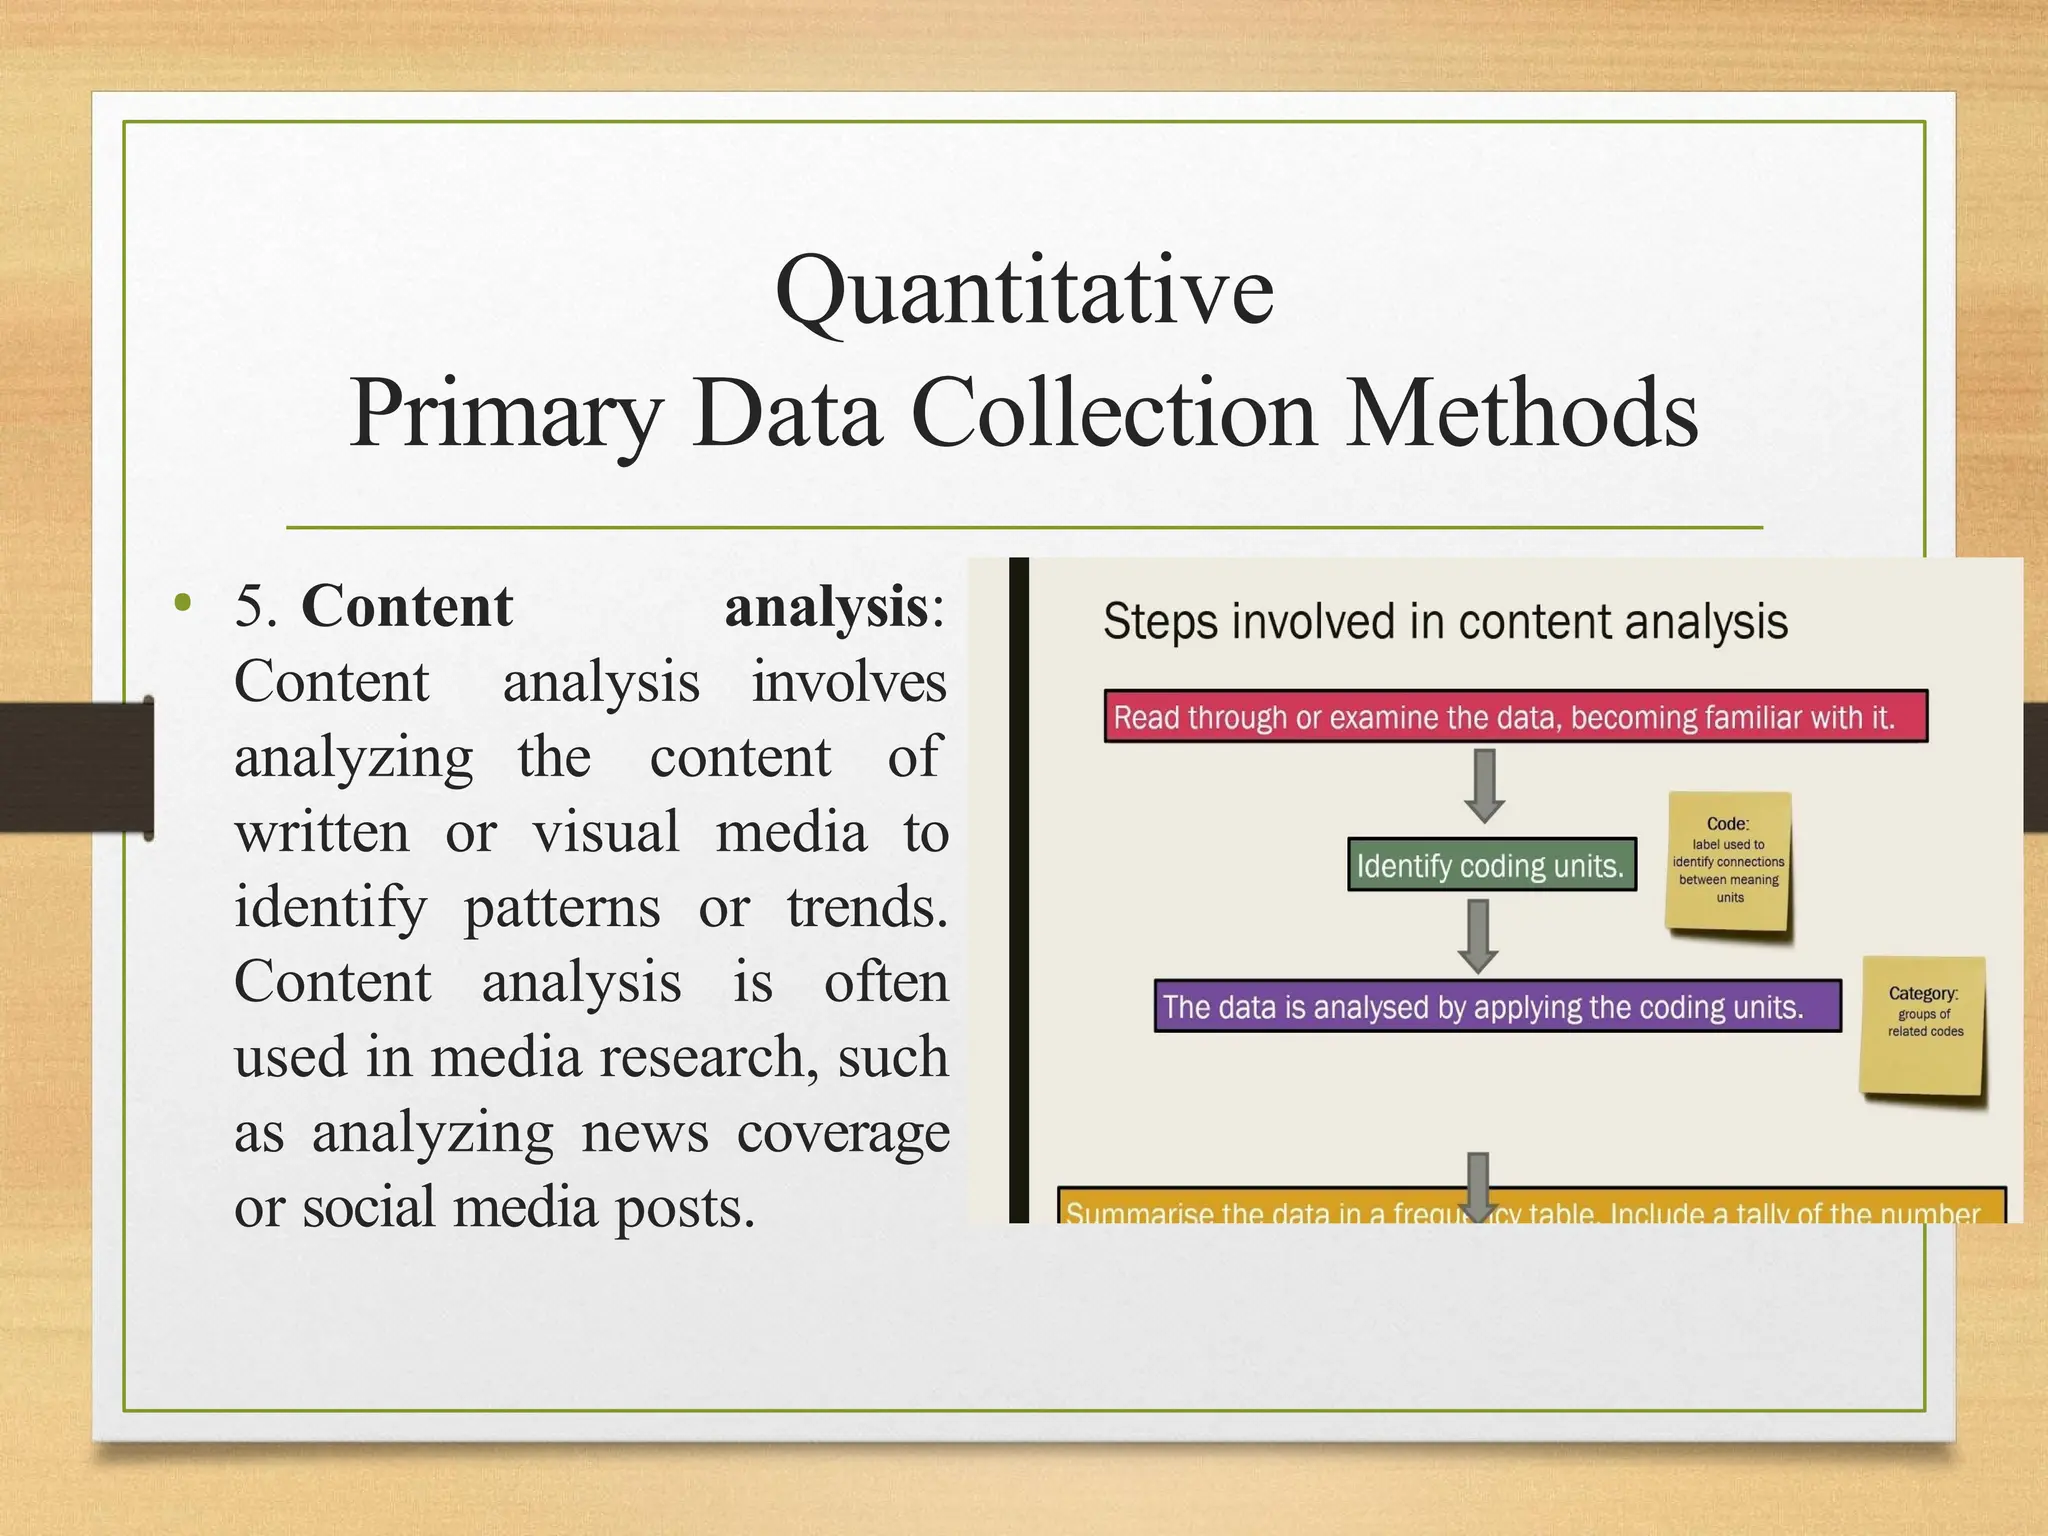
• 5. Content analysis:
involves
Content analysis
analyzing the content of
written or visual media to
identify patterns or trends.
Content analysis is often
used in media research, such
as analyzing news coverage
or social media posts.
15.
Quantitative
Primary Data CollectionMethods
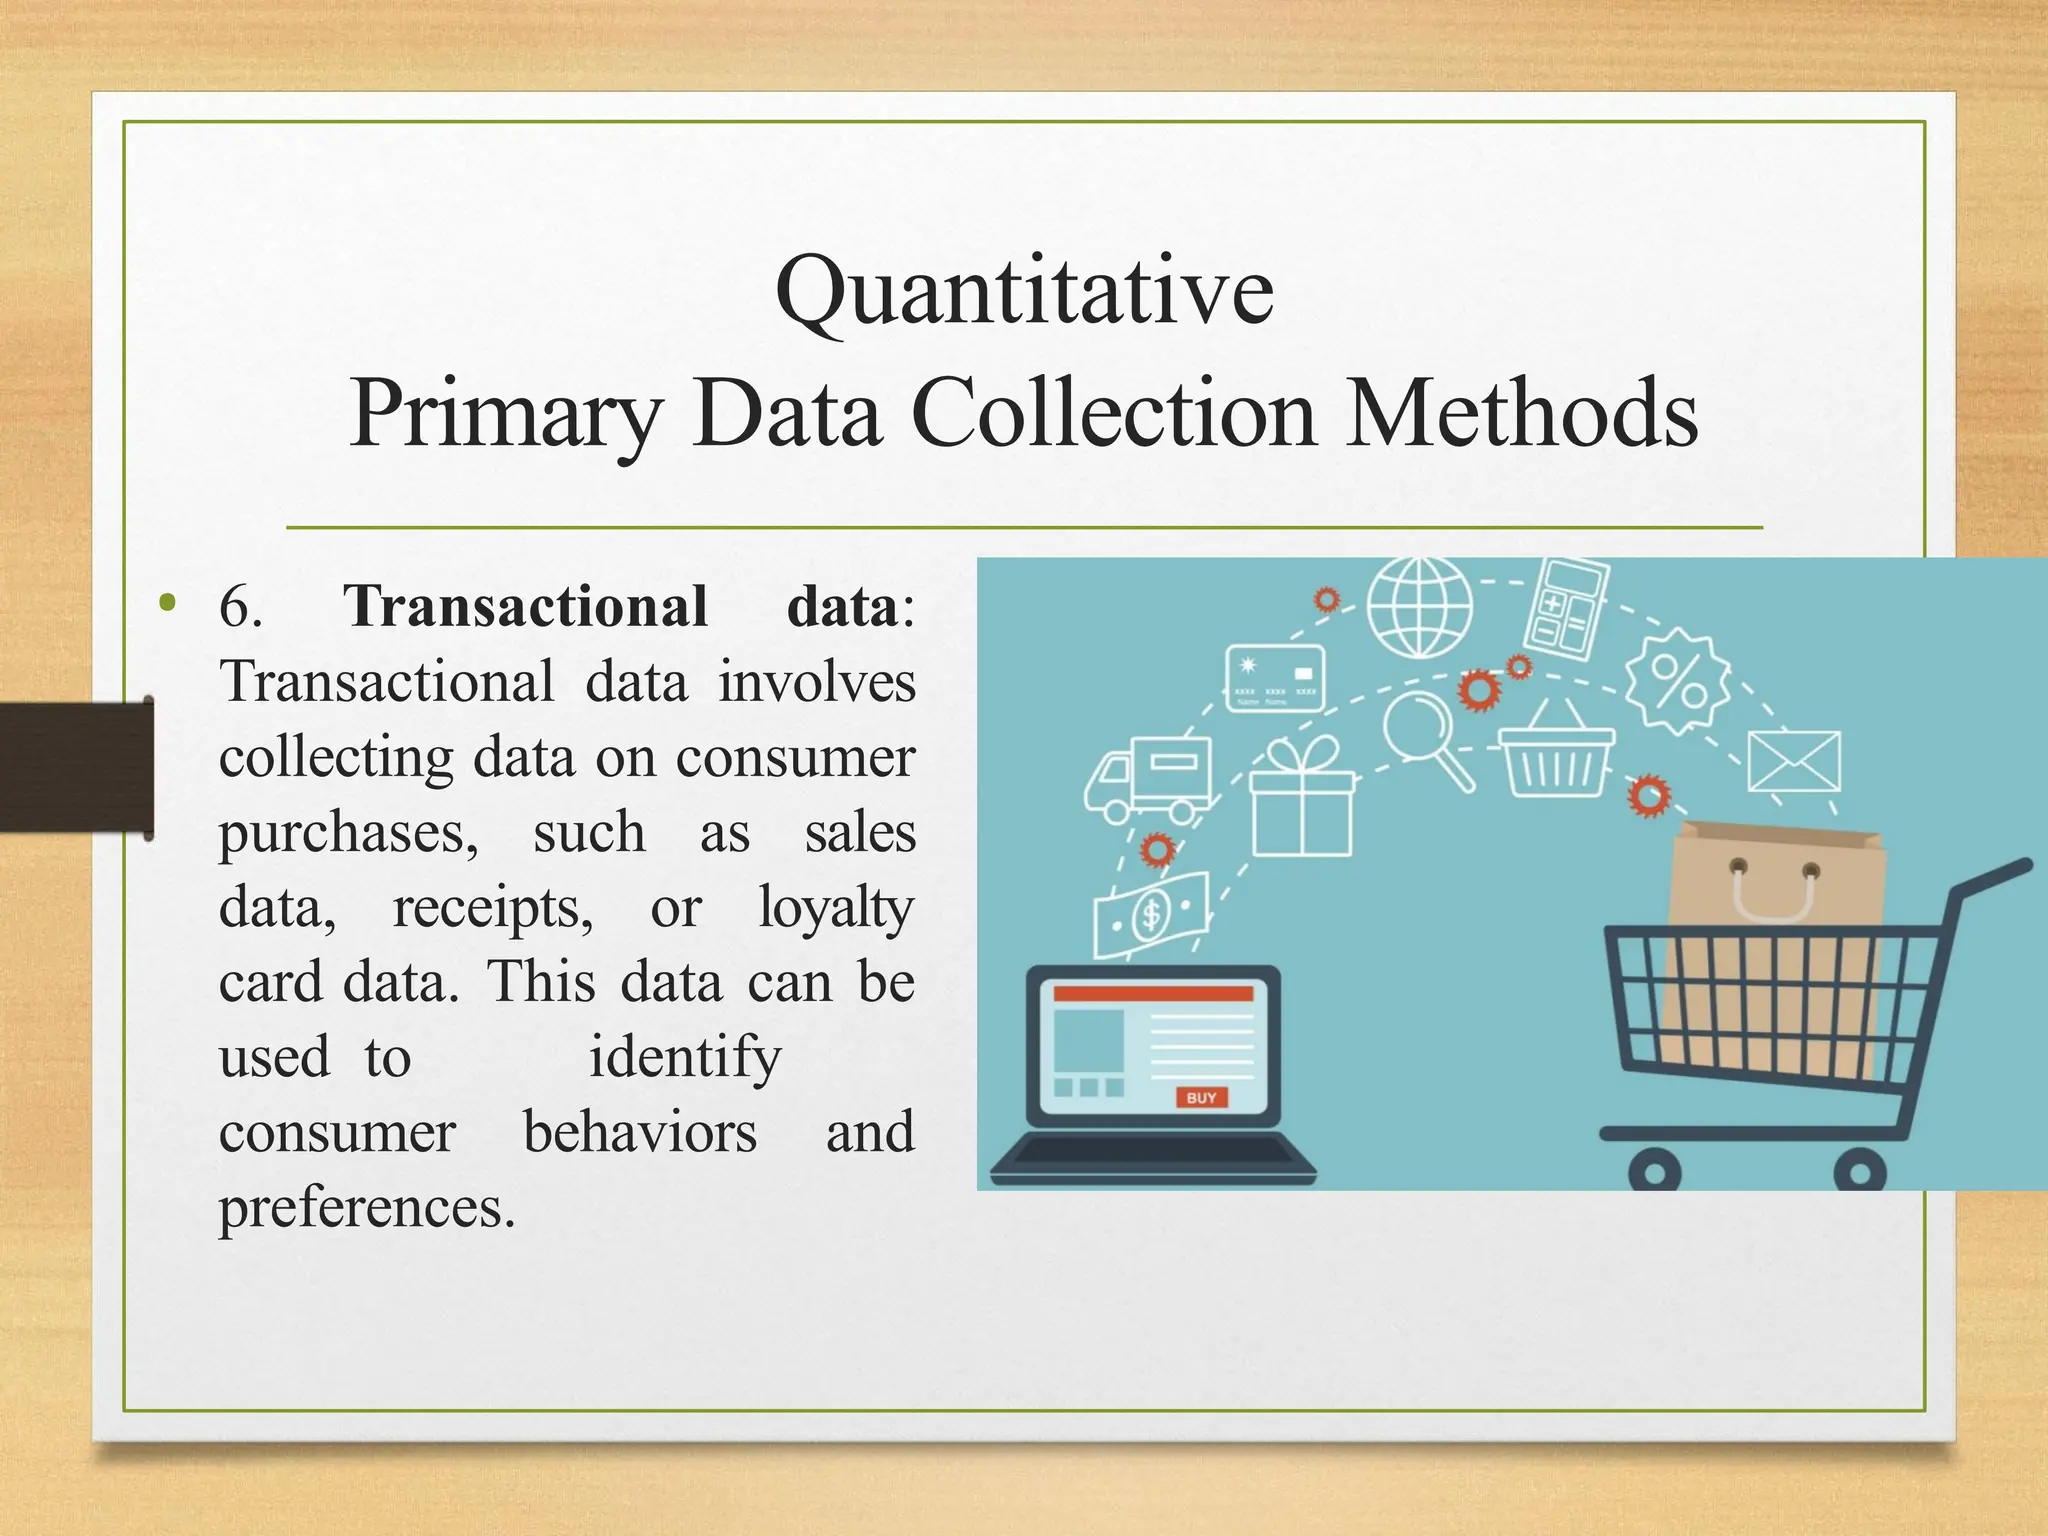
• 6. Transactional data:
Transactional data involves
collecting data on consumer
purchases, such as sales
data, receipts, or loyalty
card data. This data can be
used to identify
consumer behaviors and
preferences.
16.
Quantitative
Primary Data CollectionMethods
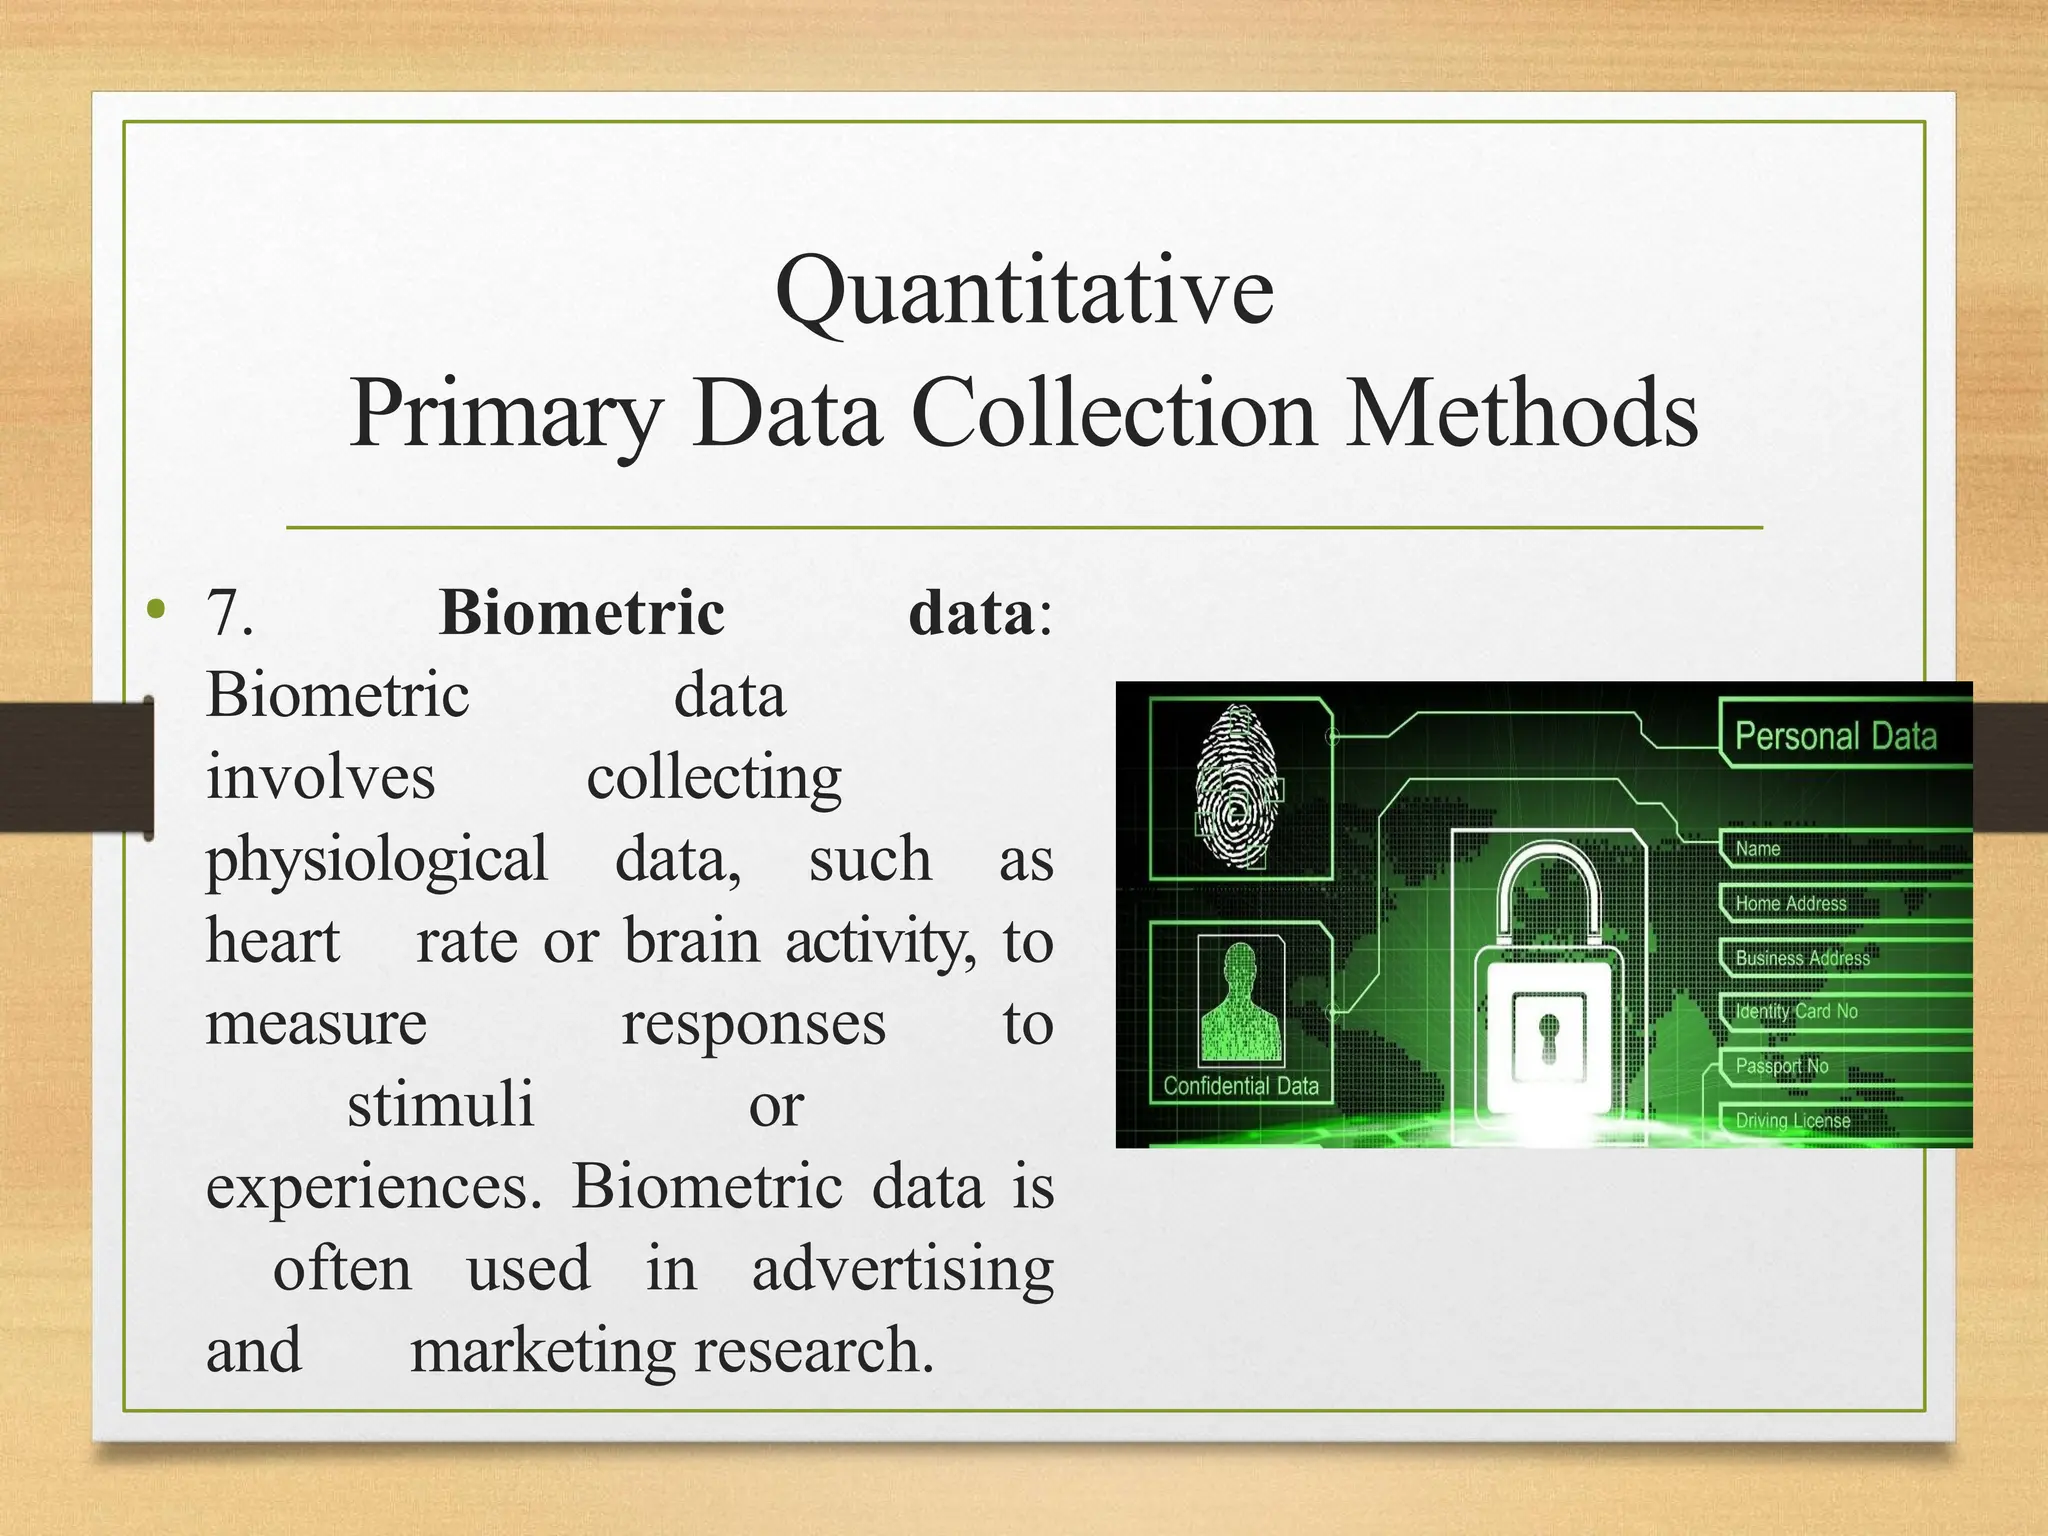
• 7. Biometric data:
Biometric data
involves collecting
physiological data, such as
heart rate or brain activity, to
measure responses to
stimuli or
experiences. Biometric data is
often used in advertising
and marketing research.
17.
Qualitative
Primary Data CollectionMethods
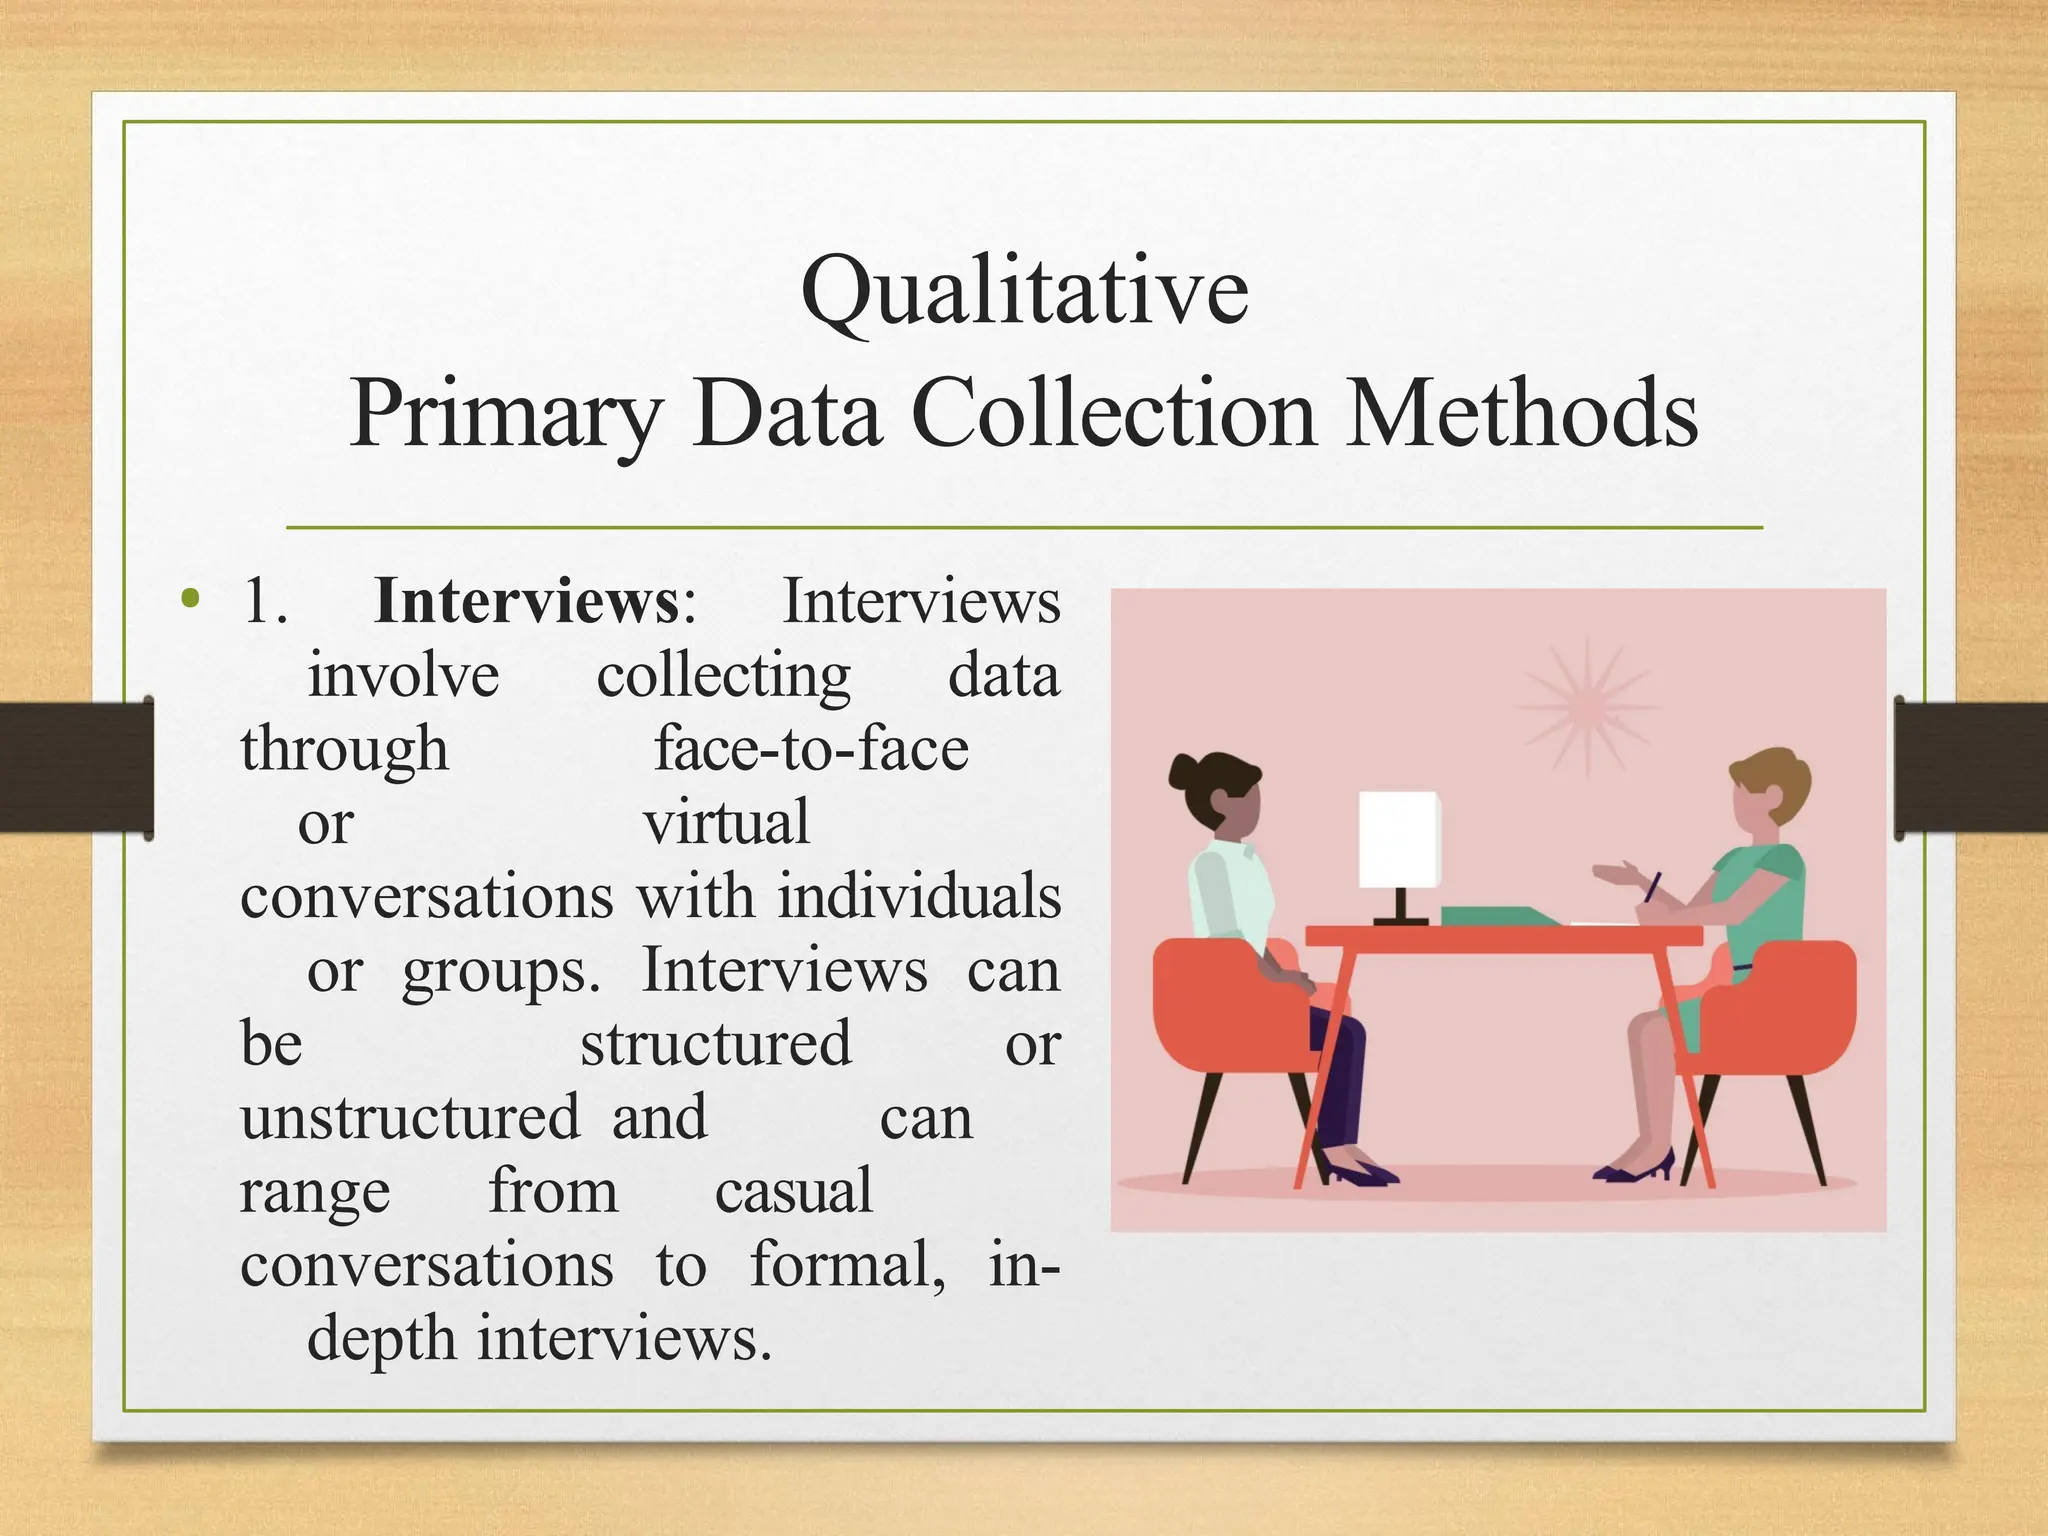
• 1. Interviews: Interviews
involve collecting data
through face-to-face
or virtual
conversations with individuals
or groups. Interviews can
be structured or
unstructured and can
range from casual
conversations to formal, in-
depth interviews.
18.
Qualitative
Primary Data CollectionMethods
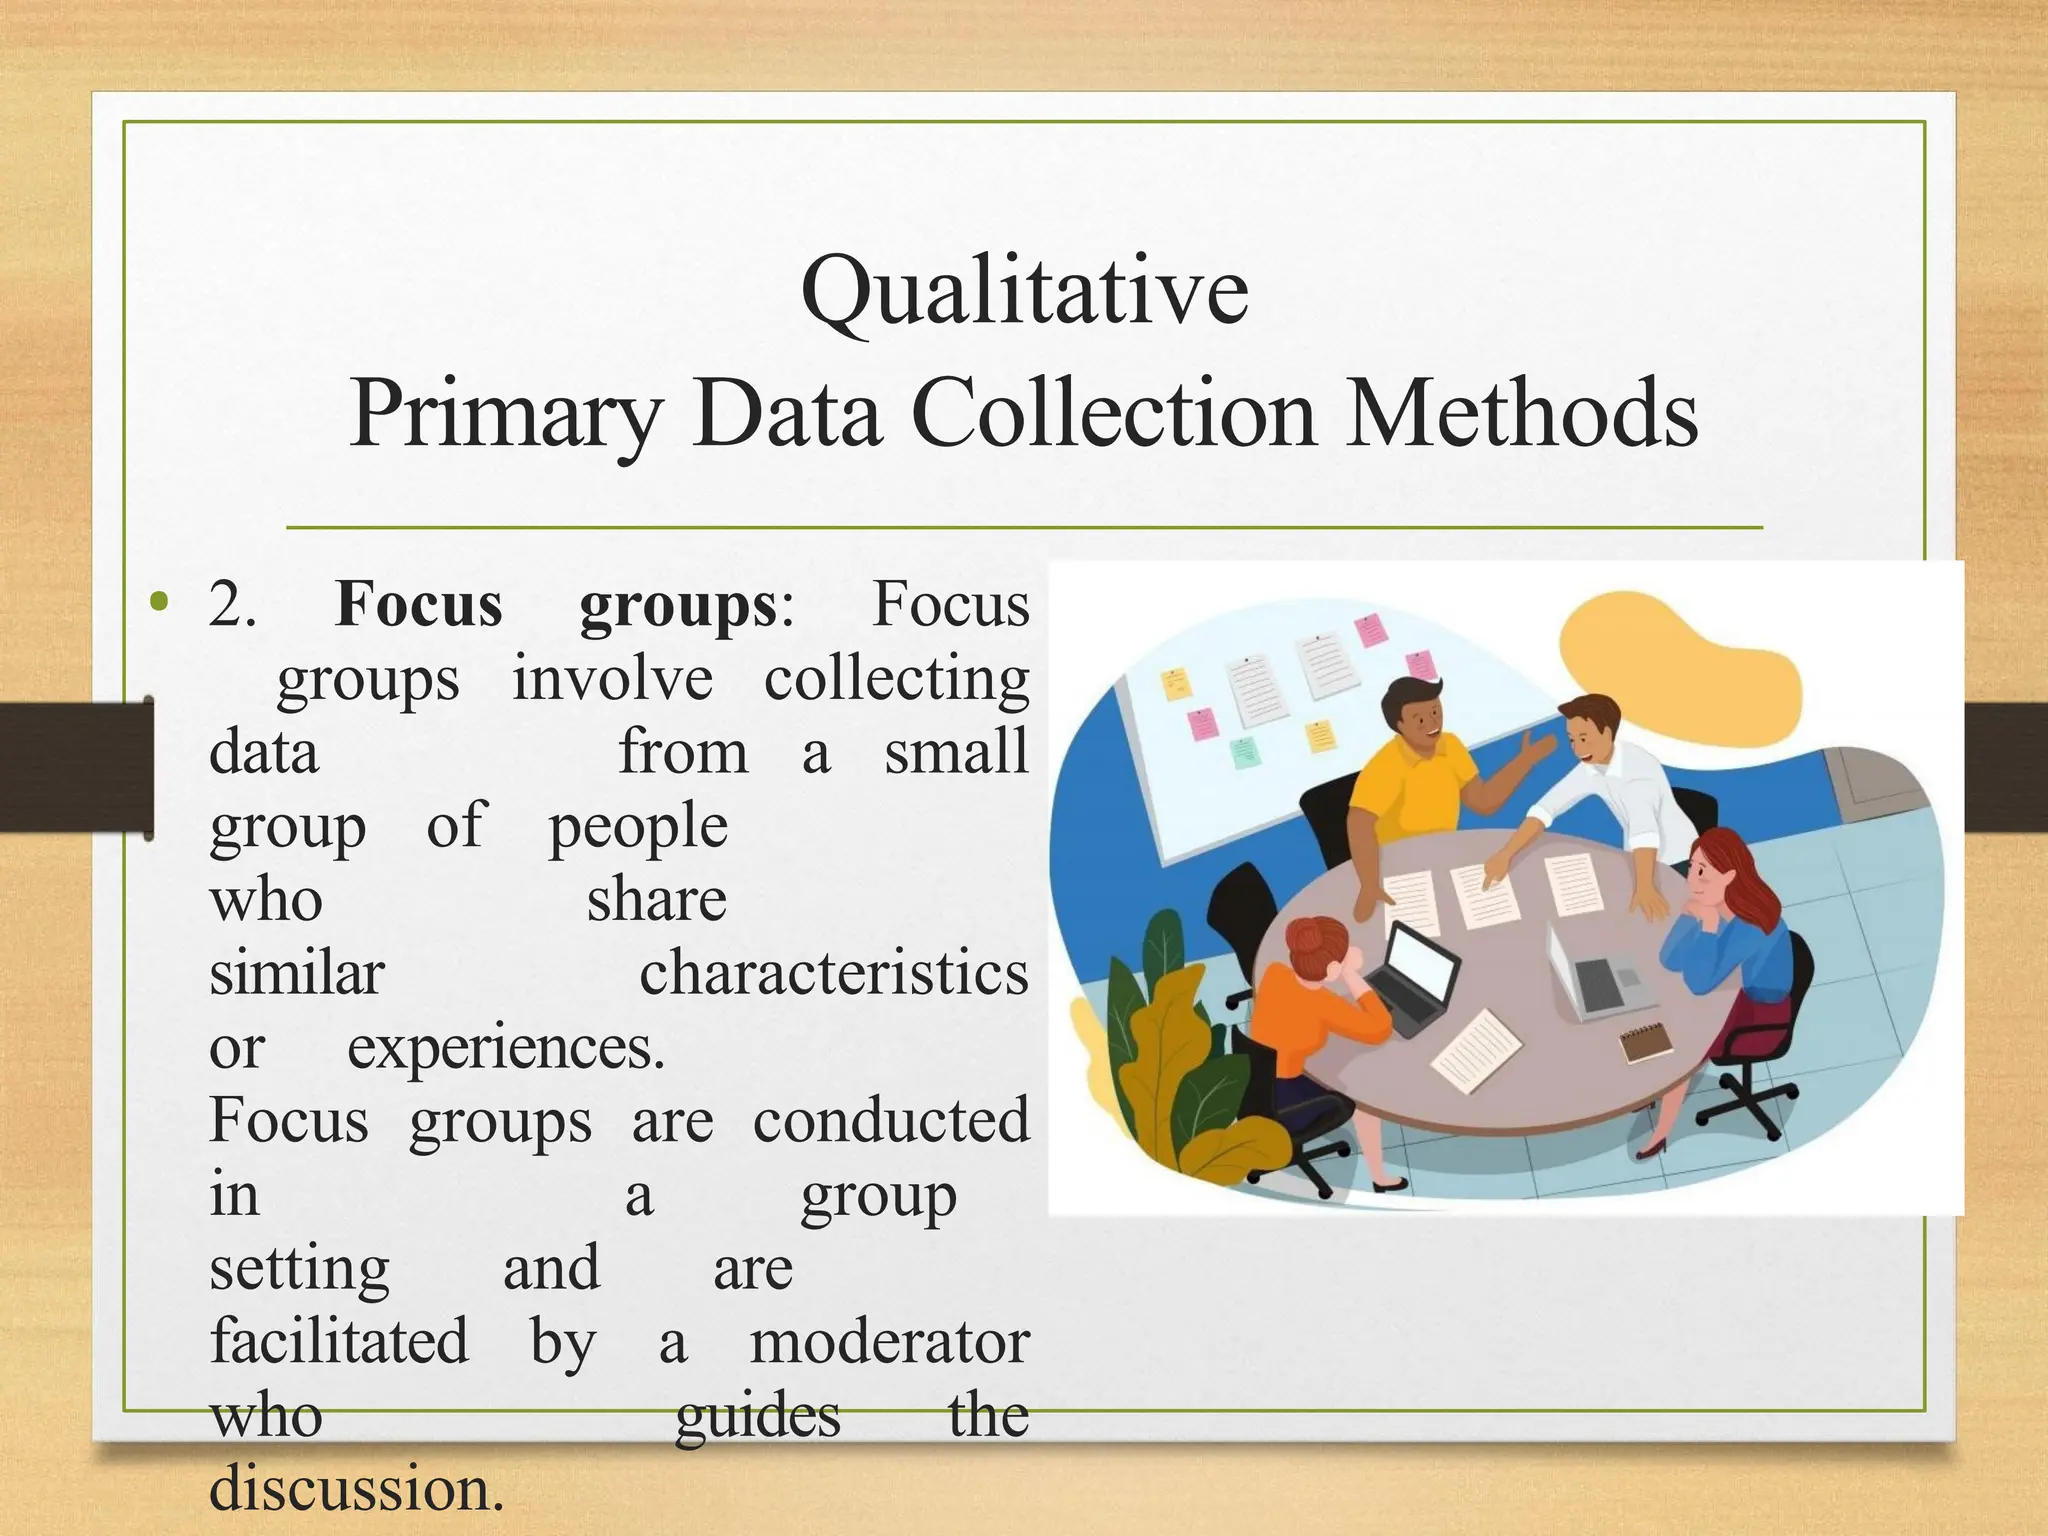
• 2. Focus groups: Focus
groups involve collecting
data from a small
group of people
who share
similar characteristics
or experiences.
Focus groups are conducted
in a group
setting and are
facilitated by a moderator
who guides the
discussion.
19.
Qualitative
Primary Data CollectionMethods
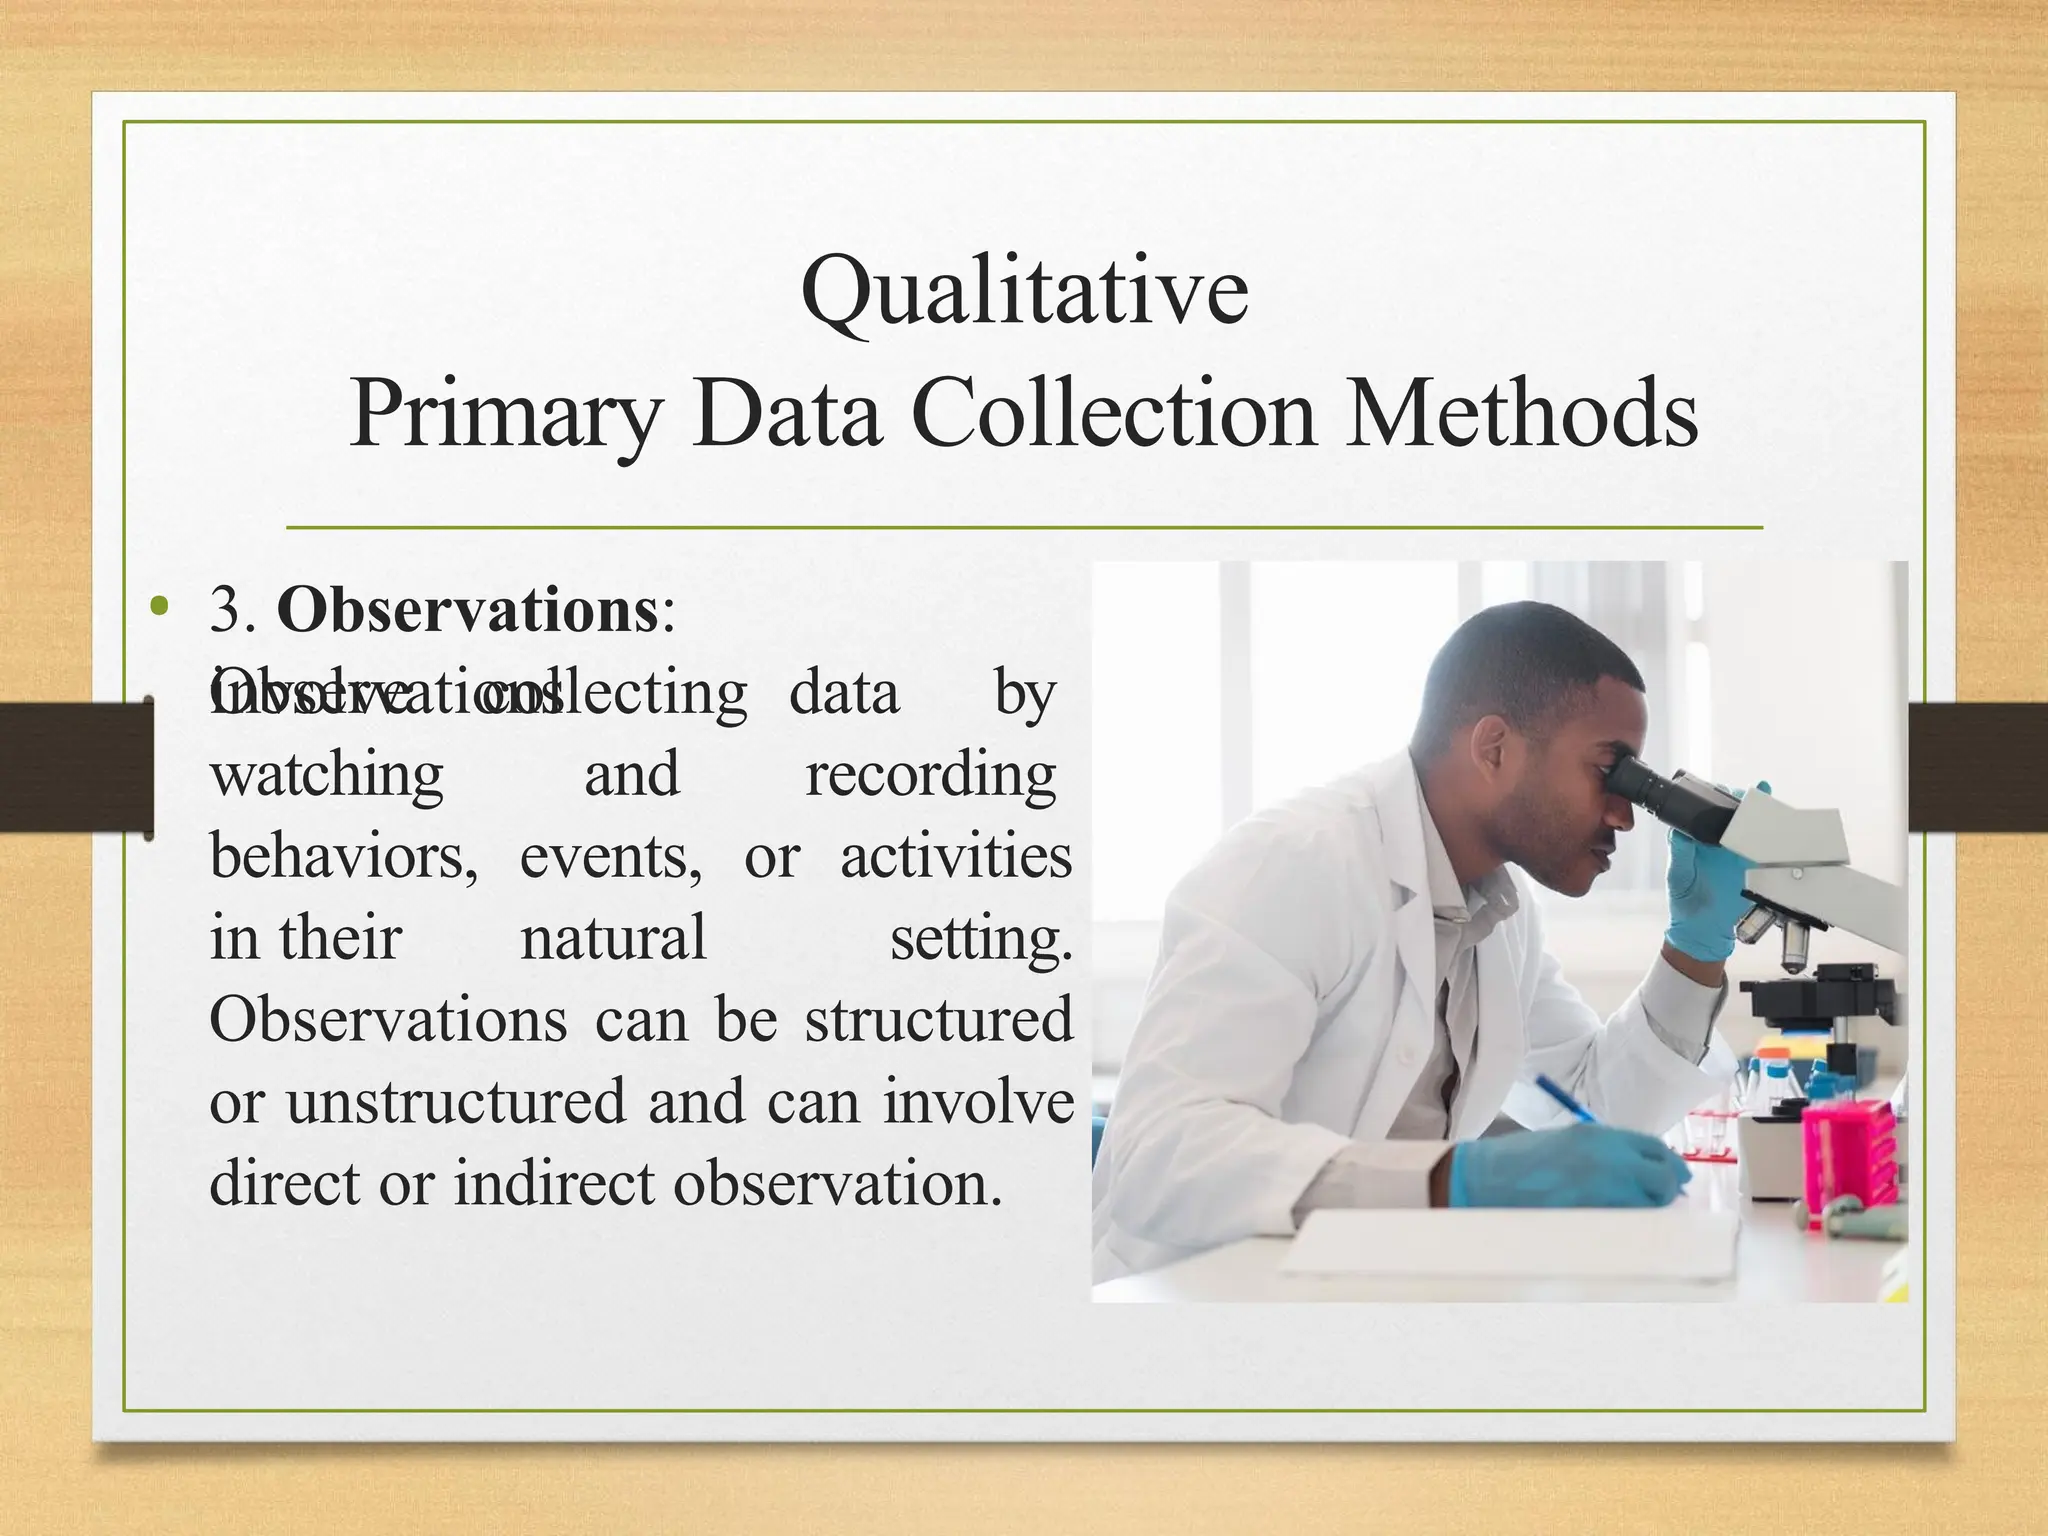
• 3. Observations:
Observations
involve
watching
collecting data by
and recording
behaviors, events, or activities
in their natural setting.
Observations can be structured
or unstructured and can involve
direct or indirect observation.
20.
Qualitative
Primary Data CollectionMethods
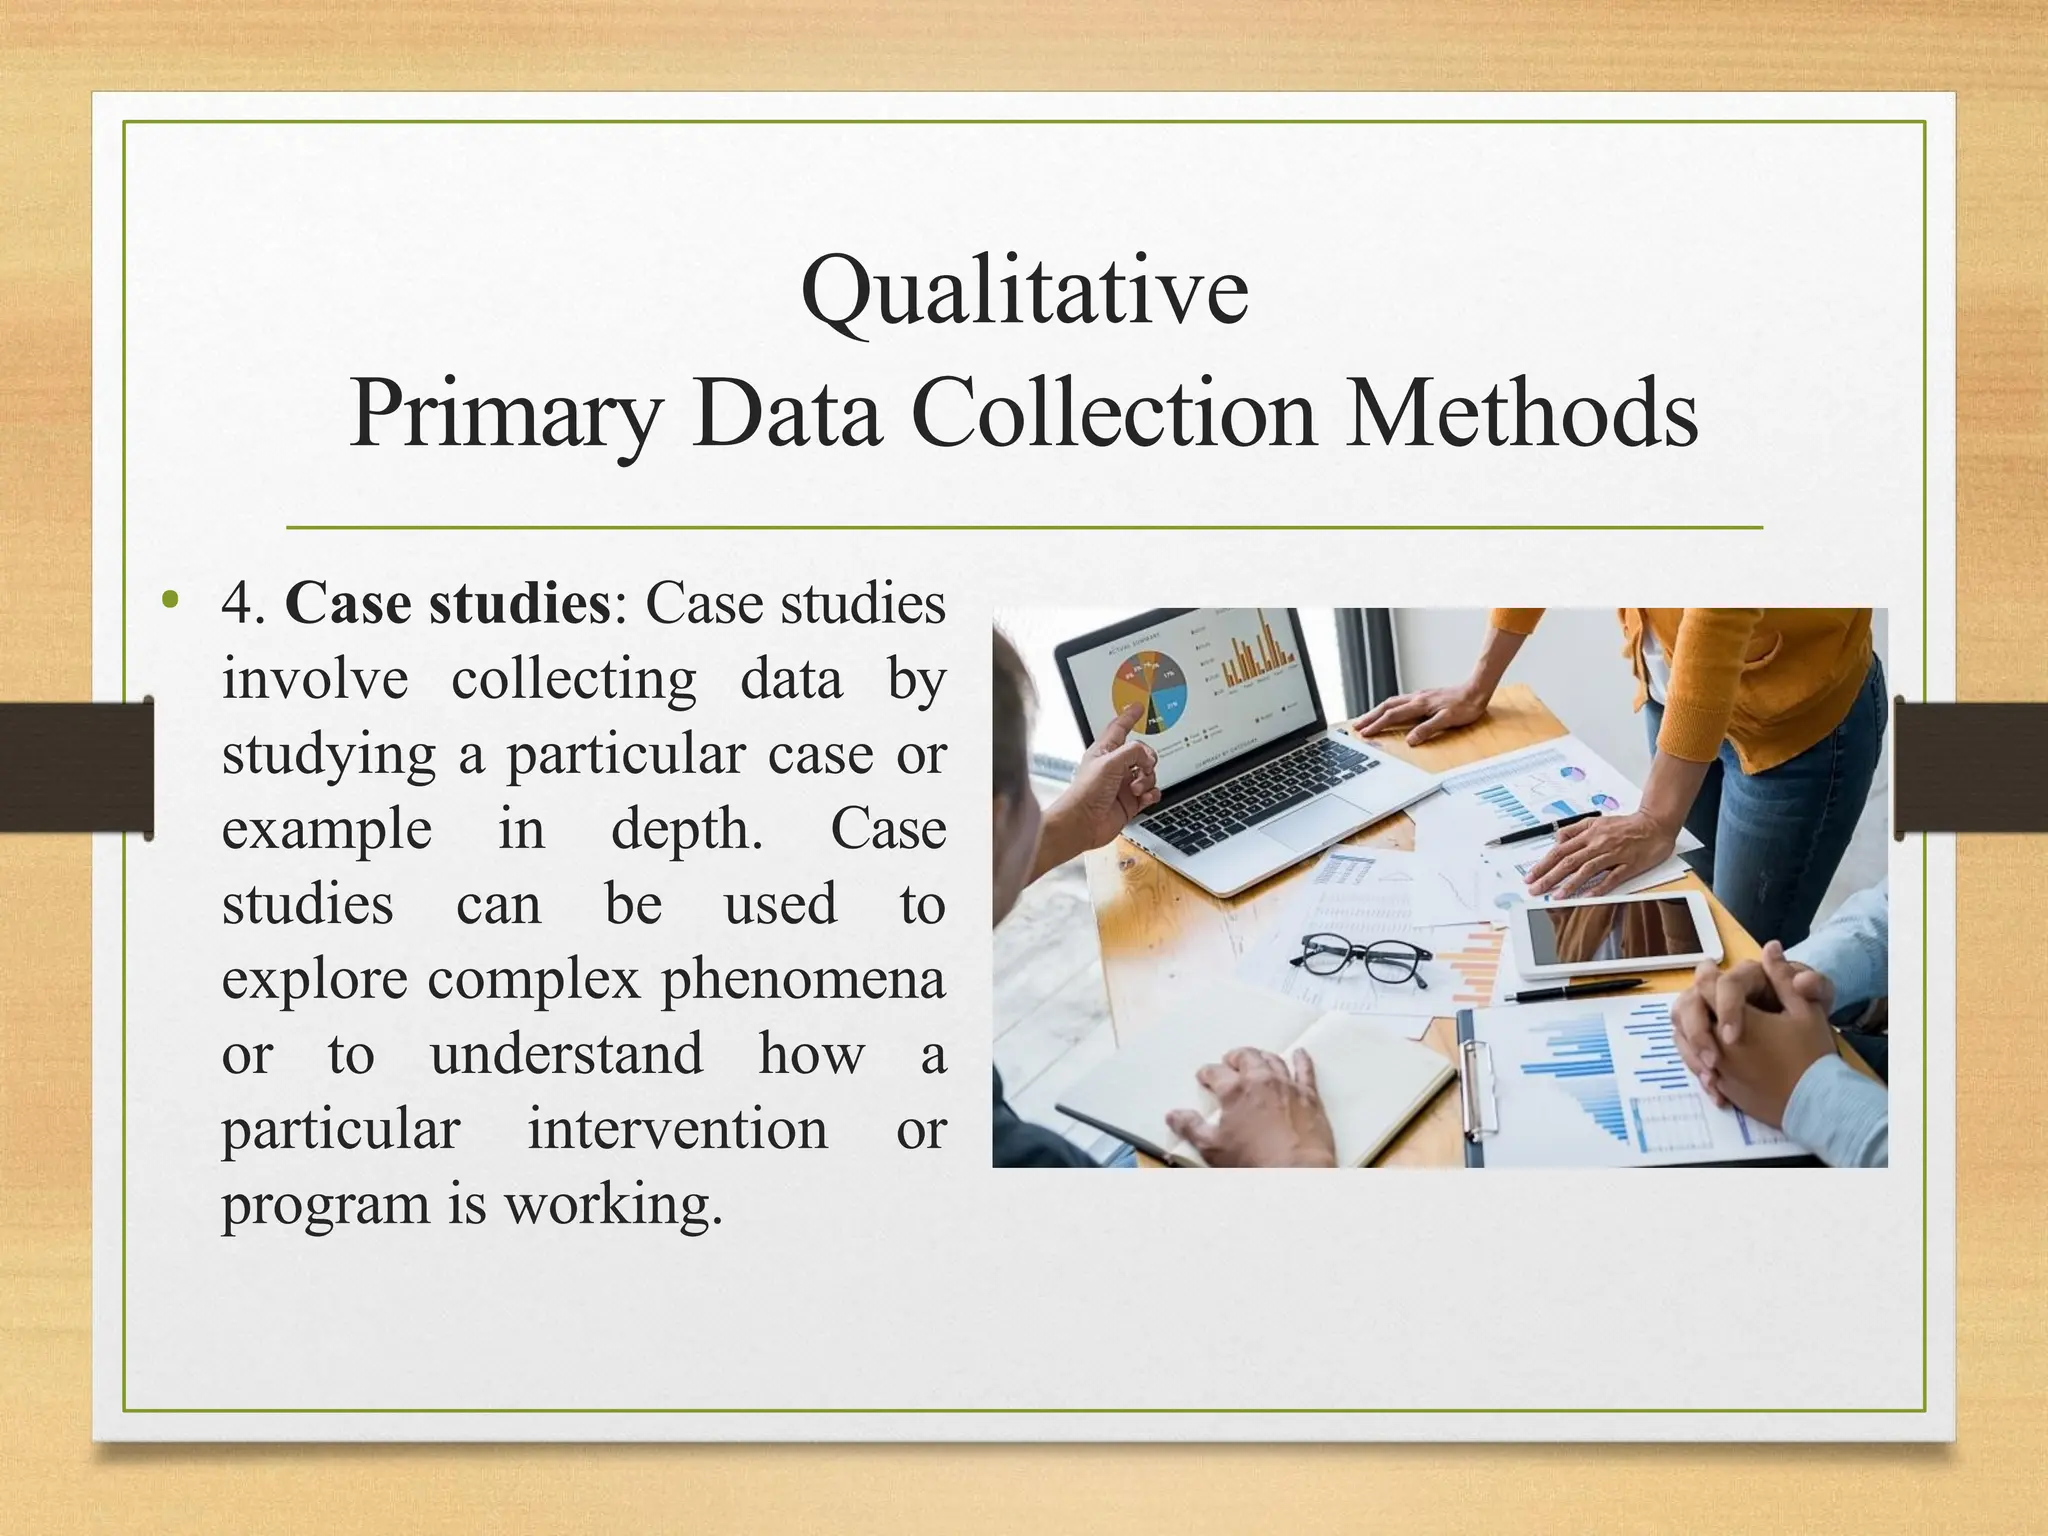
• 4. Case studies: Case studies
involve collecting data by
studying a particular case or
example in depth. Case
studies can be used to
explore complex phenomena
or to understand how a
particular intervention or
program is working.
21.
Qualitative
Primary Data CollectionMethods
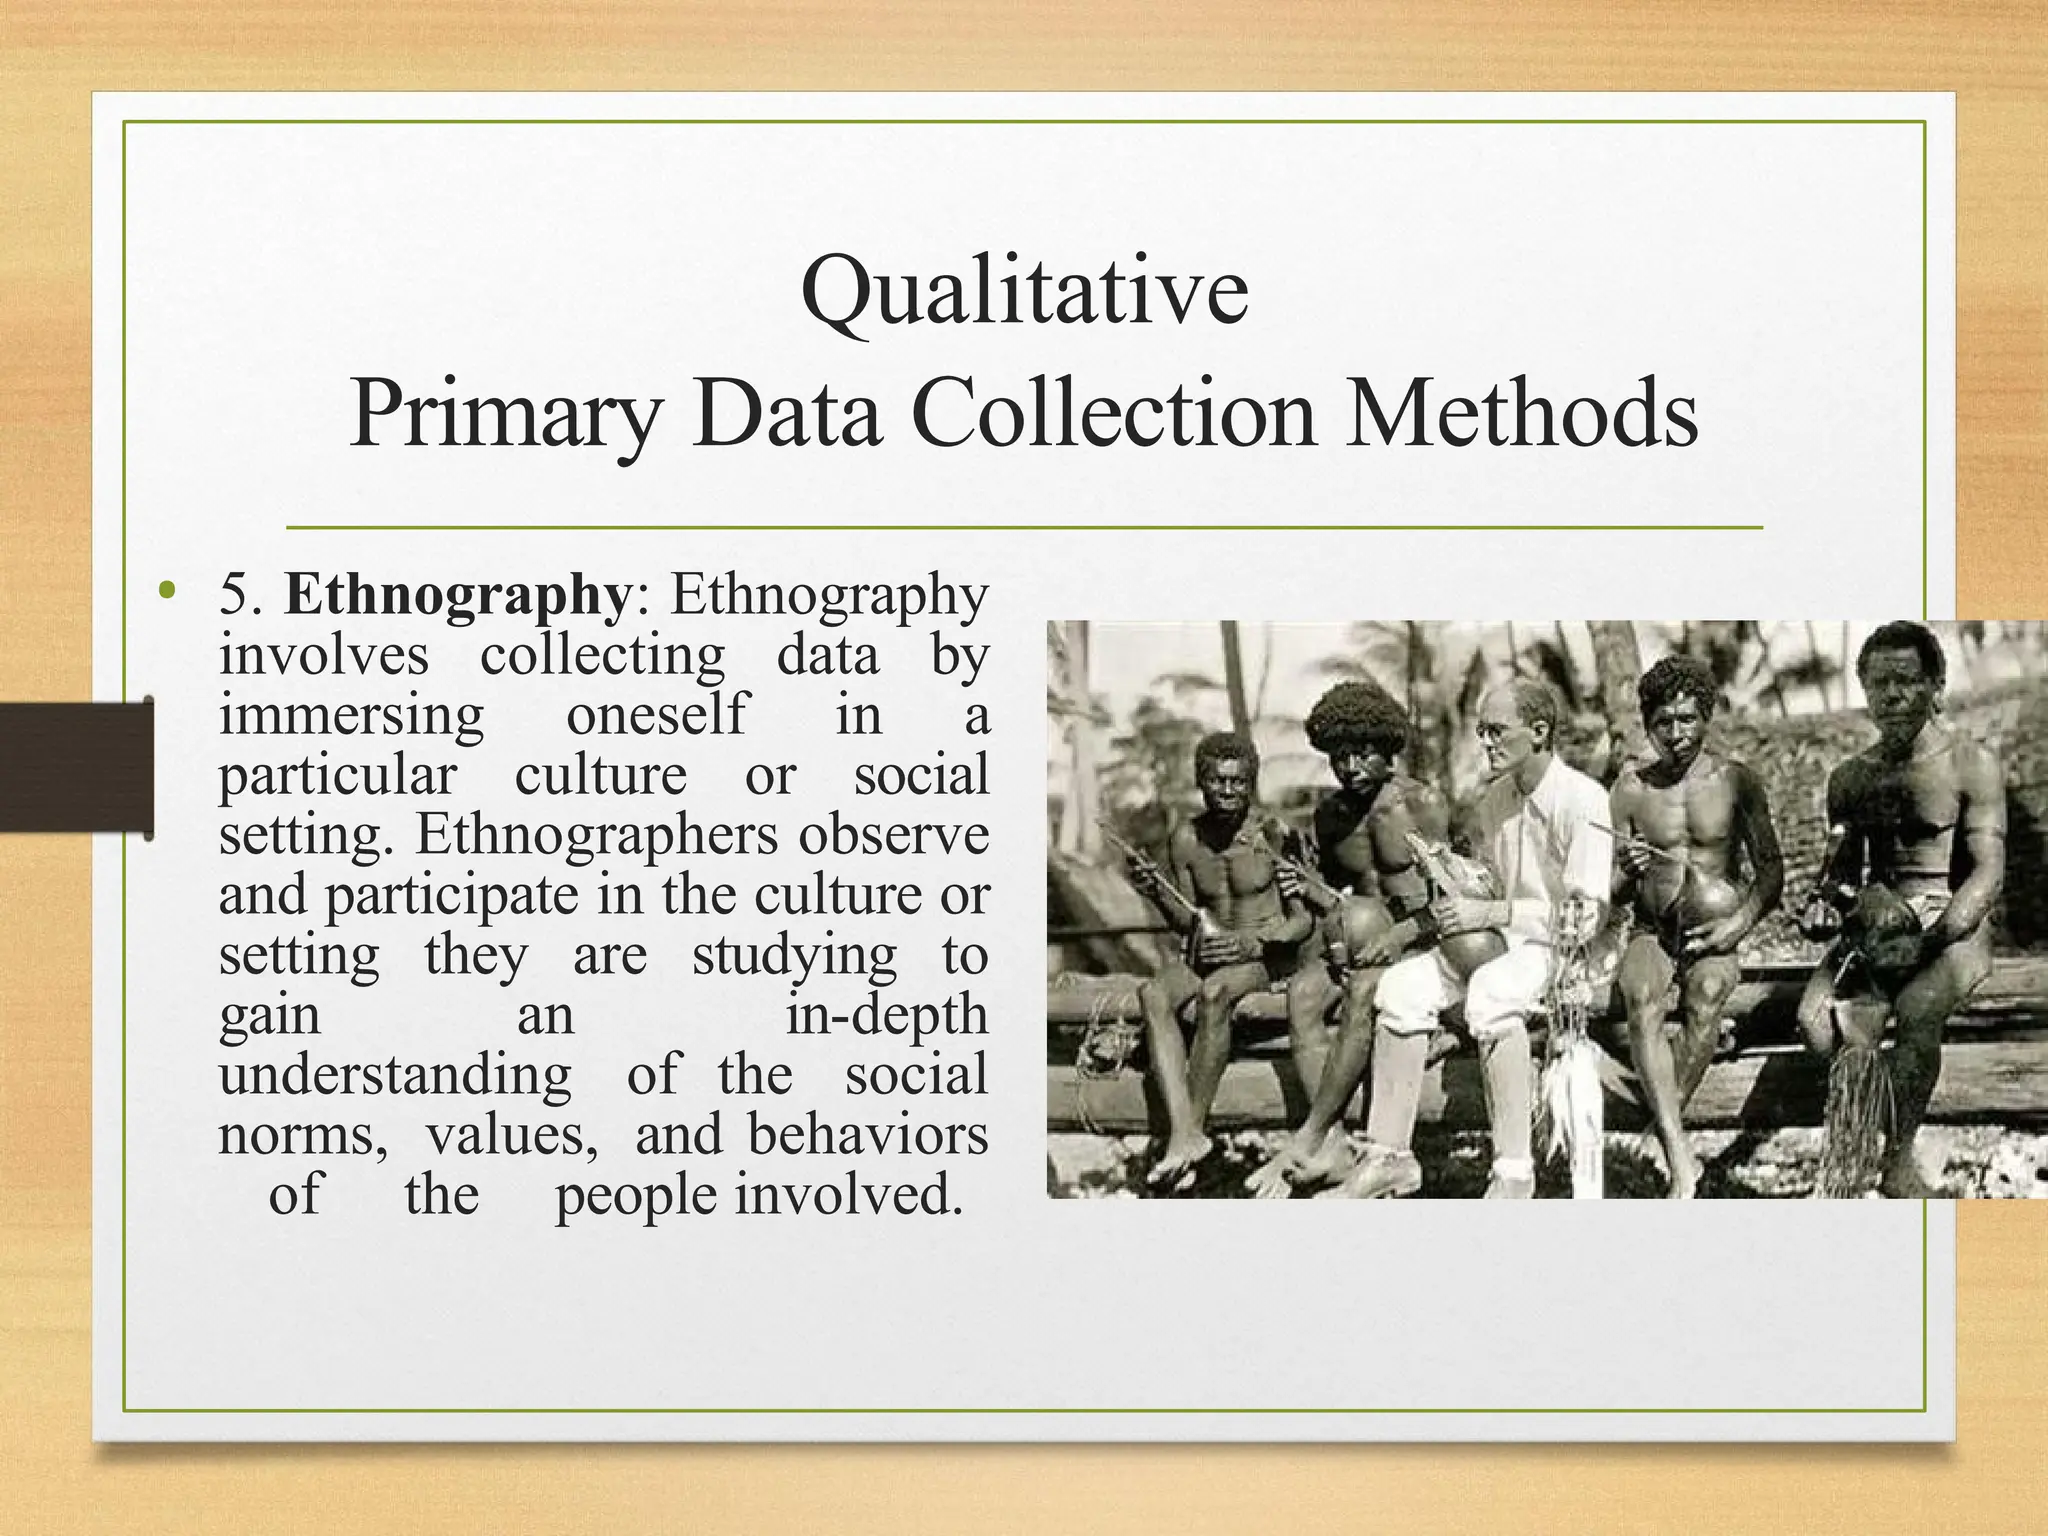
• 5. Ethnography: Ethnography
involves collecting data by
immersing oneself in a
particular culture or social
setting. Ethnographers observe
and participate in the culture or
setting they are studying to
gain an in-depth
understanding of the social
norms, values, and behaviors
of the people involved.
22.
Qualitative
Primary Data CollectionMethods
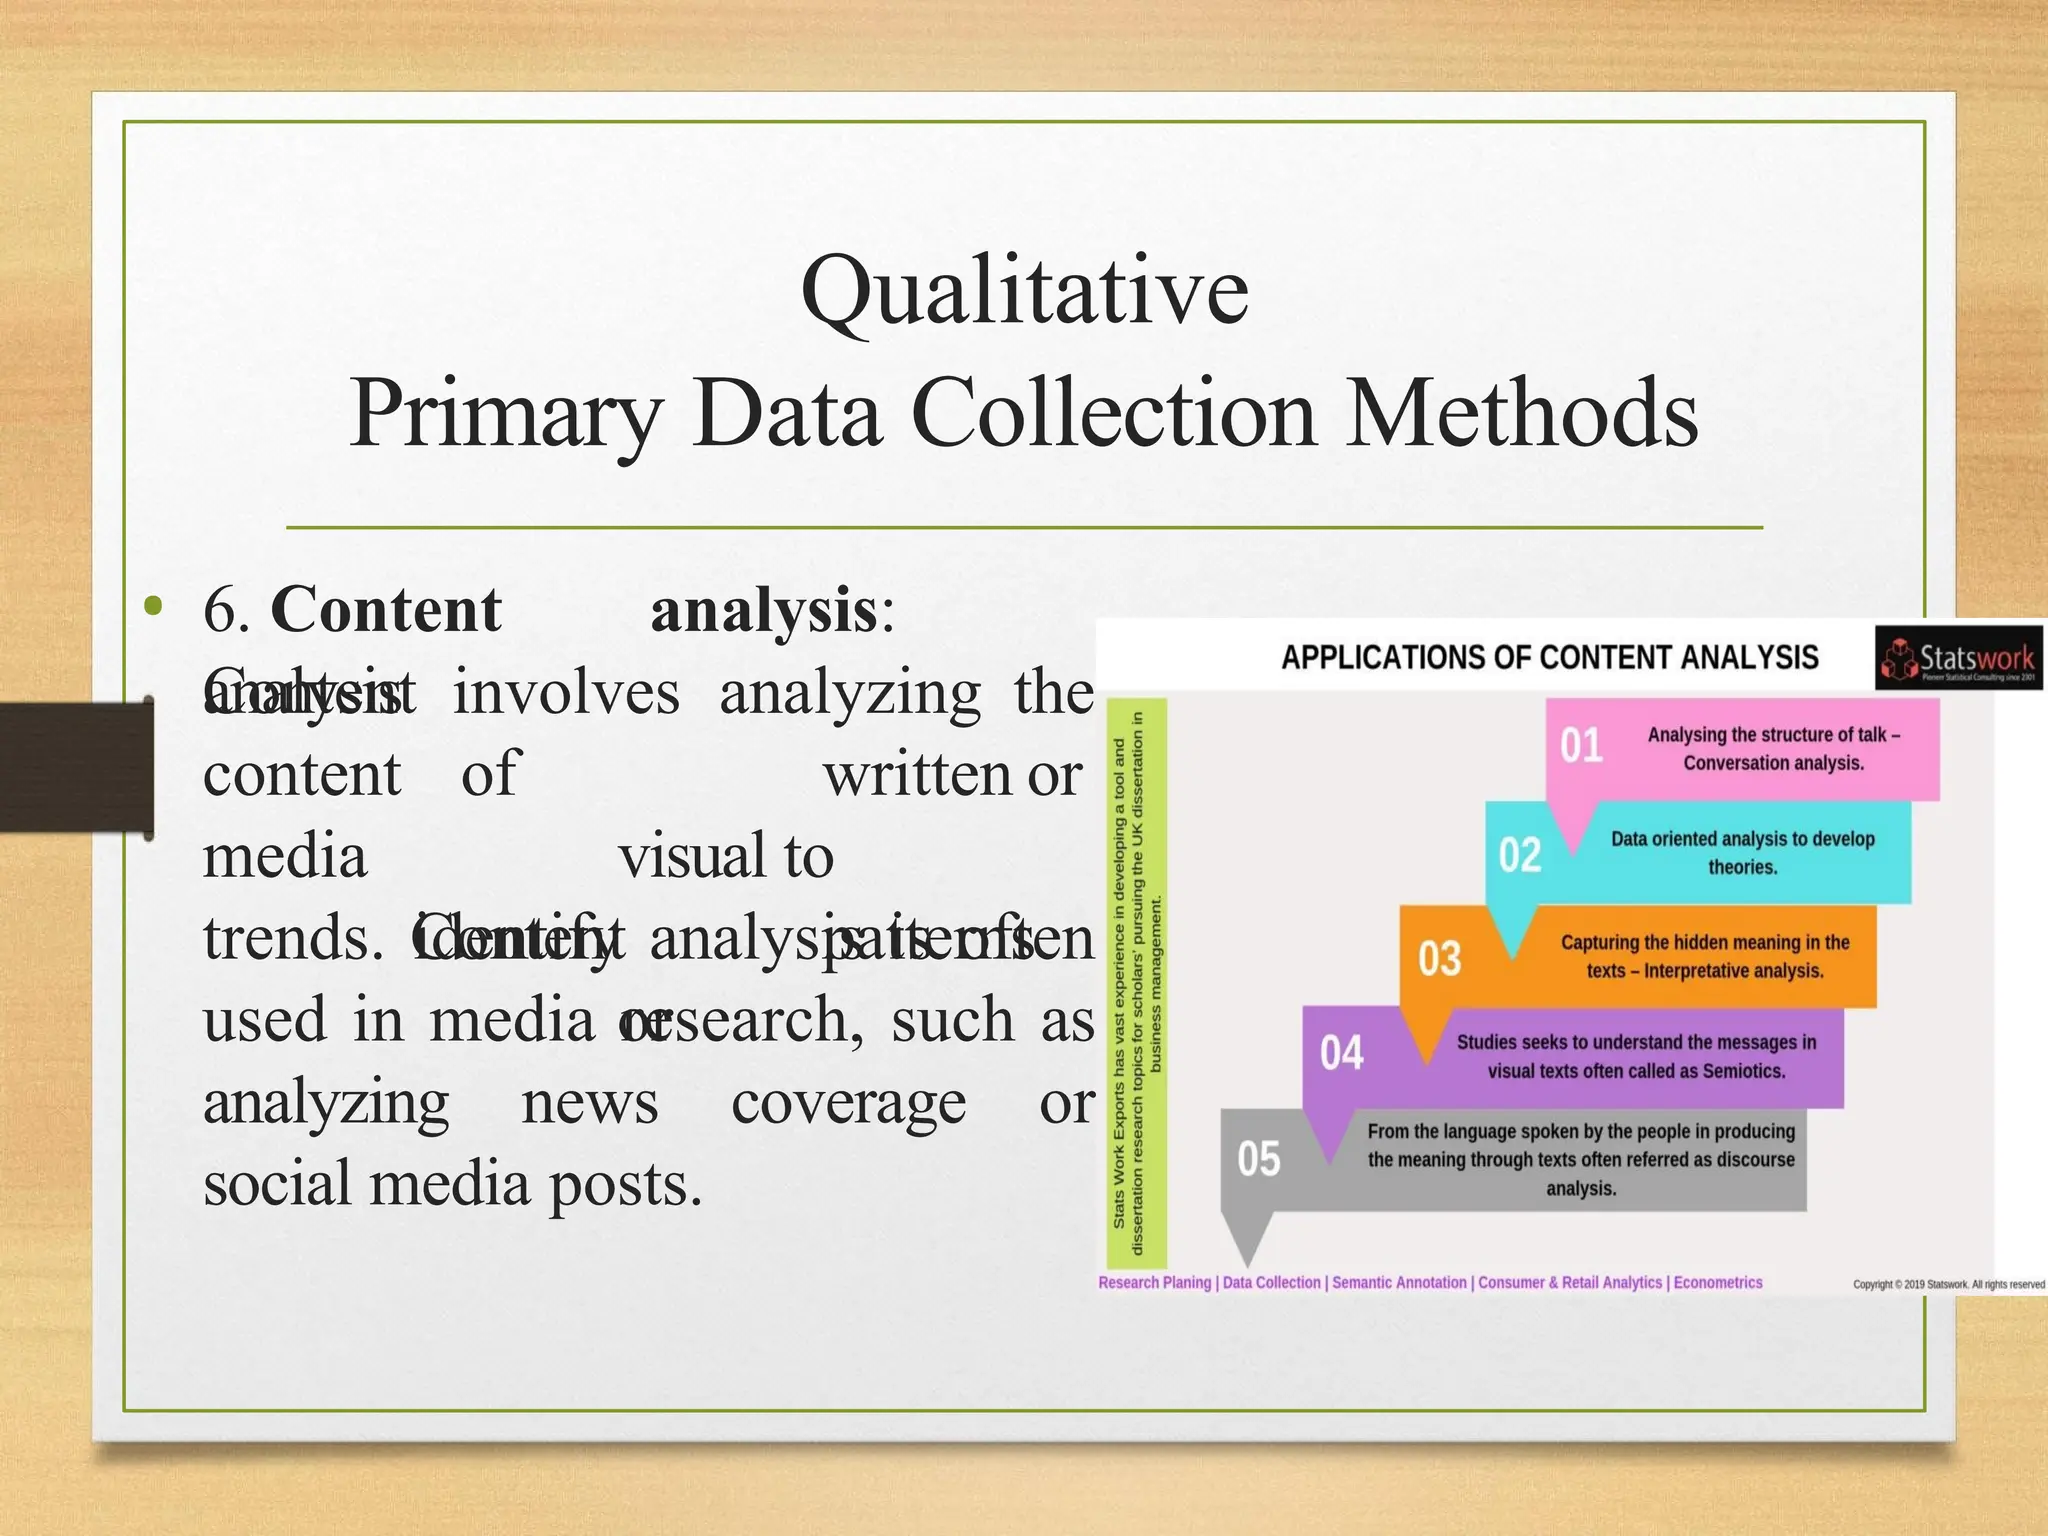
• 6. Content analysis:
Content involves analyzing the
analysis
content
media
of written or
visual to
identify patterns
or
trends. Content analysis is often
used in media research, such as
analyzing news coverage or
social media posts.
23.
Qualitative
Primary Data CollectionMethods
• 7. Narrative analysis: Narrative
analysis involves analyzing the
stories and experiences shared
by individuals or groups to
gain insights into their
attitudes, beliefs, and behaviors.
Narrative analysis can involve
examining written or oral
narratives, such as personal
stories, biographies, or
testimonials.
24.
Secondary Data CollectionMethods
• Secondary data refers to data that has already been
collected by someone else. It is much more
inexpensive and easier to collect than primary data.
While primary data collection provides more authentic
and original data, there are numerous instances
where secondary data collection provides great value
to organizations.
25.
Classification of SecondaryData
Collection Methods
• secondary data collection methods can be categorized
into different types based on the source
• Internal secondary data: This includes data that is collected
and maintained by an organization for its own purposes.
Examples include sales data, customer feedback, and
employee records.
• External secondary data: This includes data that is
collected and maintained by external sources, such as
government agencies, research organizations, or industry
associations. Examples include census data, market research
reports, and industry statistics.
26.
Classification of SecondaryData
Collection Methods
• secondary data collection methods can be categorized
into different types based on nature of the data.
• Published secondary data: This includes data that
is available in published form, such as books,
academic journals, or industry reports.
• Unpublished secondary data: This includes data that
is not readily available in published form, such as
internal company reports, memos, or presentations.
27.
Classification of SecondaryData
Collection Methods
• secondary data collection methods can be categorized
into different types based on the type of the data.
• Digital secondary data: This includes data that is
collected and maintained in digital form, such as
social media data, web analytics, or online surveys.
• Traditional secondary data: This includes data that is
collected and maintained in non-digital form, such as
print media, government publications, or historical
records.
28.
Secondary Data CollectionMethods
1.Government publications: This includes data collected
and published by government agencies, such as census data,
economic indicators, and public health statistics.
• Census data: Population data, demographic data, and
economic data collected by the US Census Bureau, for
example.
• Public health statistics: Data on disease prevalence,
mortality rates, and health outcomes collected by government
health agencies, such as the Centers for Disease Control and
Prevention (CDC).
29.
Secondary Data CollectionMethods
2.Industry reports: This includes data collected and
published by industry associations, trade journals, and market
research firms. Examples include industry-specific data on
market size, trends, and consumer behavior.
• Market research reports: Reports on consumer behavior,
market size, and trends published by market research
firms, such as Nielsen, Gartner, or Forrester.
• Industry-specific data: Reports on the state of an industry,
including market share, growth rates, and performance
metrics, published by industry associations or trade journals.
30.
Secondary Data CollectionMethods
3.Academic literature: This includes data collected
and published by researchers in academic journals, books,
and conference proceedings. It can provide valuable insights
into the latest research and theories in a given field.
• Scholarly articles: Research articles on specific topics,
published in academic journals like Science or the Journal
of Marketing Research.
• Books: Academic books that present research findings,
theoretical frameworks, or conceptual models, published
by university presses or academic publishers like Sage or
Routledge.
31.
Secondary Data CollectionMethods
4.Market research reports: This includes data collected
and published by market research firms, often through
surveys, interviews, and focus groups. It can provide
insights into consumer behavior, market trends, and product
demand.
• Consumer surveys: Surveys of consumer behavior and
attitudes toward products or services, conducted by
market research firms like Ipsos or Kantar.
• Focus groups: Group discussions with consumers or target
audiences, conducted by market research firms like Qualtrics
or GreenBook.
32.
Secondary Data CollectionMethods
5.Historical data: This includes data collected and published
in historical archives, museums, and libraries. It can provide
insights into social, cultural, and economic trends over time.
• Archival documents: Historical documents, letters, or
photographs held in archives or libraries, like the
National Archives or the Library of Congress.
• Museum collections: Objects or artifacts from historical
periods, such as art, clothing, or tools, held in museums like
the Smithsonian or the British Museum.
33.
Secondary Data CollectionMethods
6.Social media data: This includes data collected from
social media platforms, such as Facebook, Twitter, and
Instagram. It can provide insights into consumer behavior, social
trends, and public opinion.
• Social media analytics: Data on social media
engagement, sentiment, and audience behavior, collected
and analyzed by tools like Hootsuite or Sprout Social.
• Hashtag tracking: Data on trending topics or hashtags on
social media platforms like Twitter, collected and analyzed
by tools like TweetReach or Hashtagify.
34.
Secondary Data CollectionMethods
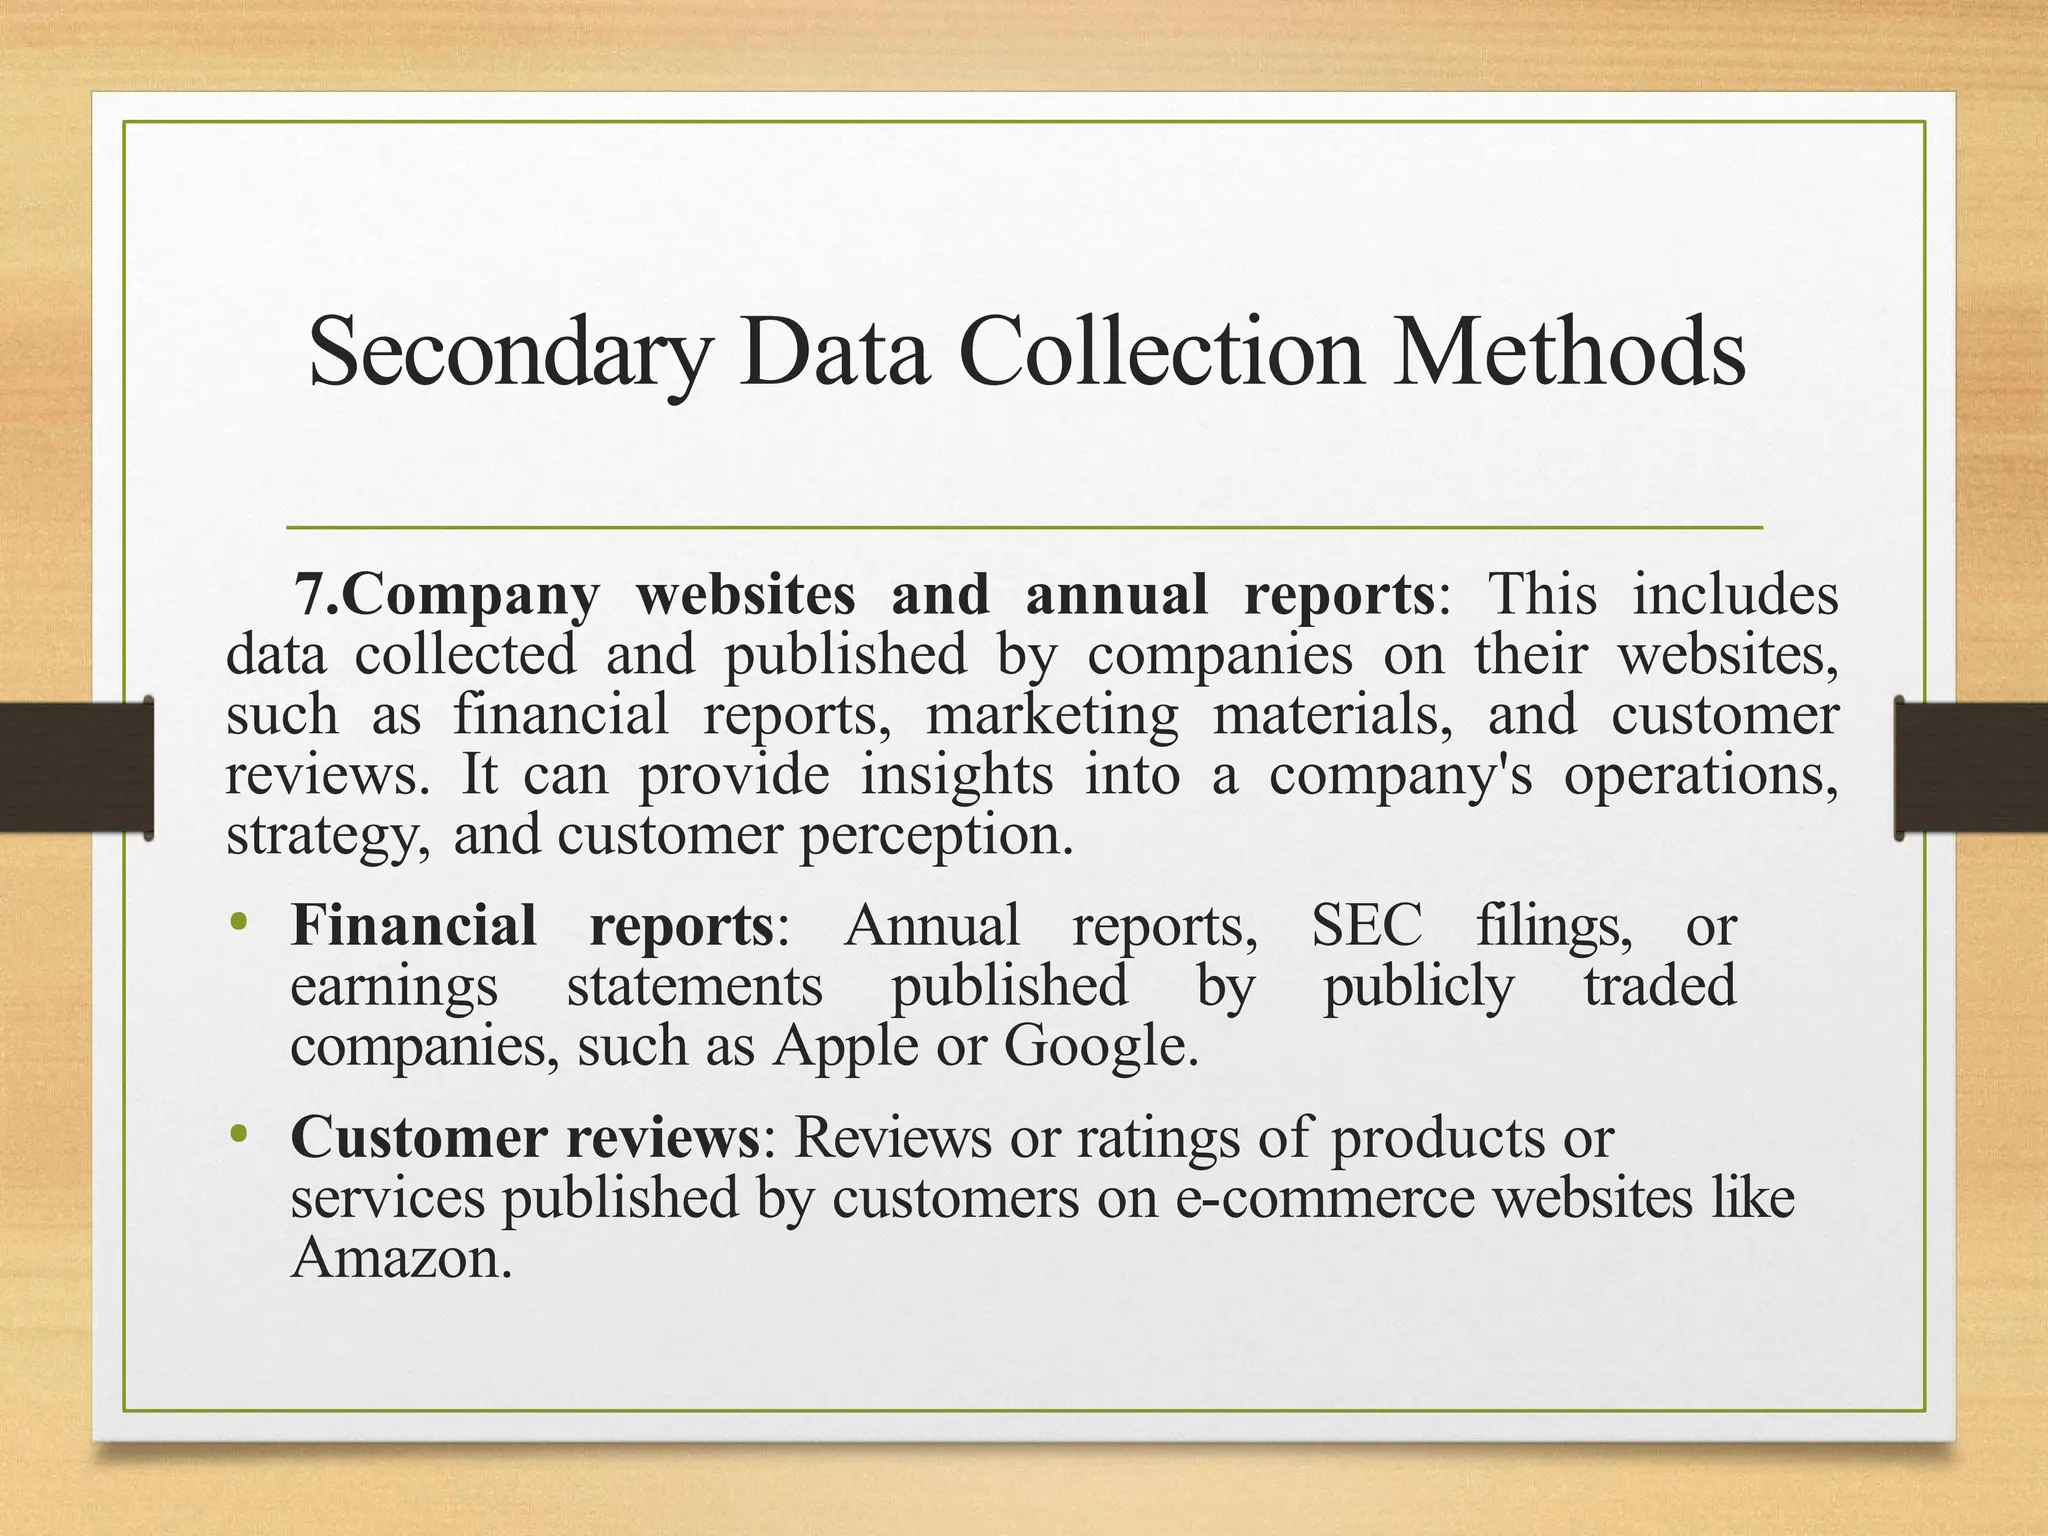
7.Company websites and annual reports: This includes
data collected and published by companies on their websites,
such as financial reports, marketing materials, and customer
reviews. It can provide insights into a company's operations,
strategy, and customer perception.
• Financial reports: Annual reports, SEC filings, or
earnings statements published by publicly traded
companies, such as Apple or Google.
• Customer reviews: Reviews or ratings of products or
services published by customers on e-commerce websites like
Amazon.
35.
Data Collection Tools
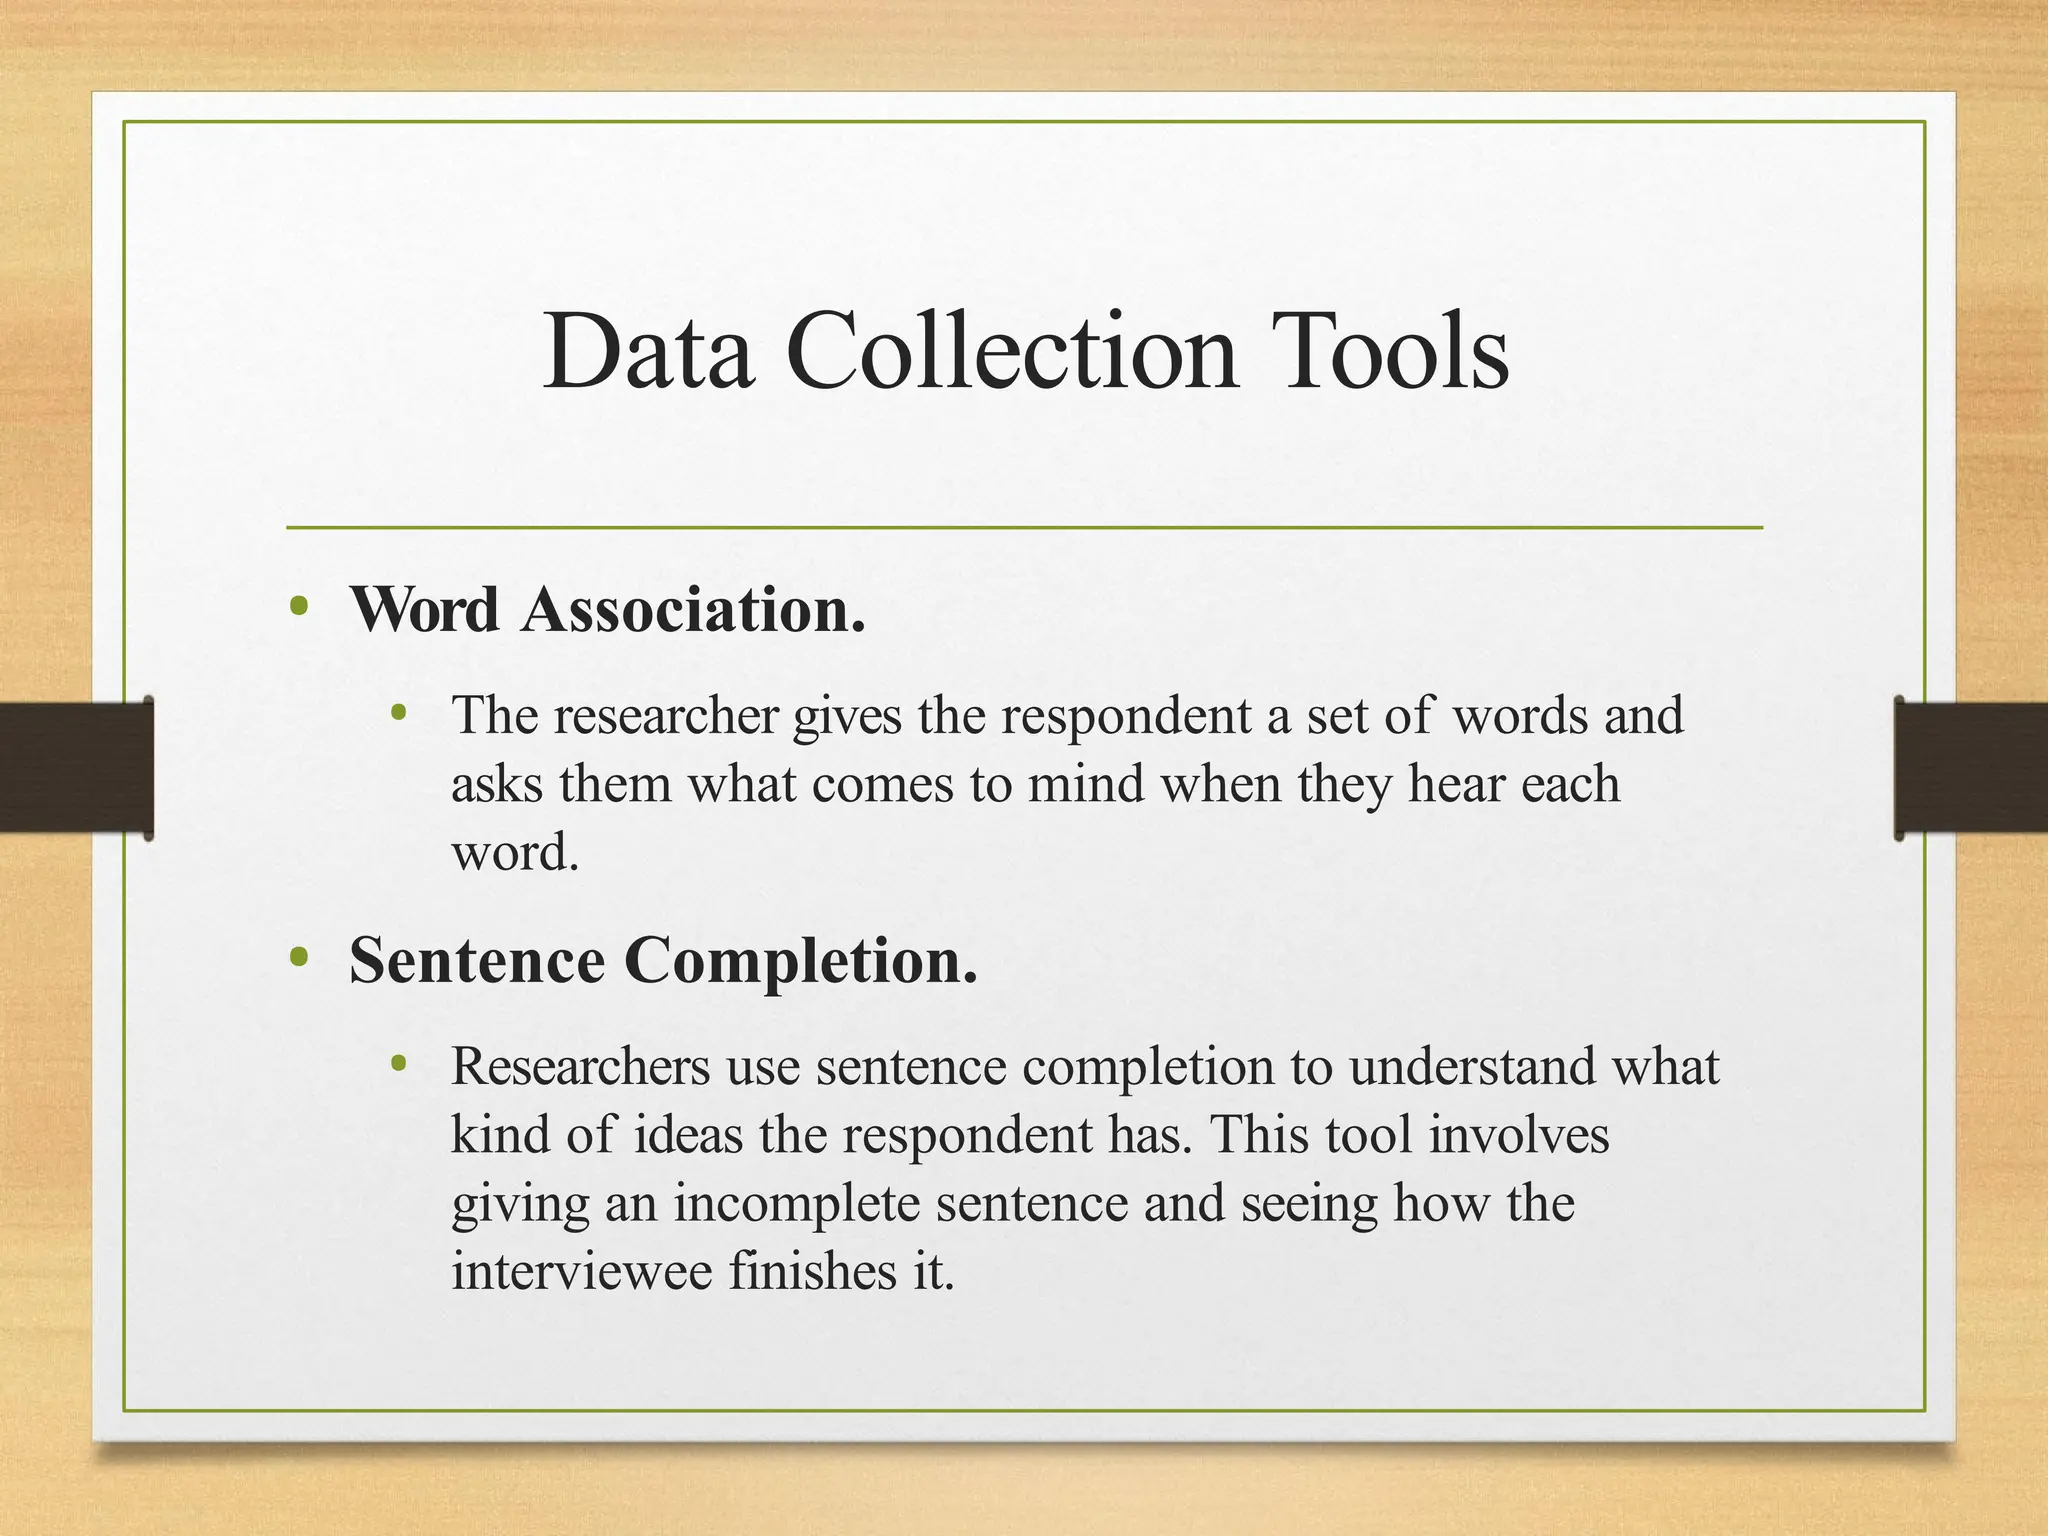
•Word Association.
• The researcher gives the respondent a set of words and
asks them what comes to mind when they hear each
word.
• Sentence Completion.
• Researchers use sentence completion to understand what
kind of ideas the respondent has. This tool involves
giving an incomplete sentence and seeing how the
interviewee finishes it.
36.
Data Collection Tools
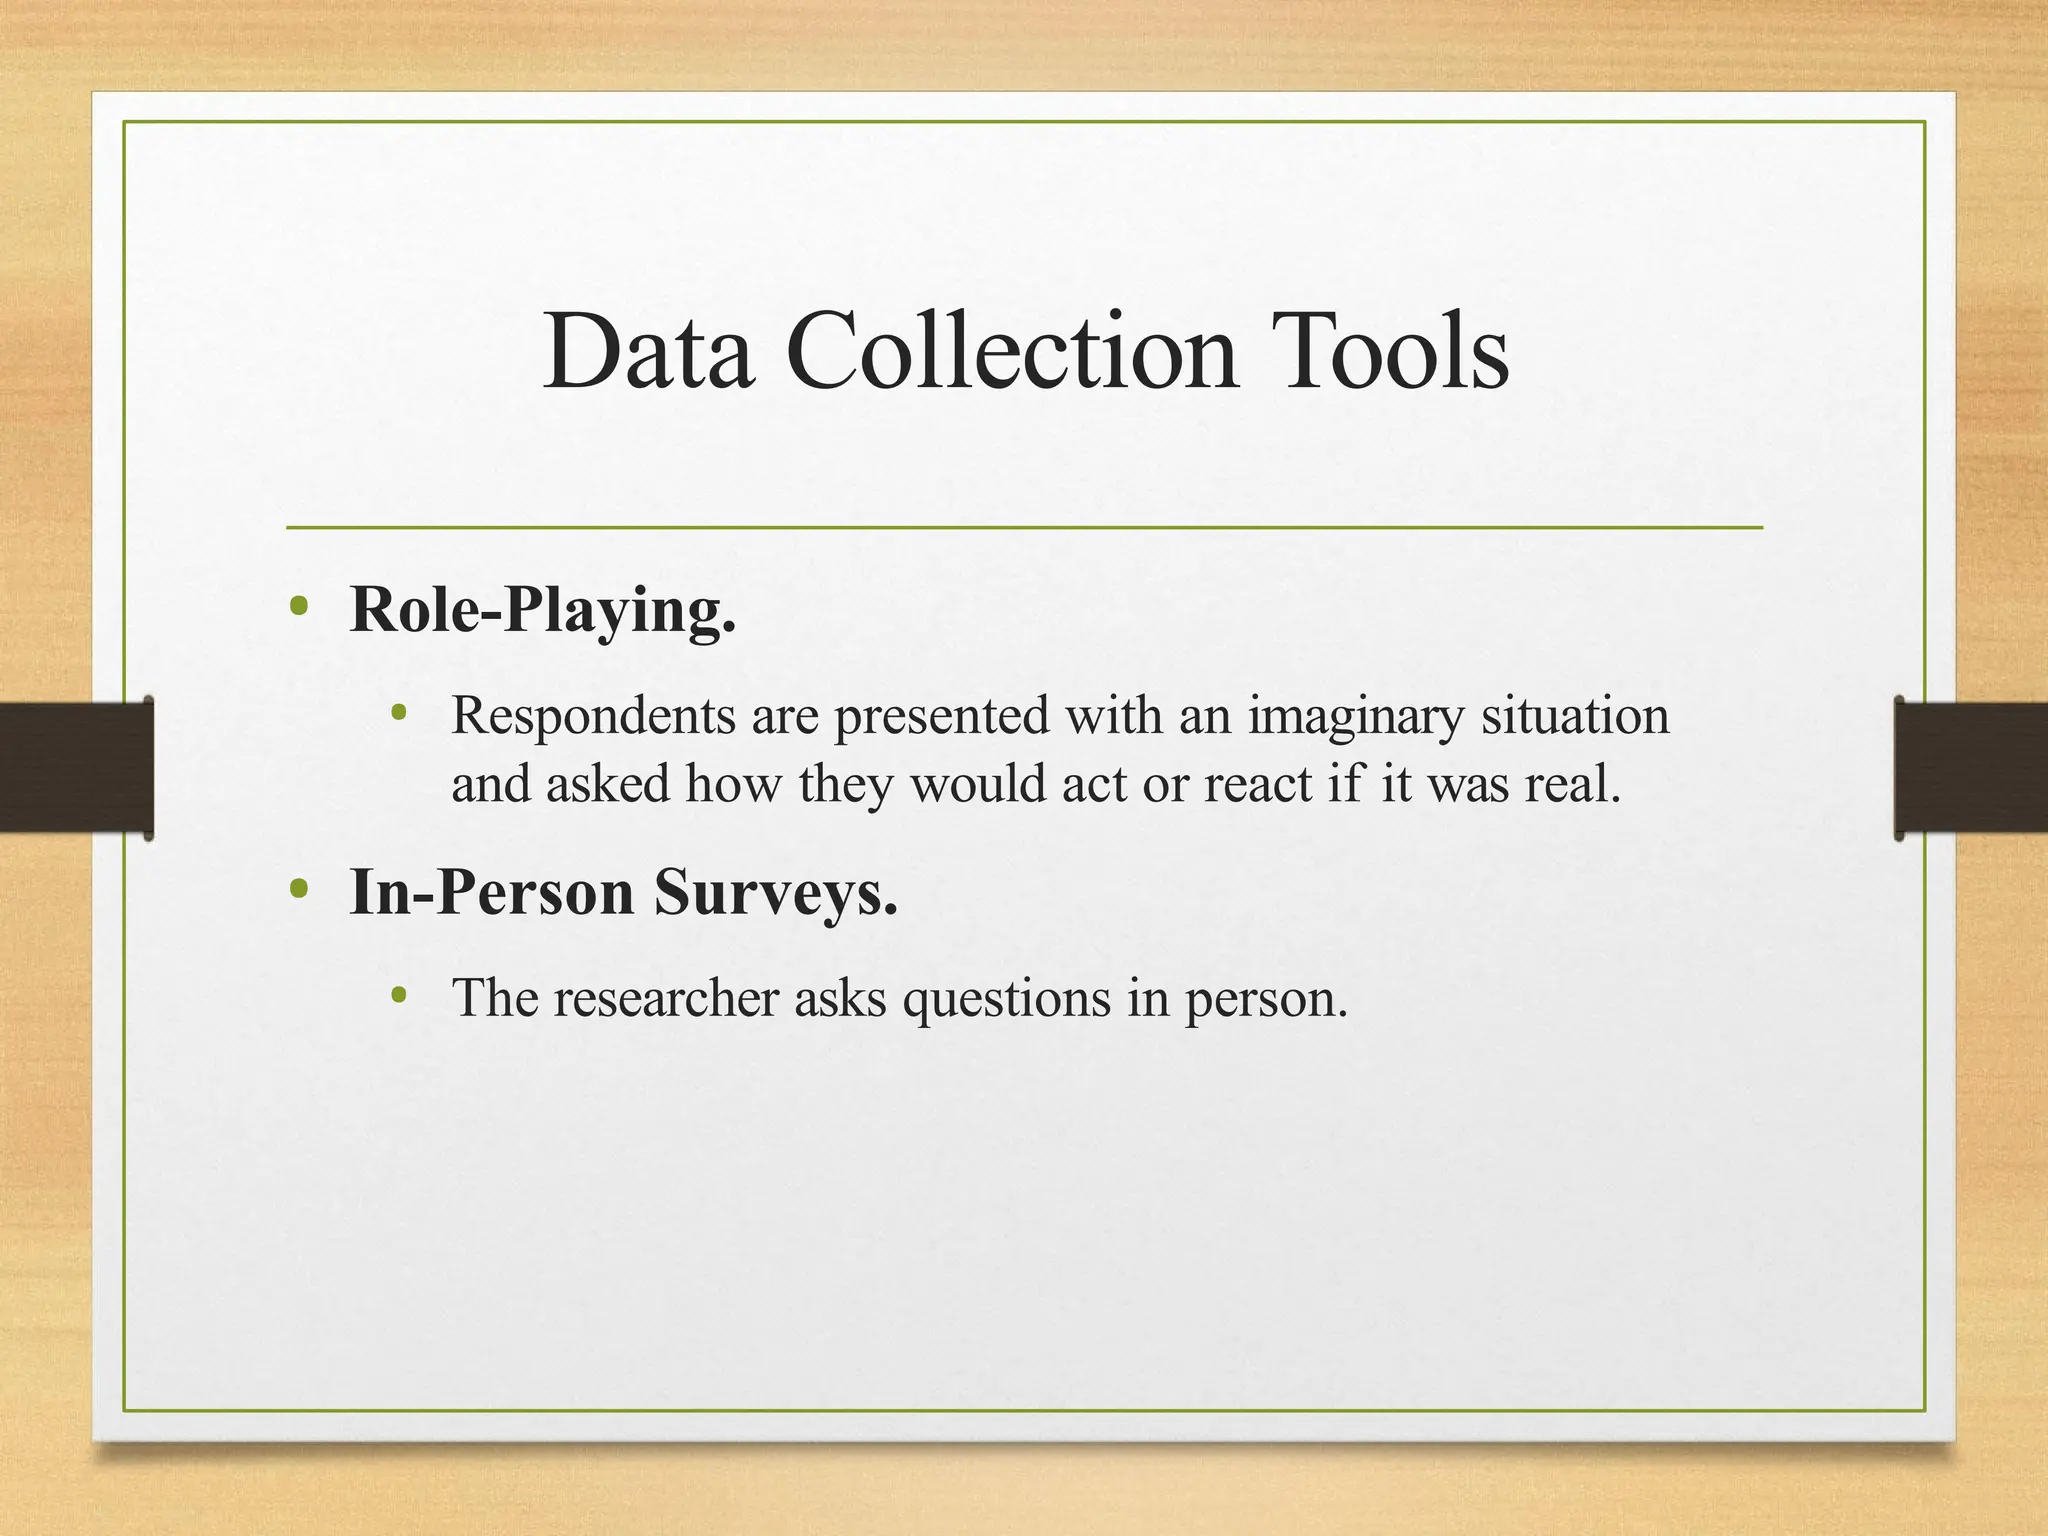
•Role-Playing.
• Respondents are presented with an imaginary situation
and asked how they would act or react if it was real.
• In-Person Surveys.
• The researcher asks questions in person.
37.
Data Collection Tools
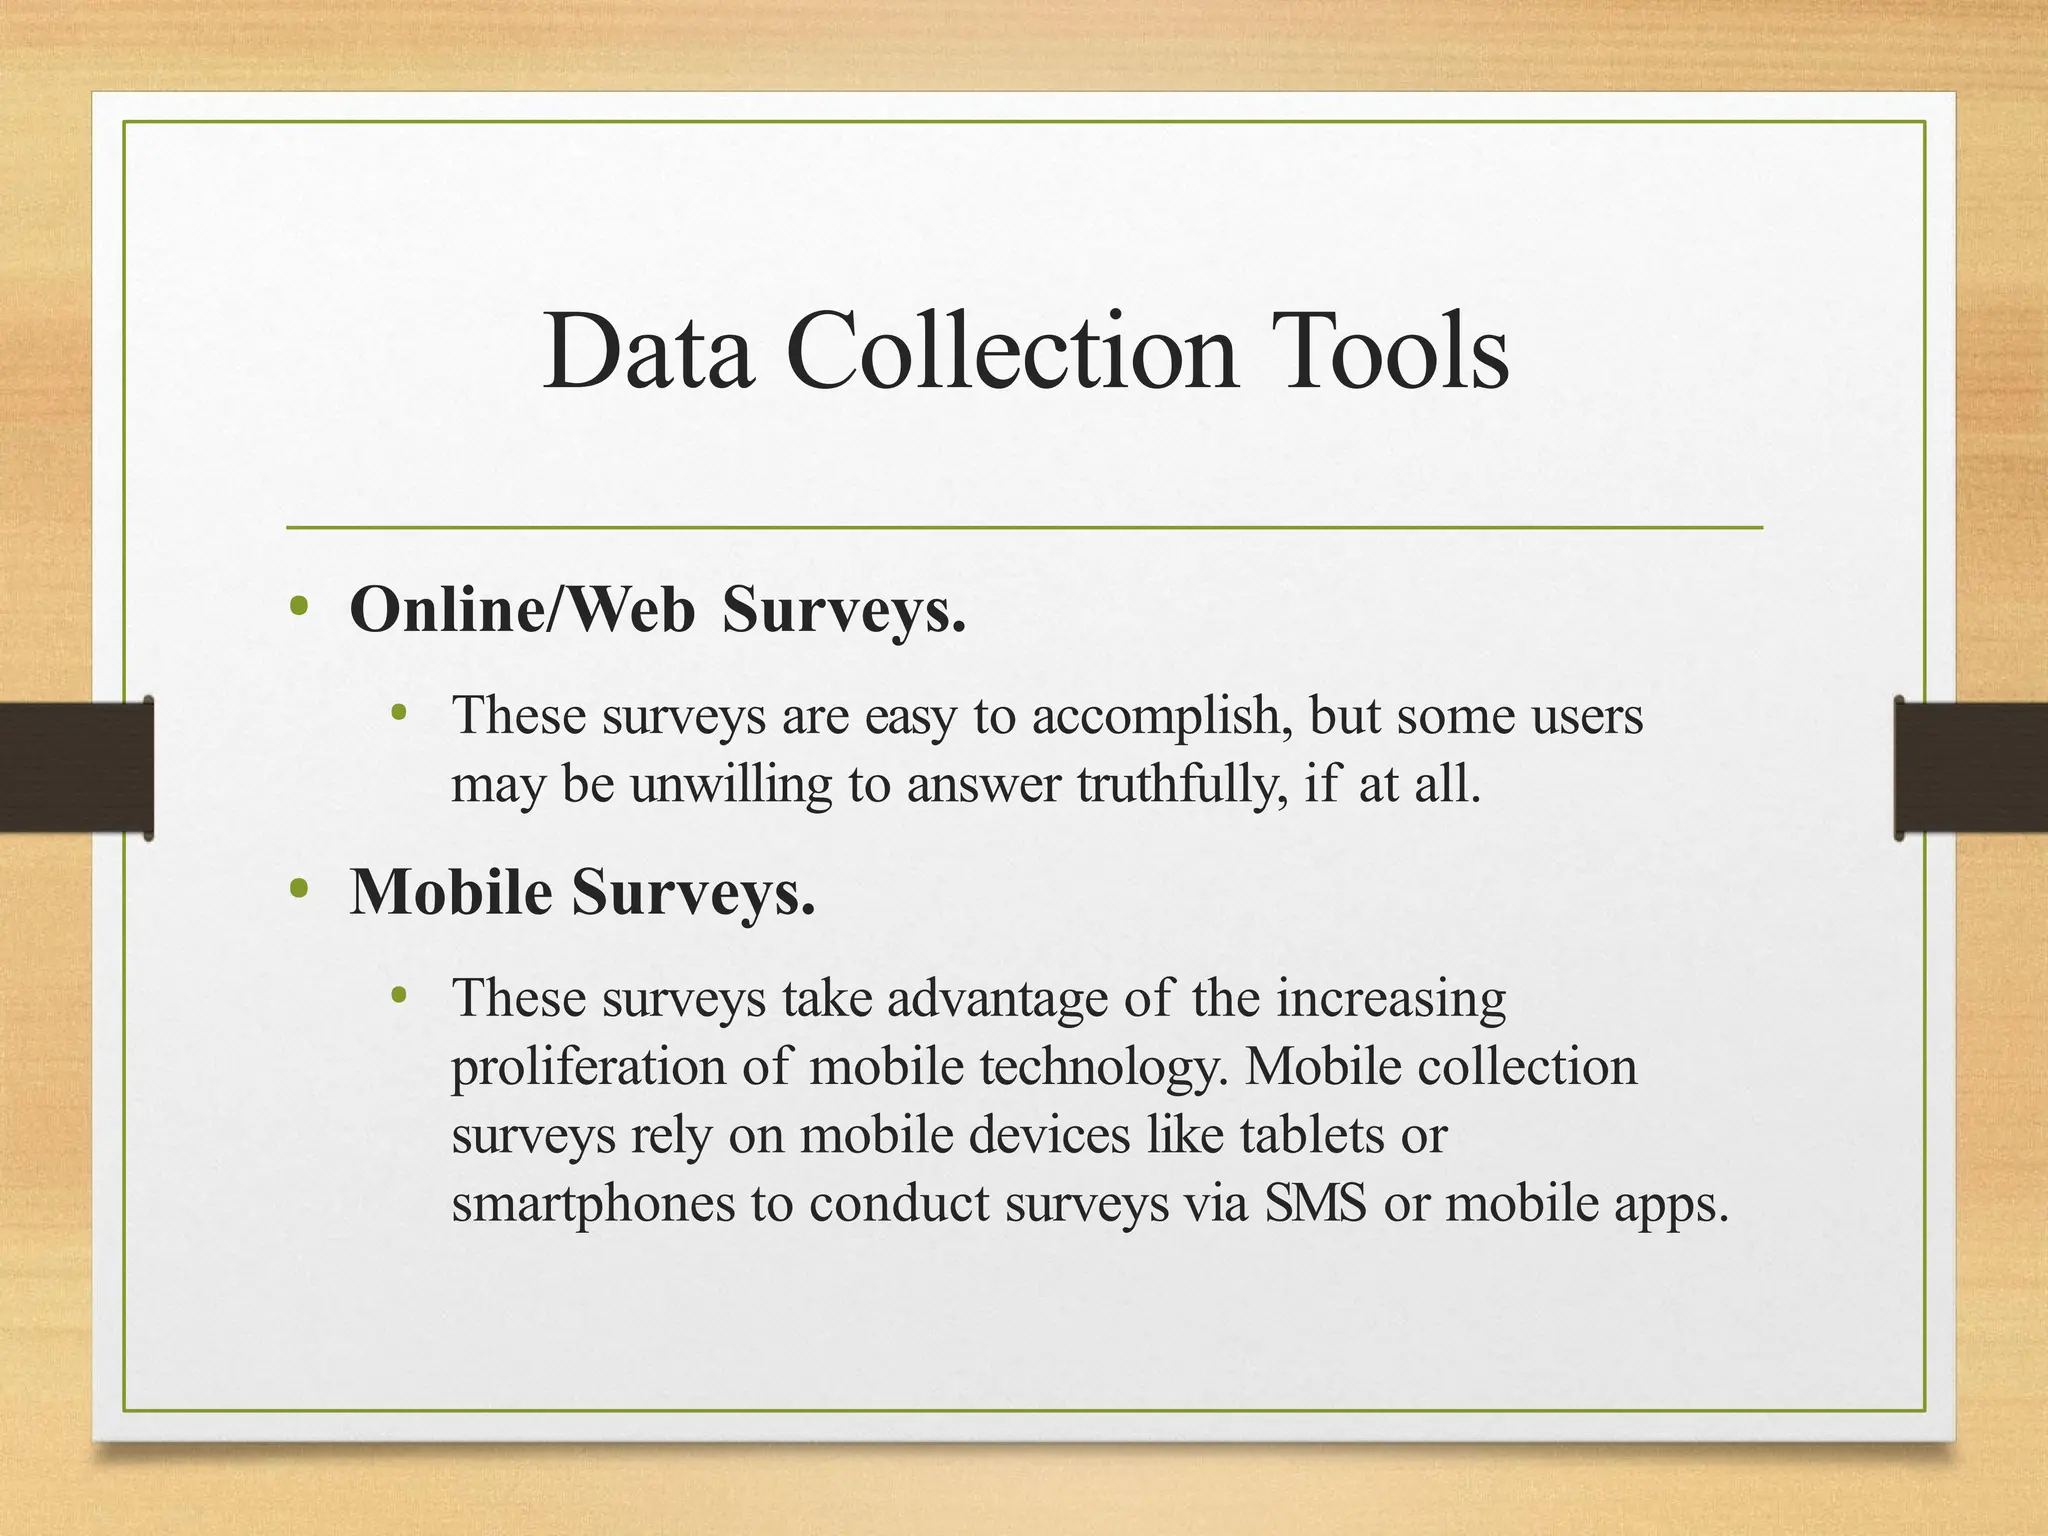
•Online/Web Surveys.
• These surveys are easy to accomplish, but some users
may be unwilling to answer truthfully, if at all.
• Mobile Surveys.
• These surveys take advantage of the increasing
proliferation of mobile technology. Mobile collection
surveys rely on mobile devices like tablets or
smartphones to conduct surveys via SMS or mobile apps.
38.
Data Collection Tools
•Phone Surveys.
• No researcher can call thousands of people at once, so
they need a third party to handle the chore. However,
many people have call screening and won’t answer.
• Observation.
• Sometimes, the simplest method is the best. Researchers
who make direct observations collect data quickly and
easily, with little intrusion or third-party bias. Naturally,
it’s only effective in small-scale situations.
39.
Data Collection Tools
•Transactional Tracking
• Each time your customers make a purchase, tracking
that data can allow you to make decisions about
targeted marketing efforts and understand your
customer base better.
• Online Tracking
• users’ behavior on company’s website is tracked to
identify parts of highest interest, whether users are
confused when using it, and how long they spend on
product pages
40.
Data Collection Tools
•Rating scales:
• Rating scales are a data collection tool that involves asking
participants to rate a particular item or statement on a scale.
For example, a rating scale might be used to measure
attitudes towards a particular brand or product by asking
participants to rate it on a scale of 1-5.
• Photovoice:
• Photovoice is a data collection tool that involves asking
participants to take photographs of their experiences or
surroundings, and then using the photographs as a basis
for discussion or analysis.
41.
Data Collection Tools
•Card sorting:
• Card sorting is a data collection tool that involves asking
participants to sort cards or items into categories based on
their perceptions or preferences. Card sorting can be used to
gather data about user preferences or perceptions of
products or services.
• Social media analysis:
• Social media analysis is a data collection tool that involves
analyzing data from social media platforms, such as
Facebook or Twitter, to gather insights into user behavior,
attitudes, or preferences.
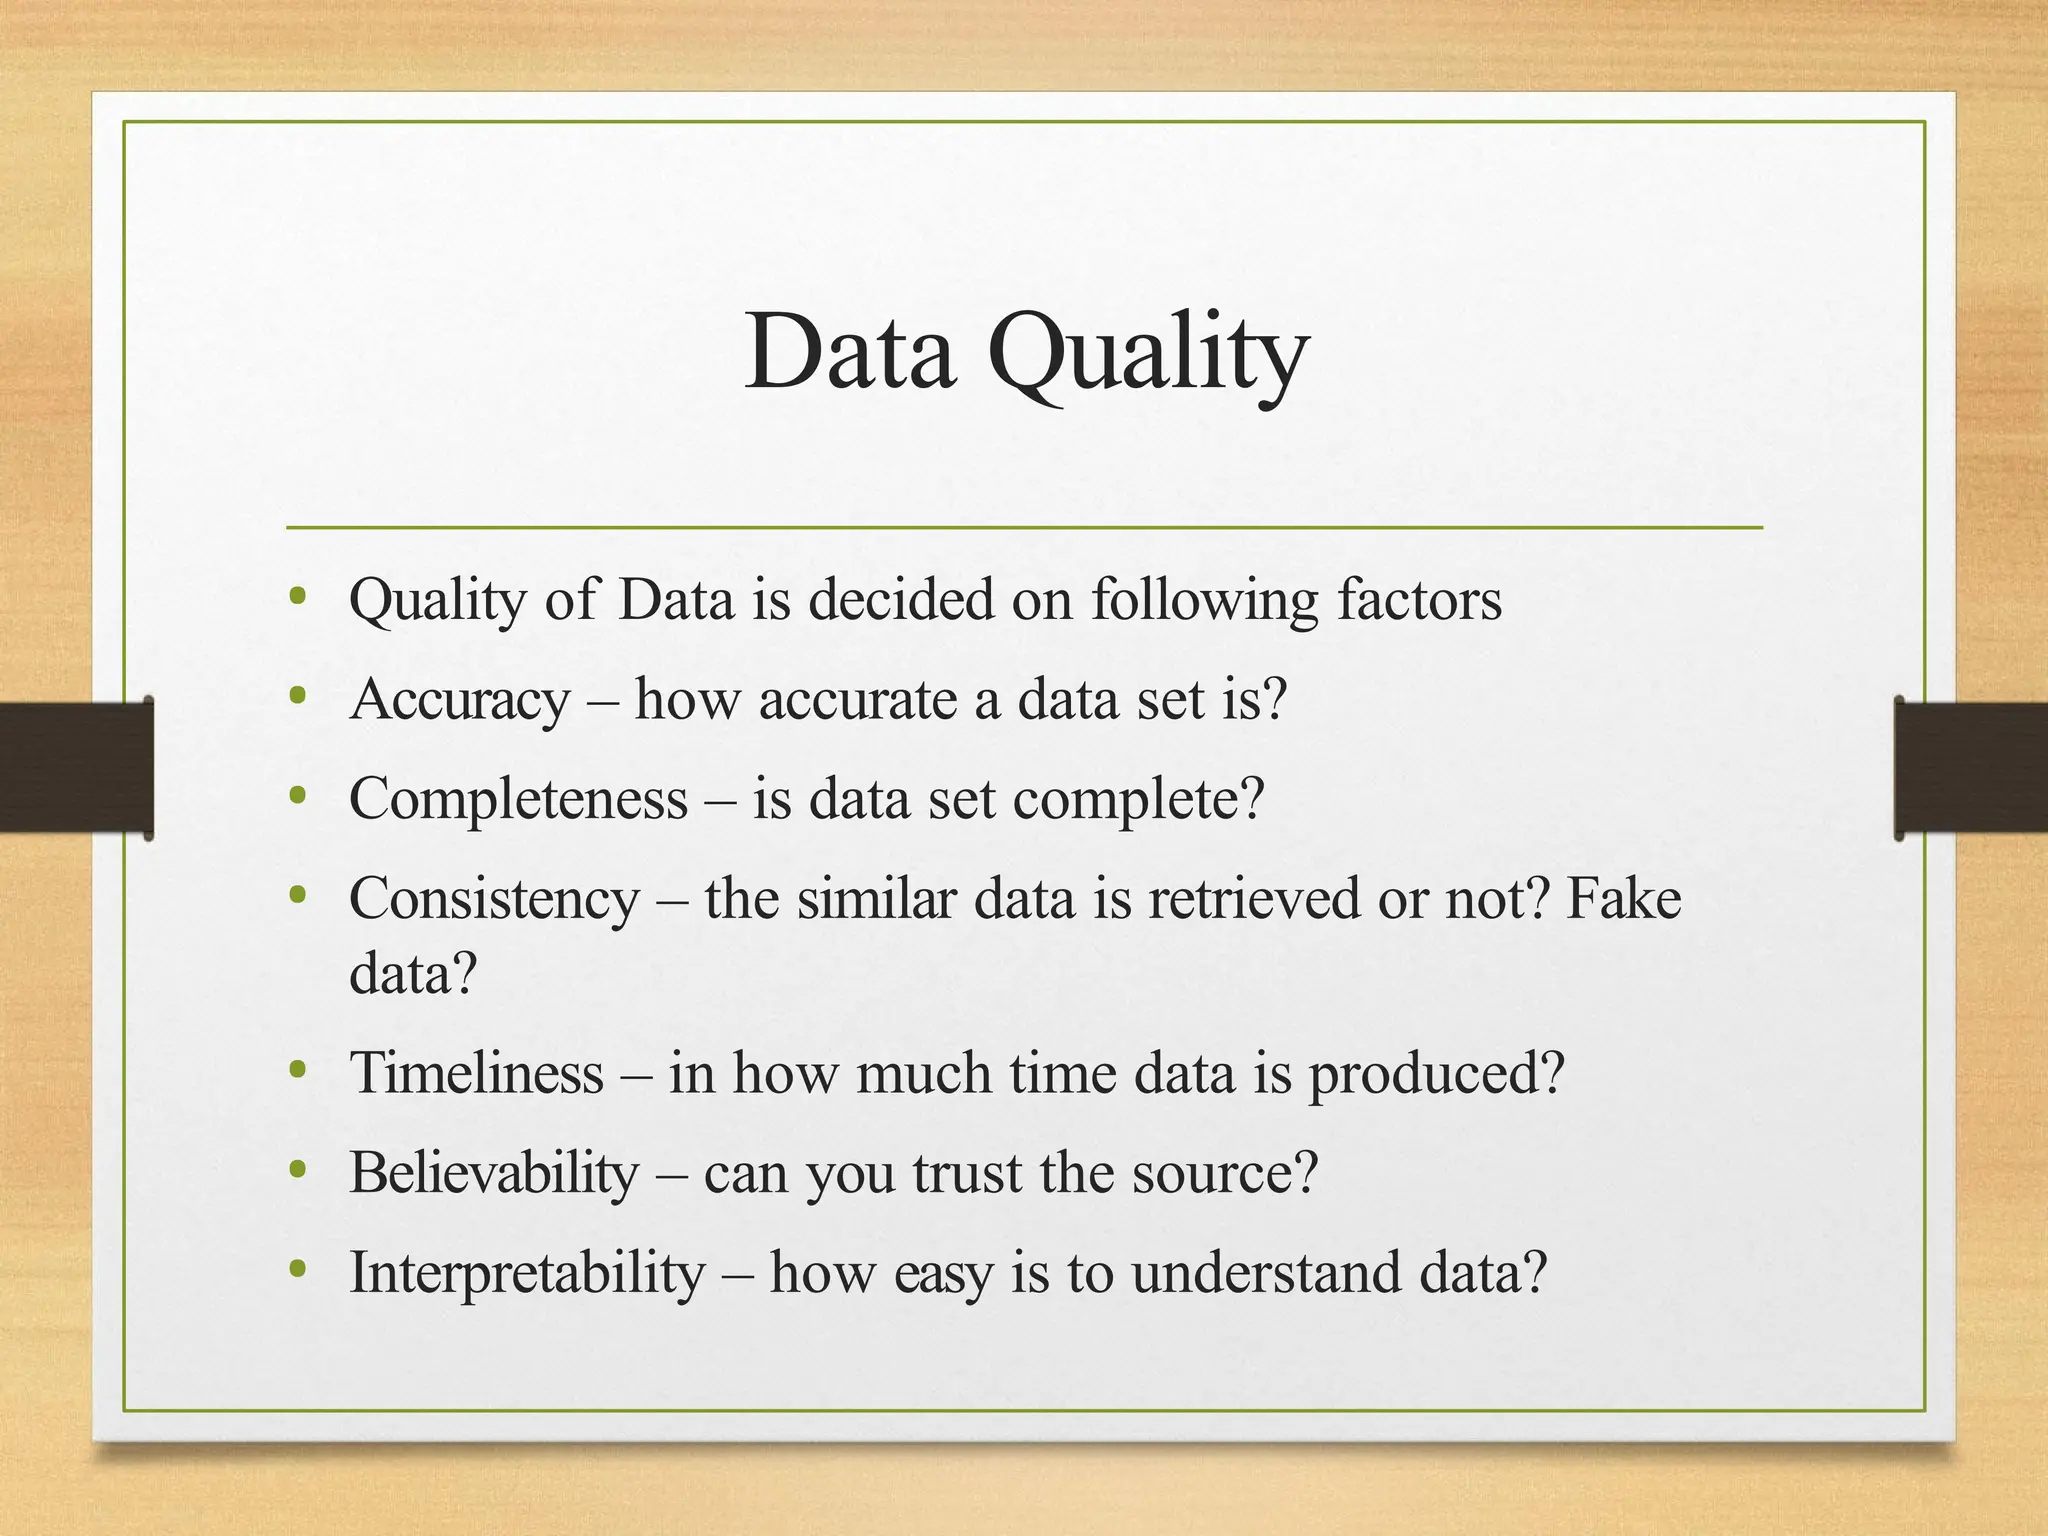
Data Quality
• Qualityof Data is decided on following factors
• Accuracy – how accurate a data set is?
• Completeness – is data set complete?
• Consistency – the similar data is retrieved or not? Fake
data?
• Timeliness – in how much time data is produced?
• Believability – can you trust the source?
• Interpretability – how easy is to understand data?
44.
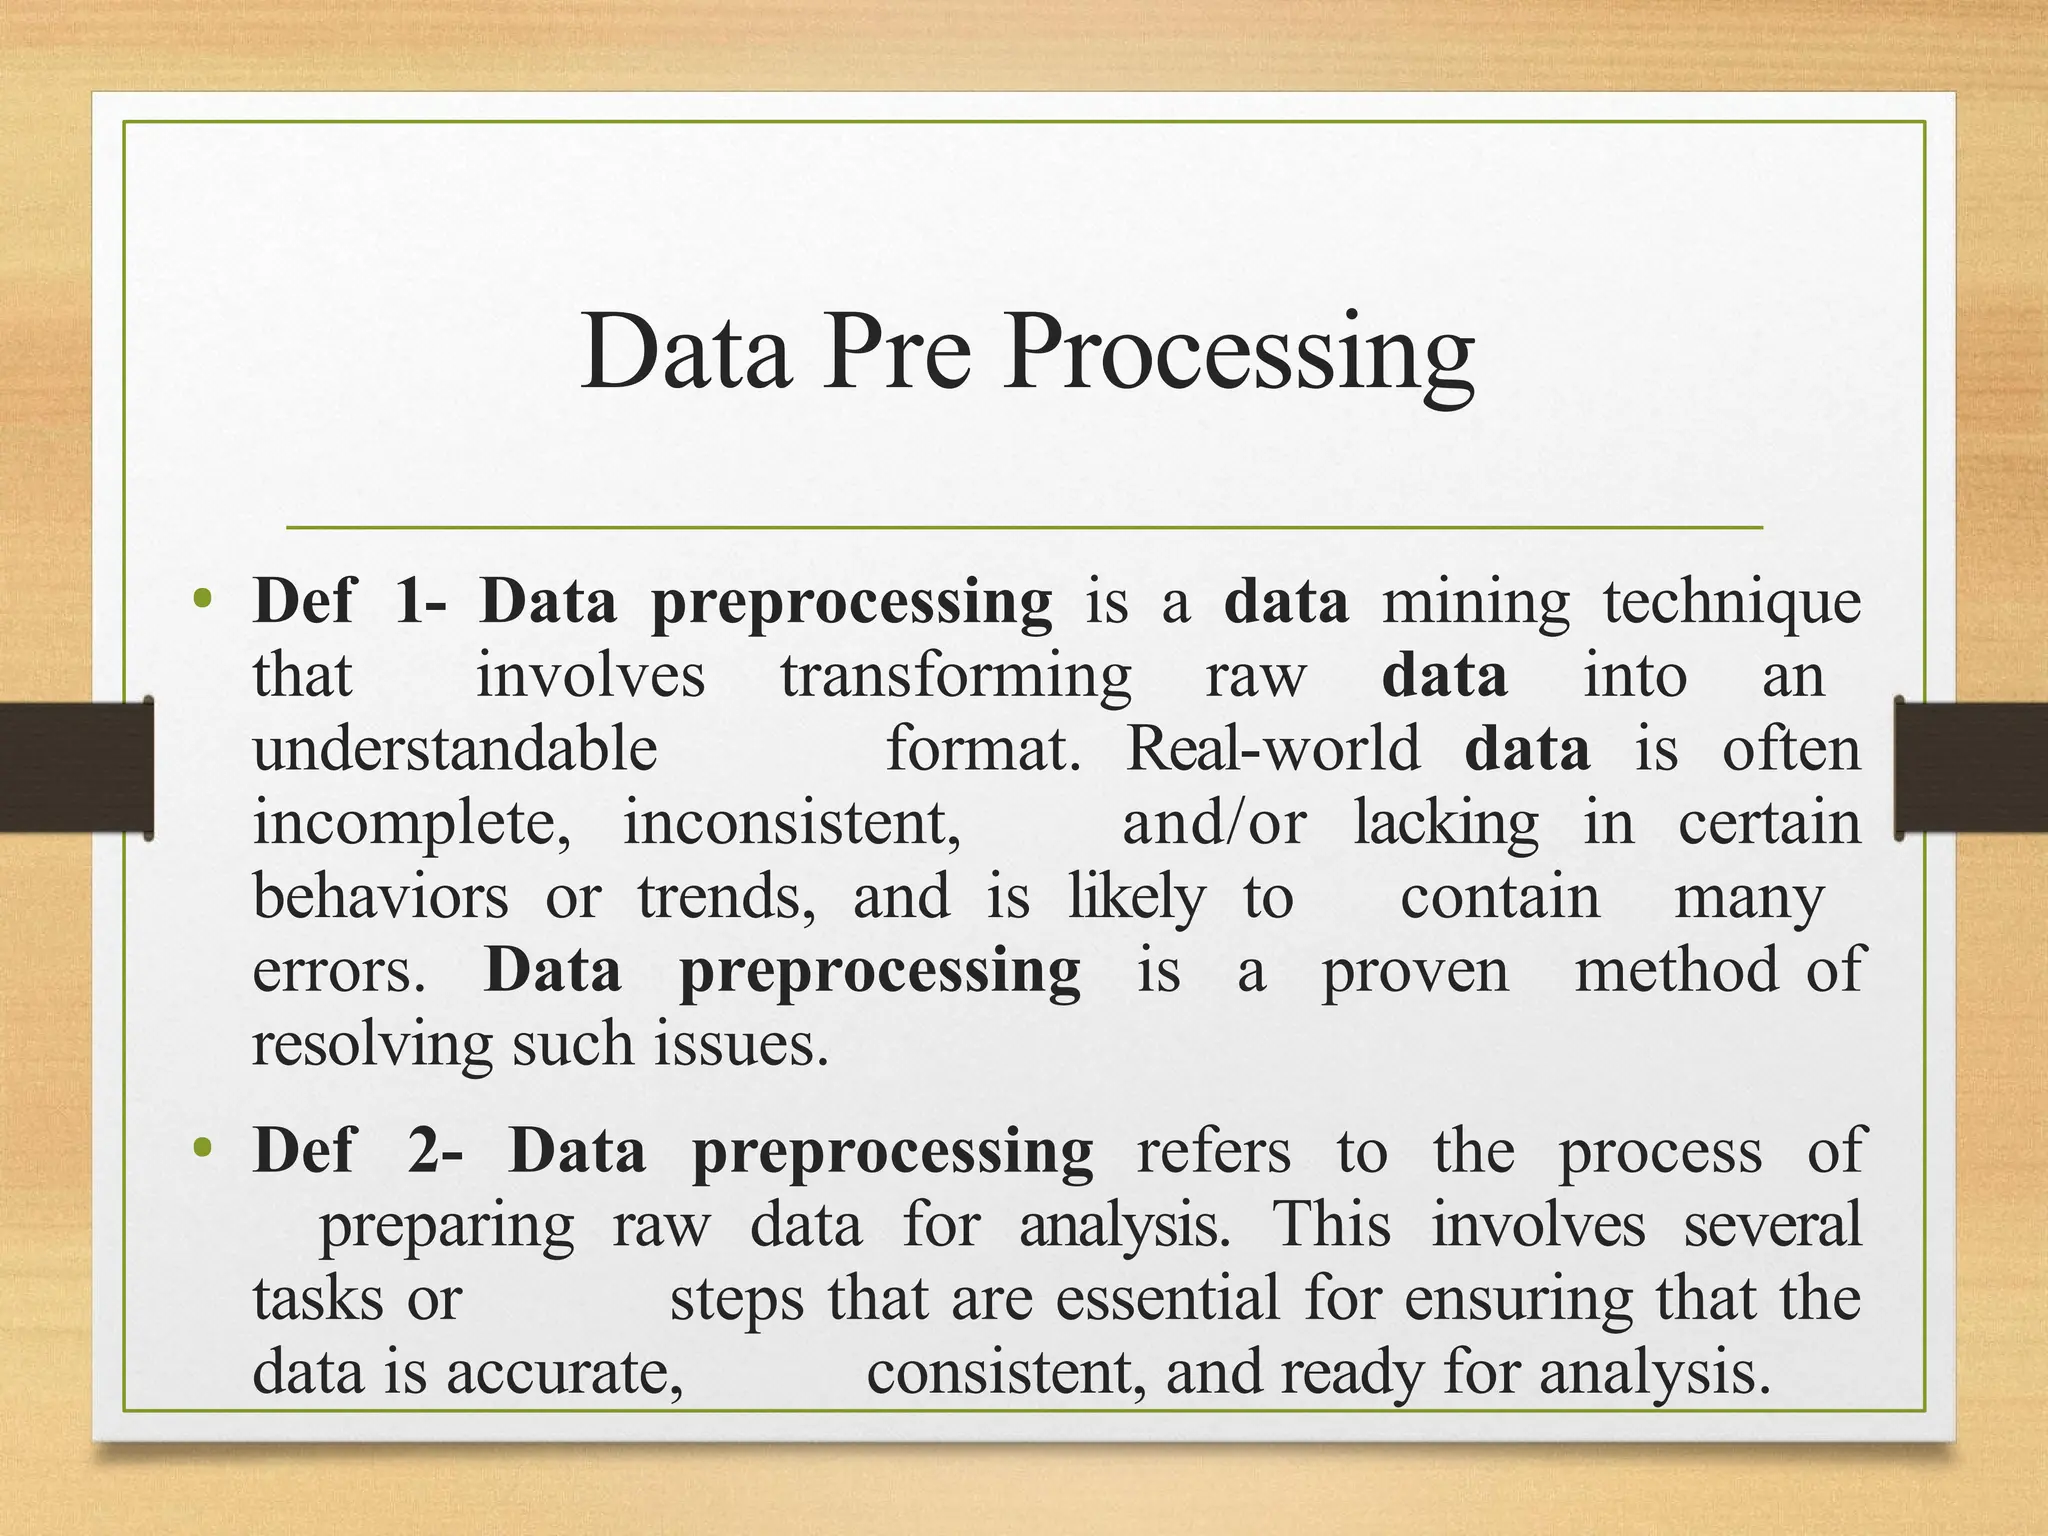
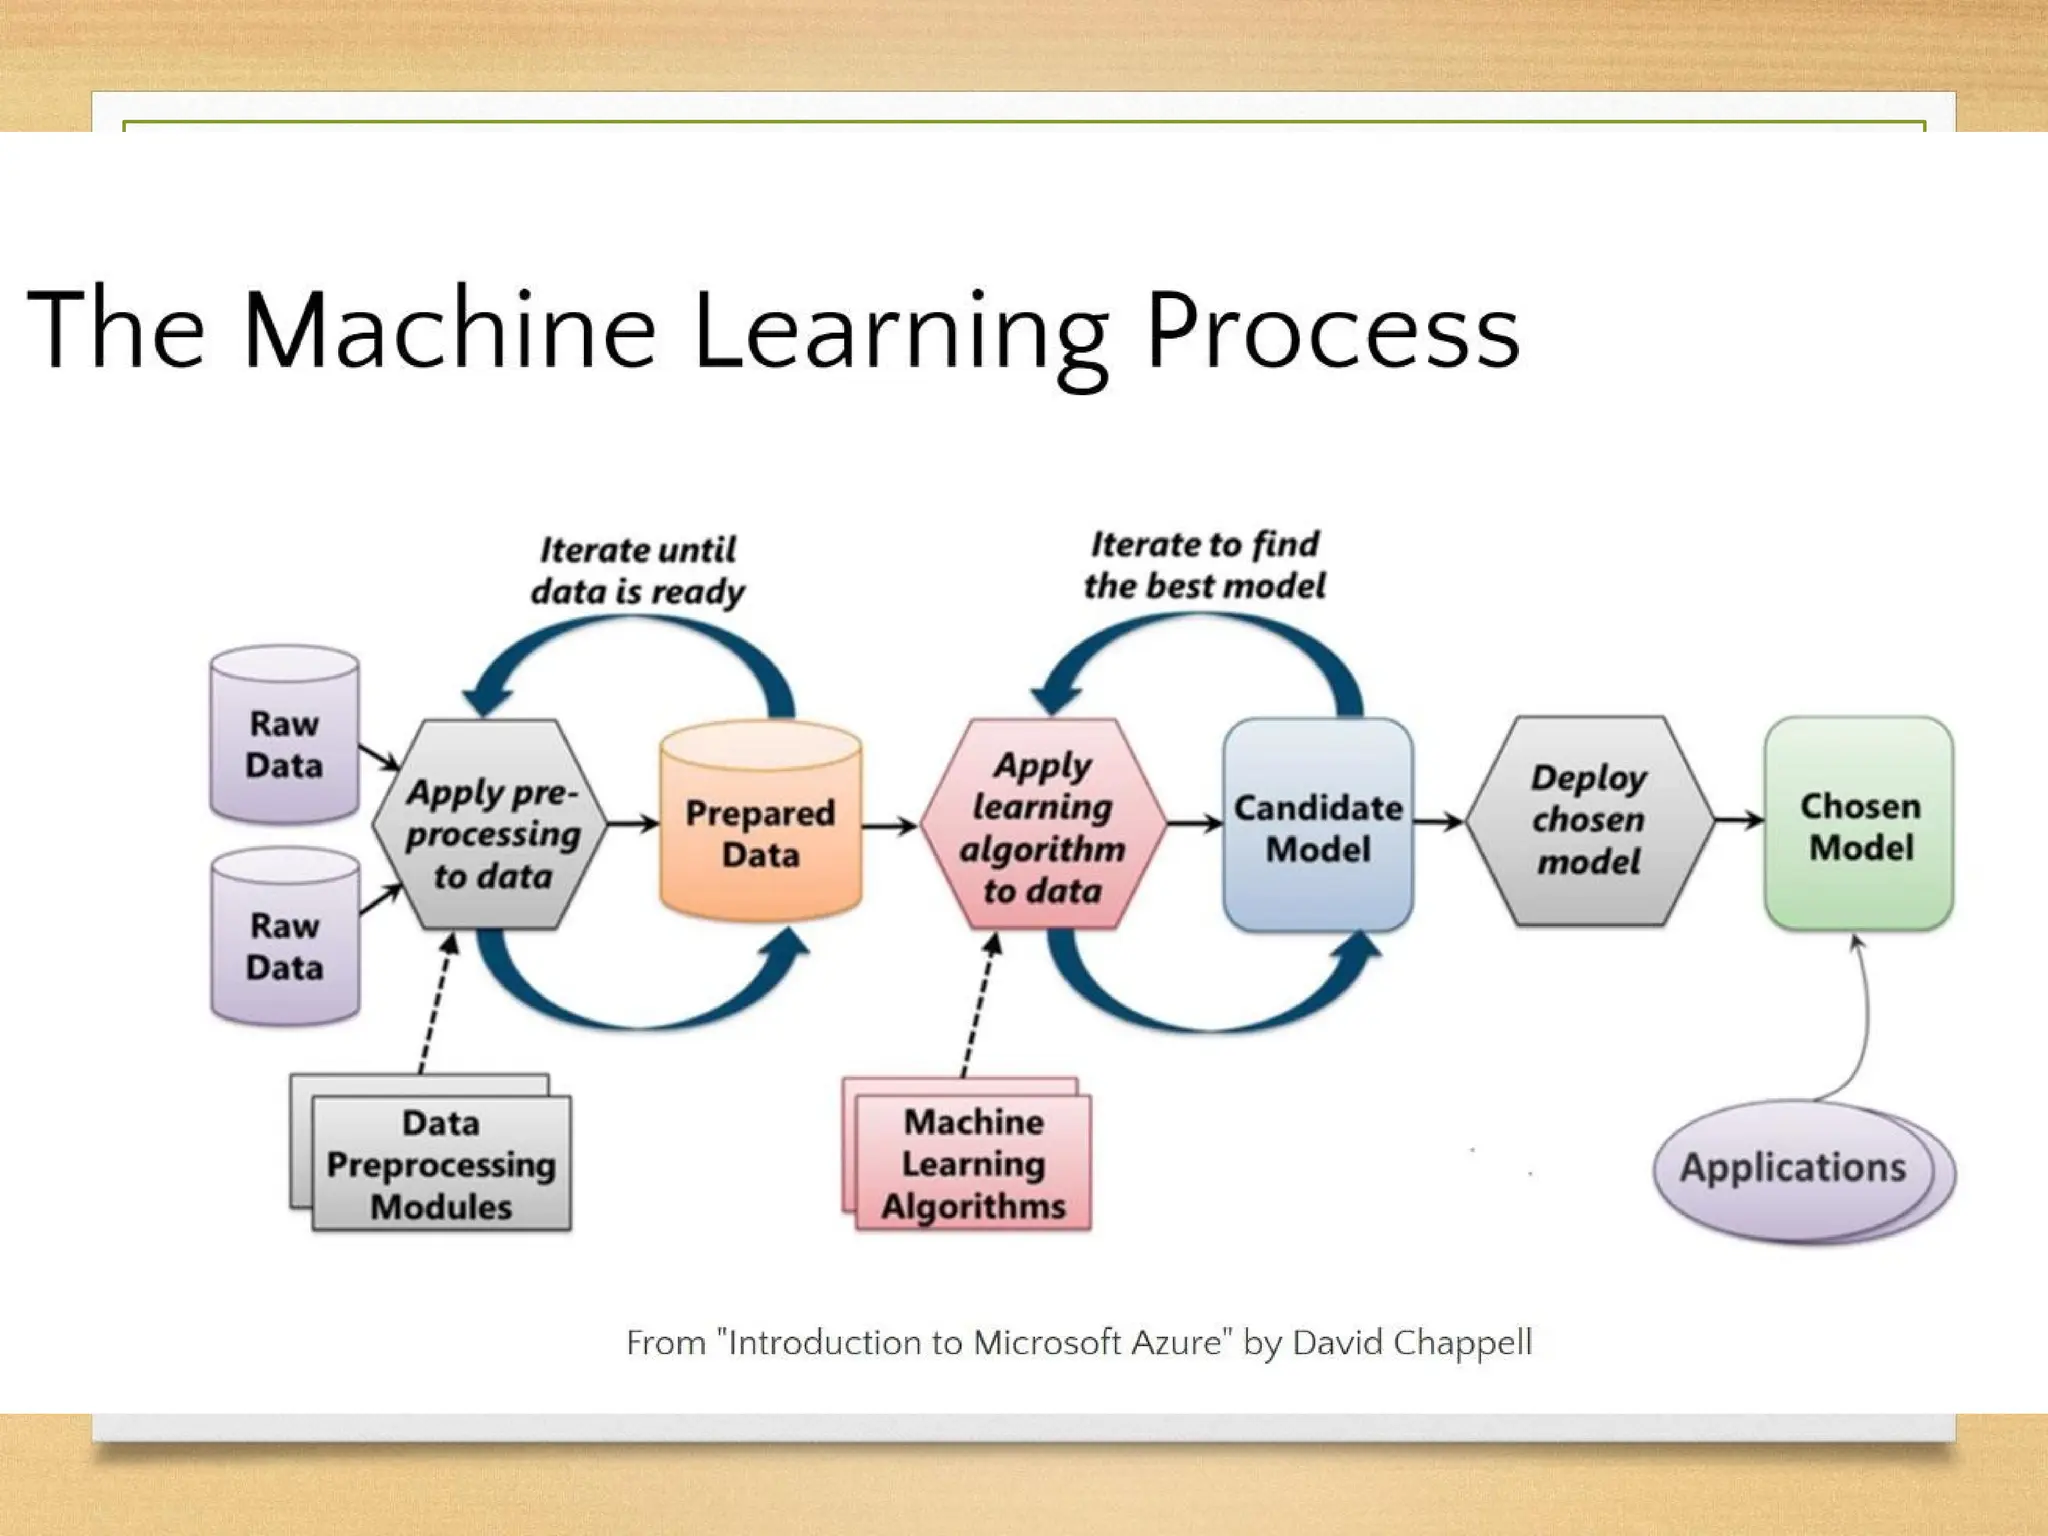
Data Pre Processing
•Def 1- Data preprocessing is a data mining technique
that involves transforming raw data into an
understandable format. Real-world data is often
incomplete, inconsistent, and/or lacking in certain
behaviors or trends, and is likely to contain many
errors. Data preprocessing is a proven method of
resolving such issues.
• Def 2- Data preprocessing refers to the process of
preparing raw data for analysis. This involves several
tasks or steps that are essential for ensuring that the
data is accurate, consistent, and ready for analysis.
45.
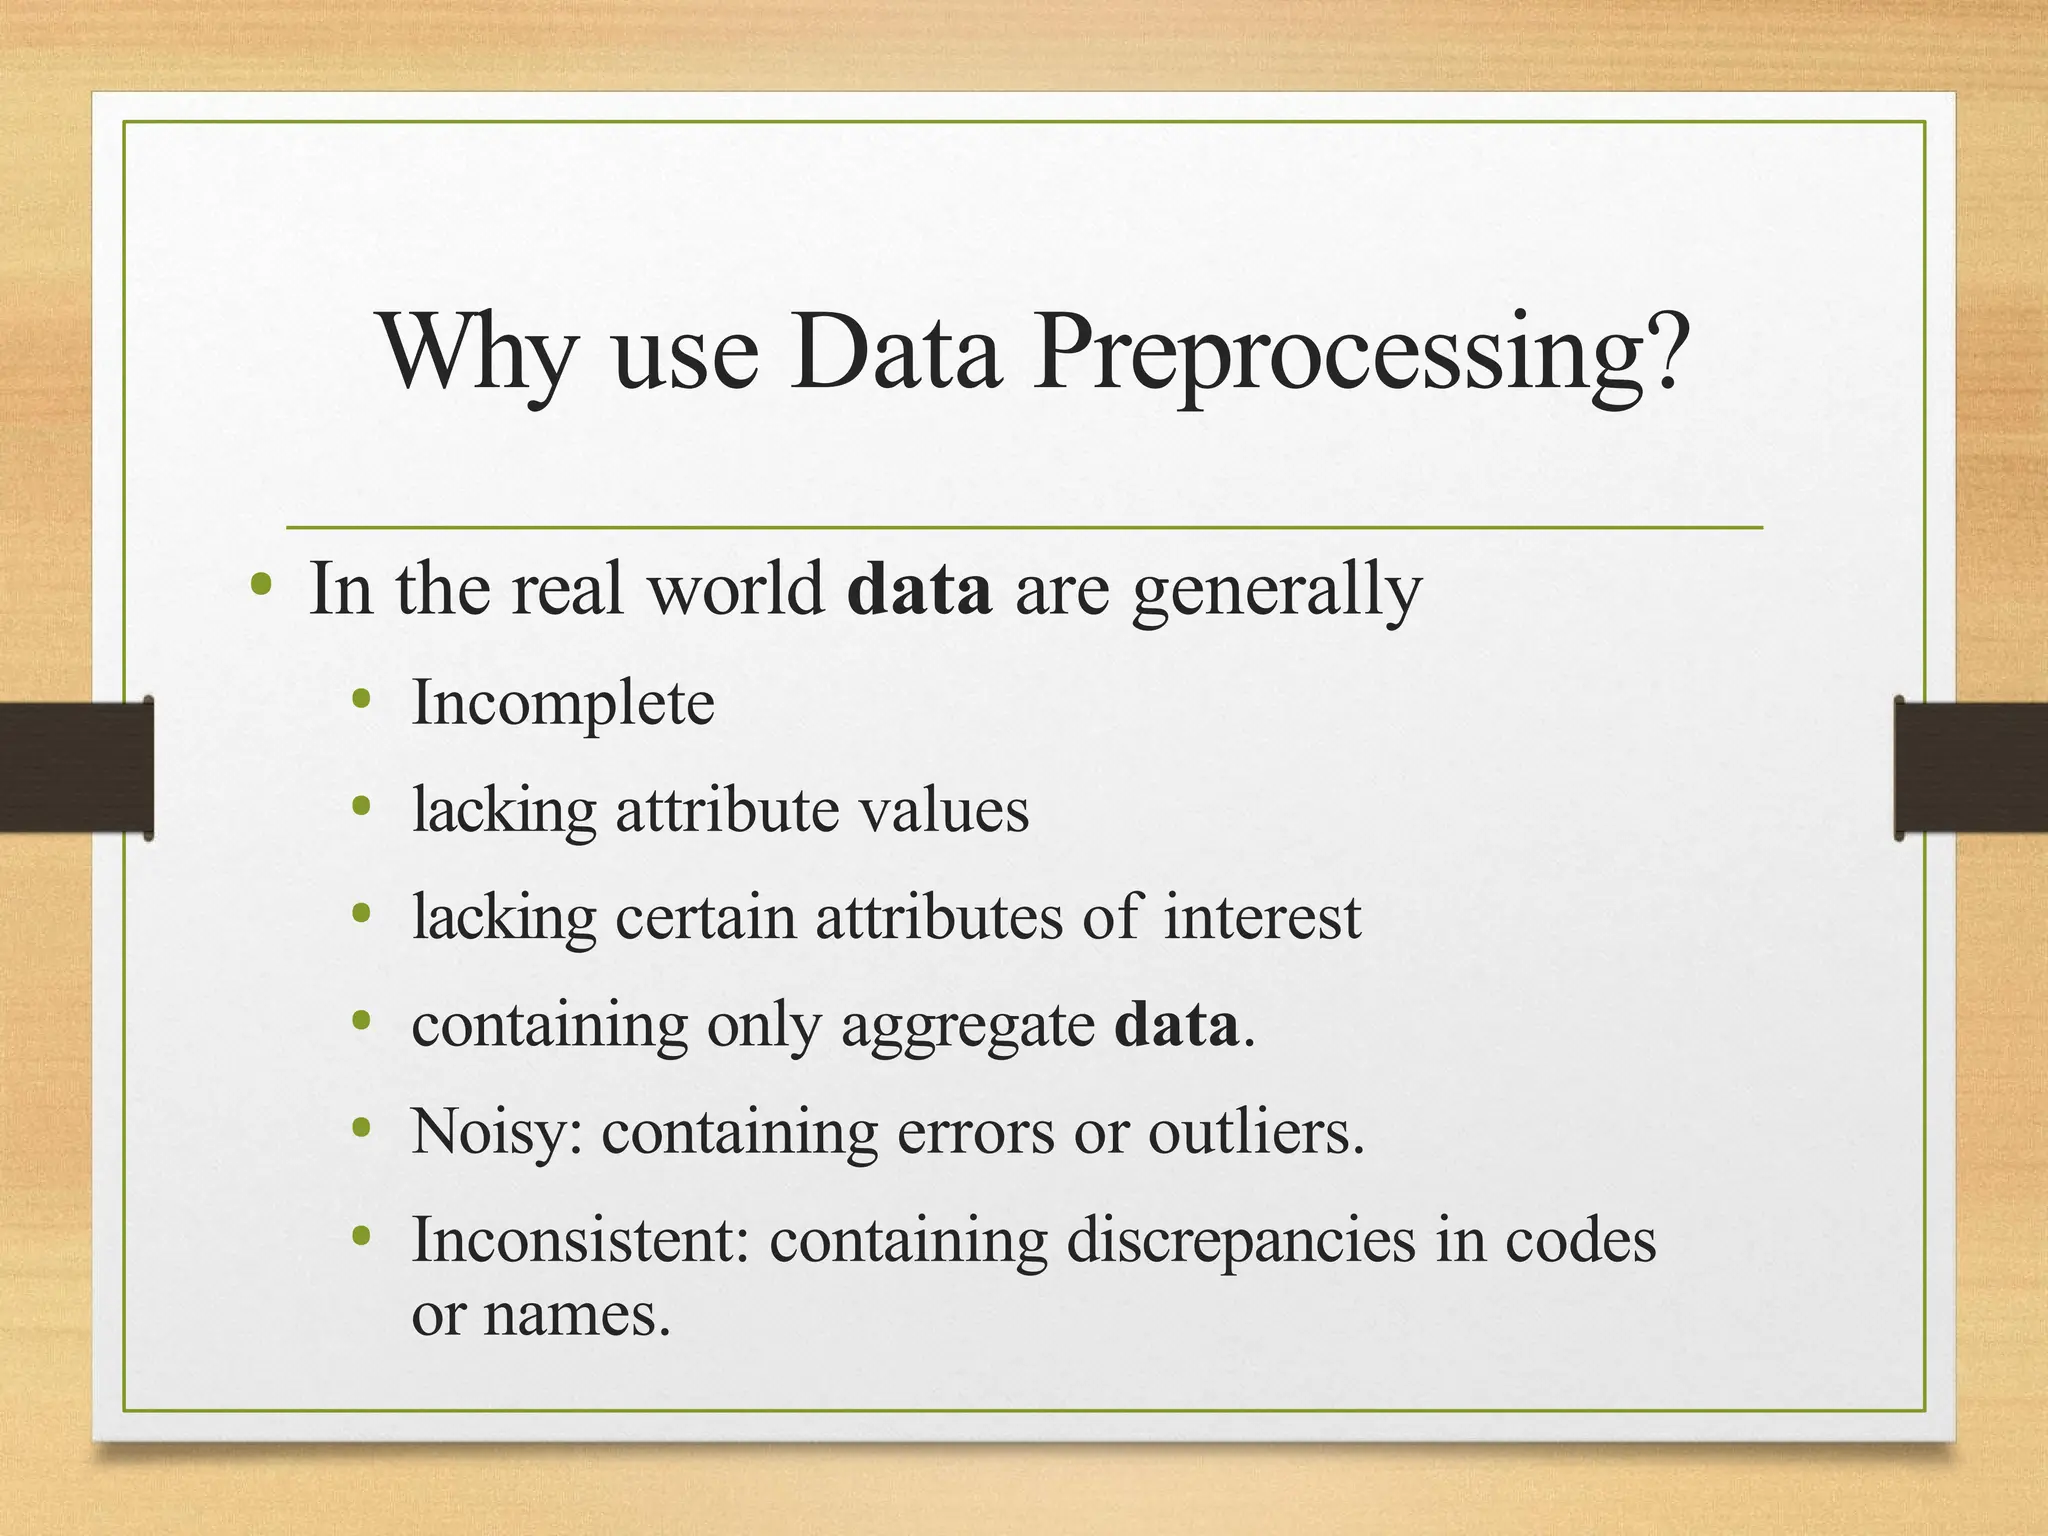
Why use DataPreprocessing?
• In the real world data are generally
• Incomplete
• lacking attribute values
• lacking certain attributes of interest
• containing only aggregate data.
• Noisy: containing errors or outliers.
• Inconsistent: containing discrepancies in codes
or names.
47.
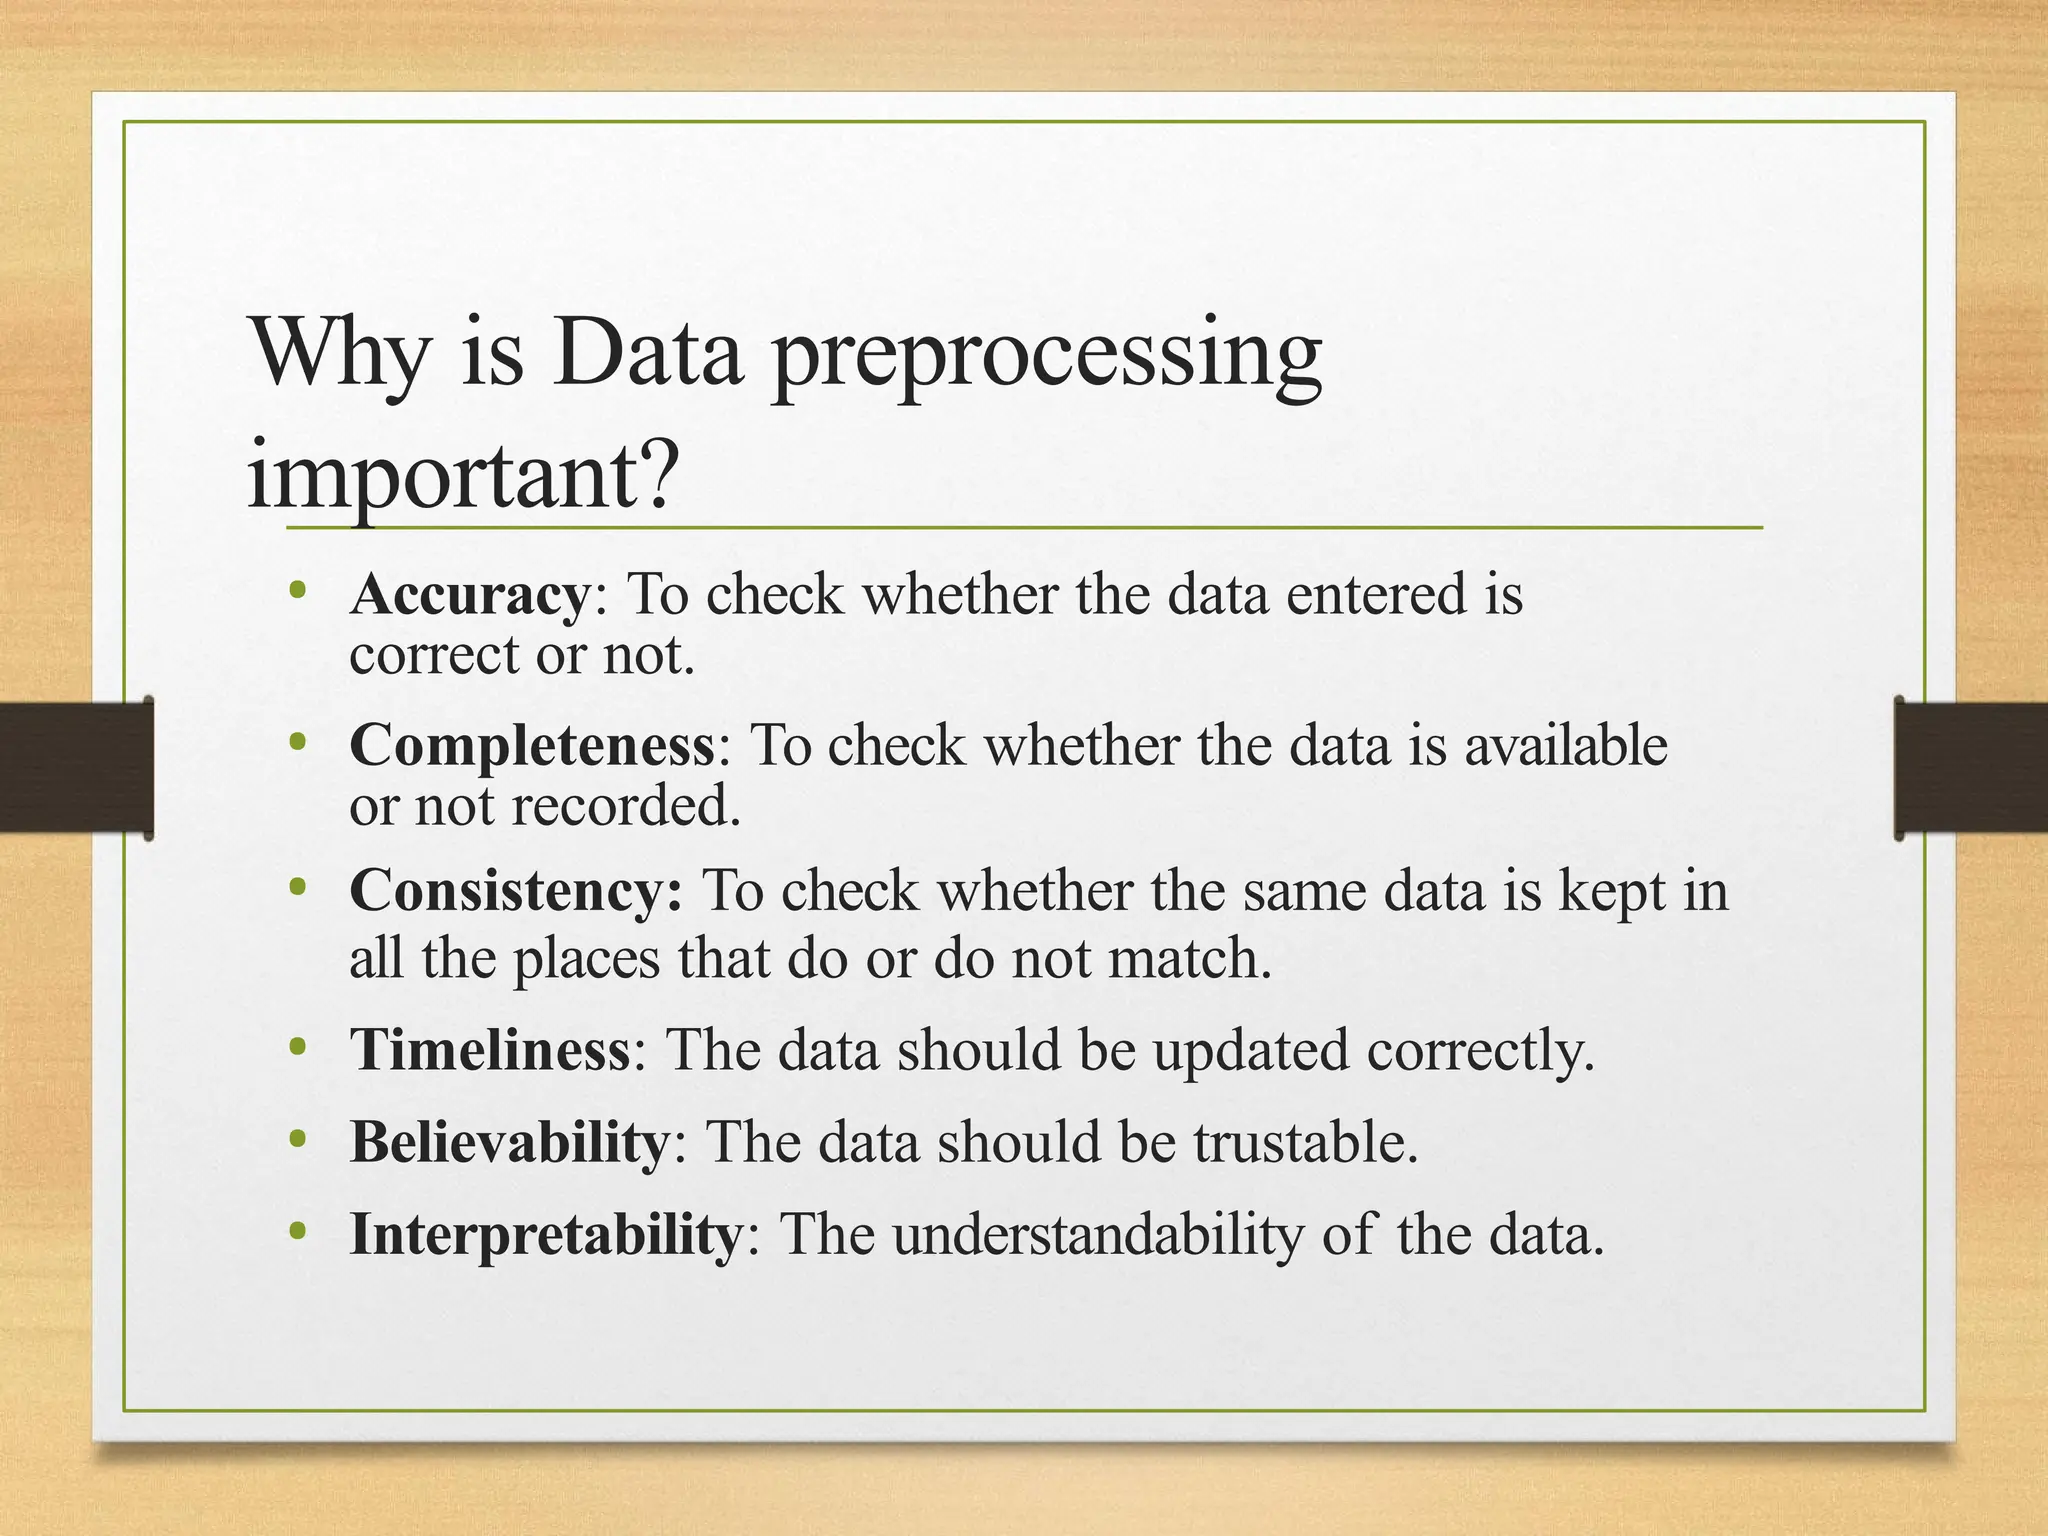
Why is Datapreprocessing
important?
• Accuracy: To check whether the data entered is
correct or not.
• Completeness: To check whether the data is available
or not recorded.
• Consistency: To check whether the same data is kept in
all the places that do or do not match.
• Timeliness: The data should be updated correctly.
• Believability: The data should be trustable.
• Interpretability: The understandability of the data.
48.
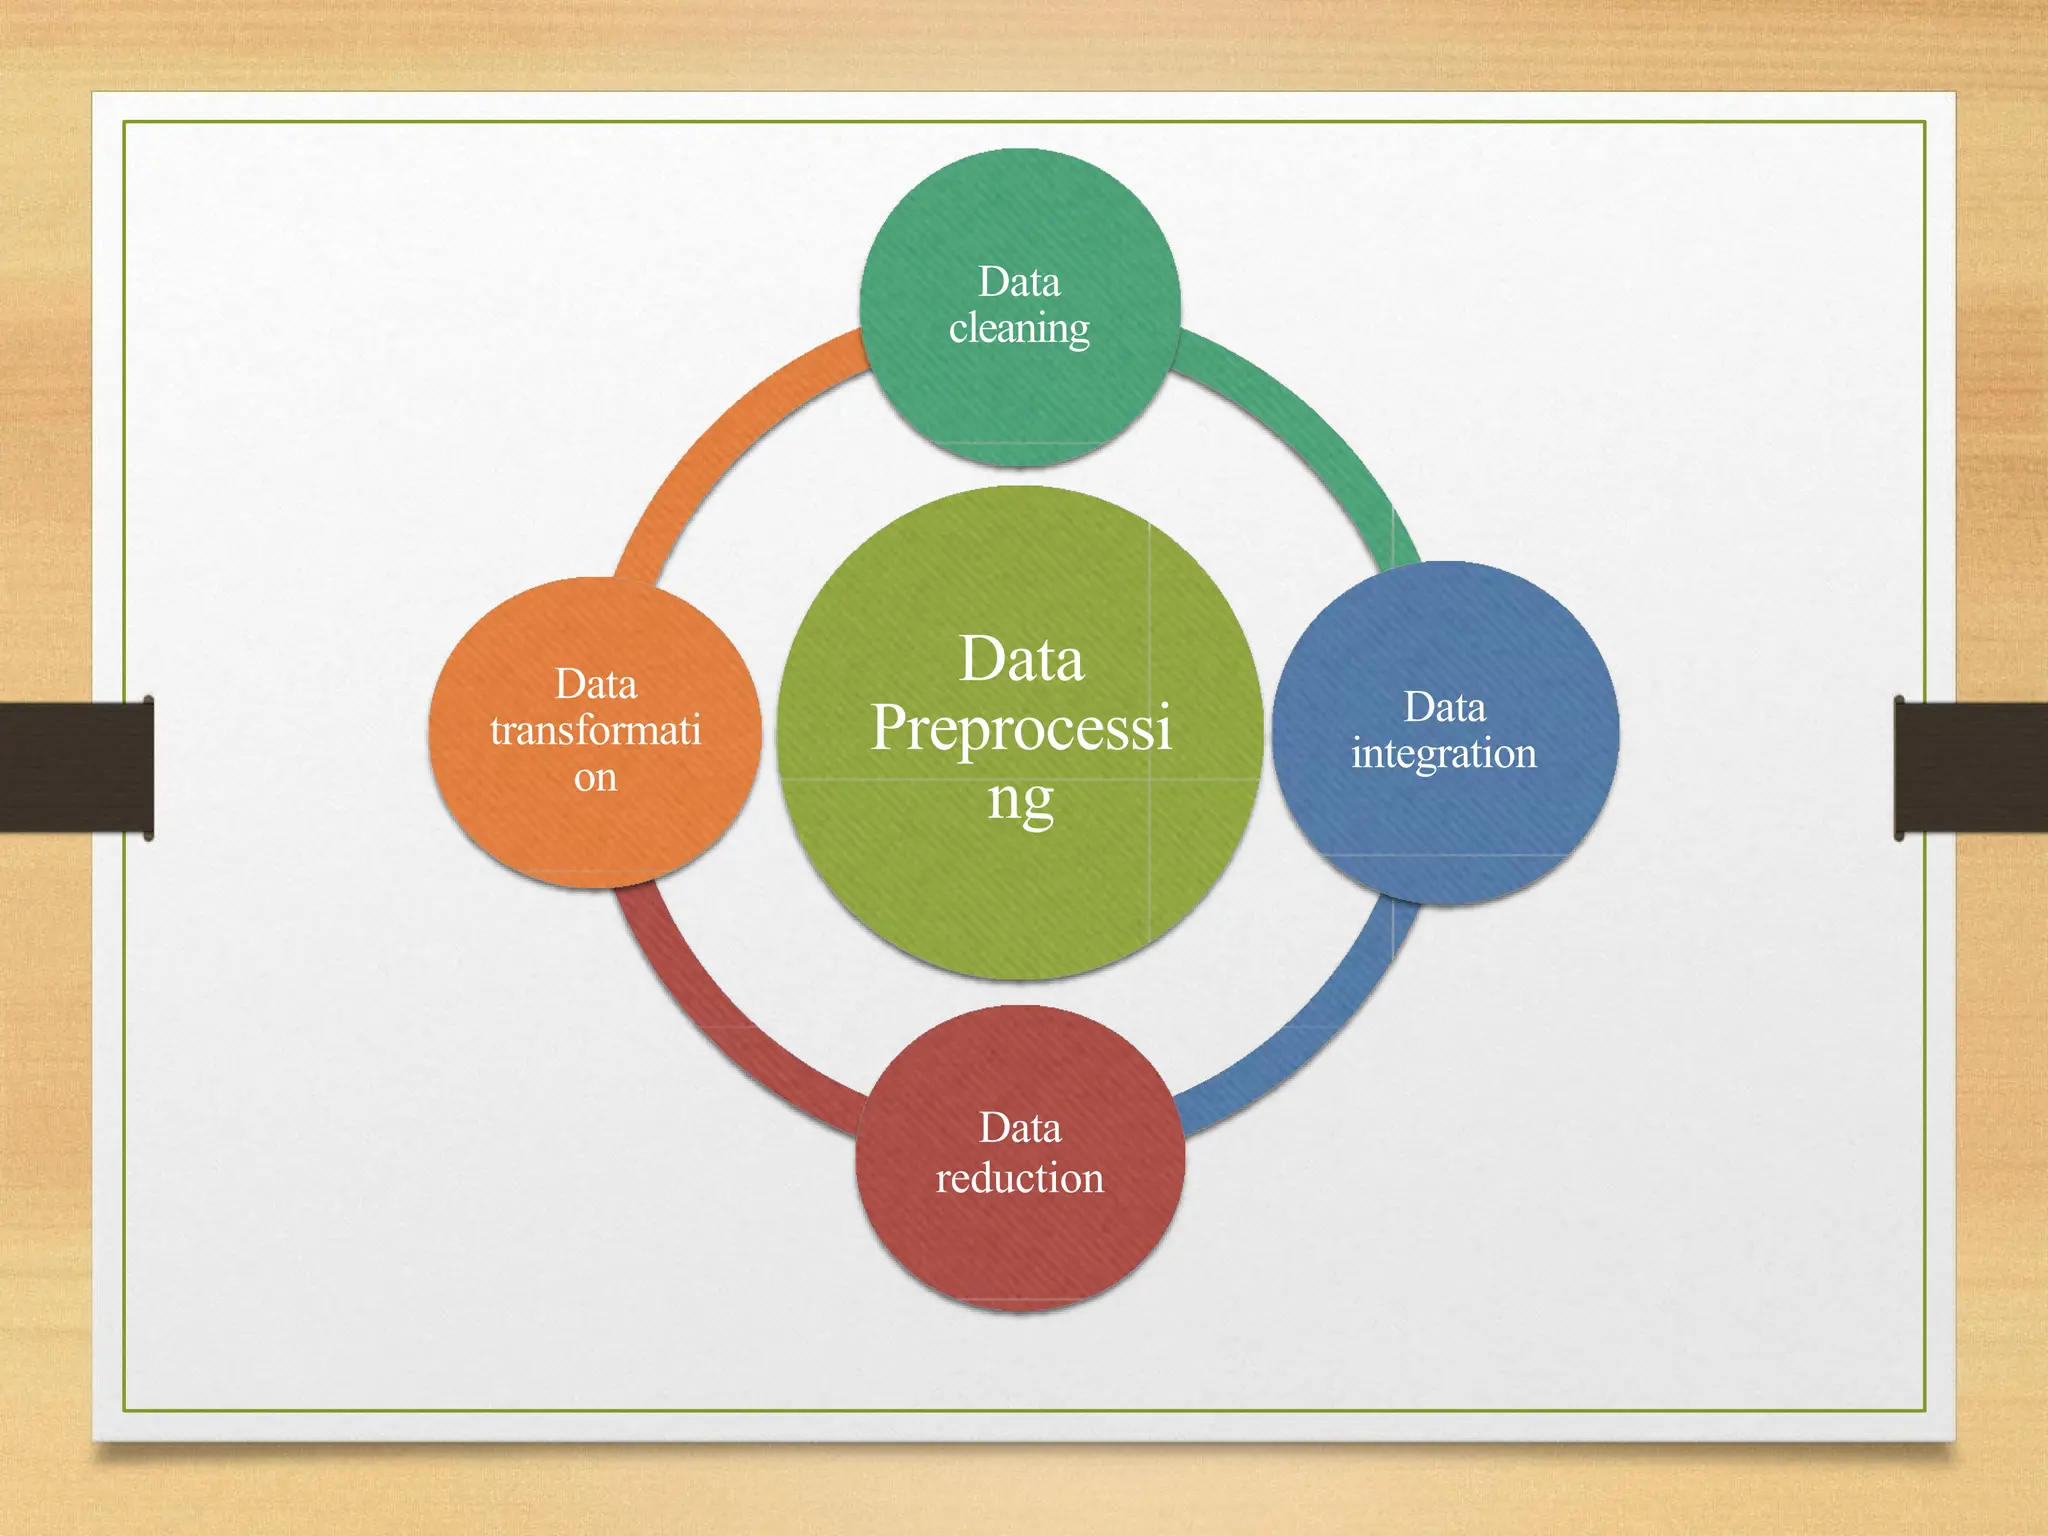
Major Tasks inData Preprocessing:
• Data Cleaning
• Data Integration
• Data Reduction
• Data Transformation
Data Cleaning
• Datacleaning (or data cleansing) routines attempt to
fill in missing values, smooth out noise
while identifying outliers, and correct
inconsistencies in the data
• Data cleaning is the process to remove incorrect
data, incomplete data and inaccurate data
from the datasets, and it also replaces the
missing values.
51.
Main methods ofData
Cleaning
• Removing duplicates
• Handling missing
data
• Handling outliers
• Data normalization
• Data standardization
• Data validation
• Data formatting
52.
Removing Duplicates
• Removingduplicates is an essential step in data cleaning, as
duplicate records or observations can skew the results of data
analysis, and take up valuable storage space. In this process,
we identify and remove records that are identical in all or
some of their attributes, leaving behind only a unique set of
records.
• Here are some common techniques for removing duplicates
in data cleaning:
• Dropping exact duplicates: This involves identifying records
that are identical in all attributes and dropping all but one of
them.
53.
Removing Duplicates
• Fuzzymatching: In some cases, records may not be identical
but may be similar enough to be considered duplicates. Fuzzy
matching techniques can be used to identify these records based
on attributes that may contain spelling errors, abbreviations, or
variations in formatting. For example, a fuzzy matching
algorithm may identify "John Doe" and "Jon Doe" as potential
duplicates.
• Key-based deduplication: This involves identifying a unique
identifier or key attribute for each record and removing
duplicates based on that key. For example, in a dataset of
customer orders, each order may have a unique order ID. By
identifying the order ID as the key attribute, duplicates can be
removed based on that key.
54.
Handling missing values
•Handling missing data is an important step in data
cleaning, as missing data can significantly affect
the accuracy and completeness of the dataset.
• Missing data can be caused by a variety of reasons,
such as human error, technical issues, or
incomplete data collection.
• In this process, we need to identify the missing
data and decide how to handle it.
55.
Handling missing values
•Ignore the tuple (row)
• This is usually done when the class label is
missing / or the primary key is missing
• This method is not very effective, unless the tuple
contains several attributes with missing values
• Solution : Standard values like “Not Available”
or “NA” can be used to replace the missing
values.
56.
Handling missing values
•Fill in the missing value manually
• In general, this approach is time-consuming and
may not be feasible given a large data set with many
missing values.
57.
Handling missing values
•Use a global constant to fill in the missing value:
• Replace all missing attribute values by the same constant,
such as a label like “Unknown” or ∞.
• If missing values are replaced by, say, “Unknown,” then
the mining program may mistakenly think that they
form an interesting concept, since they all have a value
in common—that of “Unknown.”
• Hence, although this method is simple, it is not
foolproof.
58.
Handling missing values
•Use a measure of central tendency
• use the attribute (such as the mean or median) to
fill in the missing value
• For normal (symmetric) data distributions, the
mean
can be used,
• while skewed data distribution should employ
the median
59.
Handling missing values
•Use the attribute mean or median for all
samples belonging to the same class as the given
tuple
• For example, if classifying customers according to
credit risk, we may replace the missing value with
the average income value for customers in the
same credit risk category as that of the given
tuple.
60.
Handling missing values
•Use the most probable value to fill in the missing
value:
• This may be determined with regression, inference-
based tools using a Bayesian formalism, or decision
tree induction. For example, using the other
customer attributes in your data set, you may
construct a decision tree to predict the missing
values for income.
61.
Noisy Data
• Noisygenerally means random error or
containing unnecessary data points.
• Binning: This method is to smooth or handle
noisy data. First, the data is sorted and then the
sorted values are separated and stored in the form
of bins. There are three methods for smoothing
data in the bin.
62.
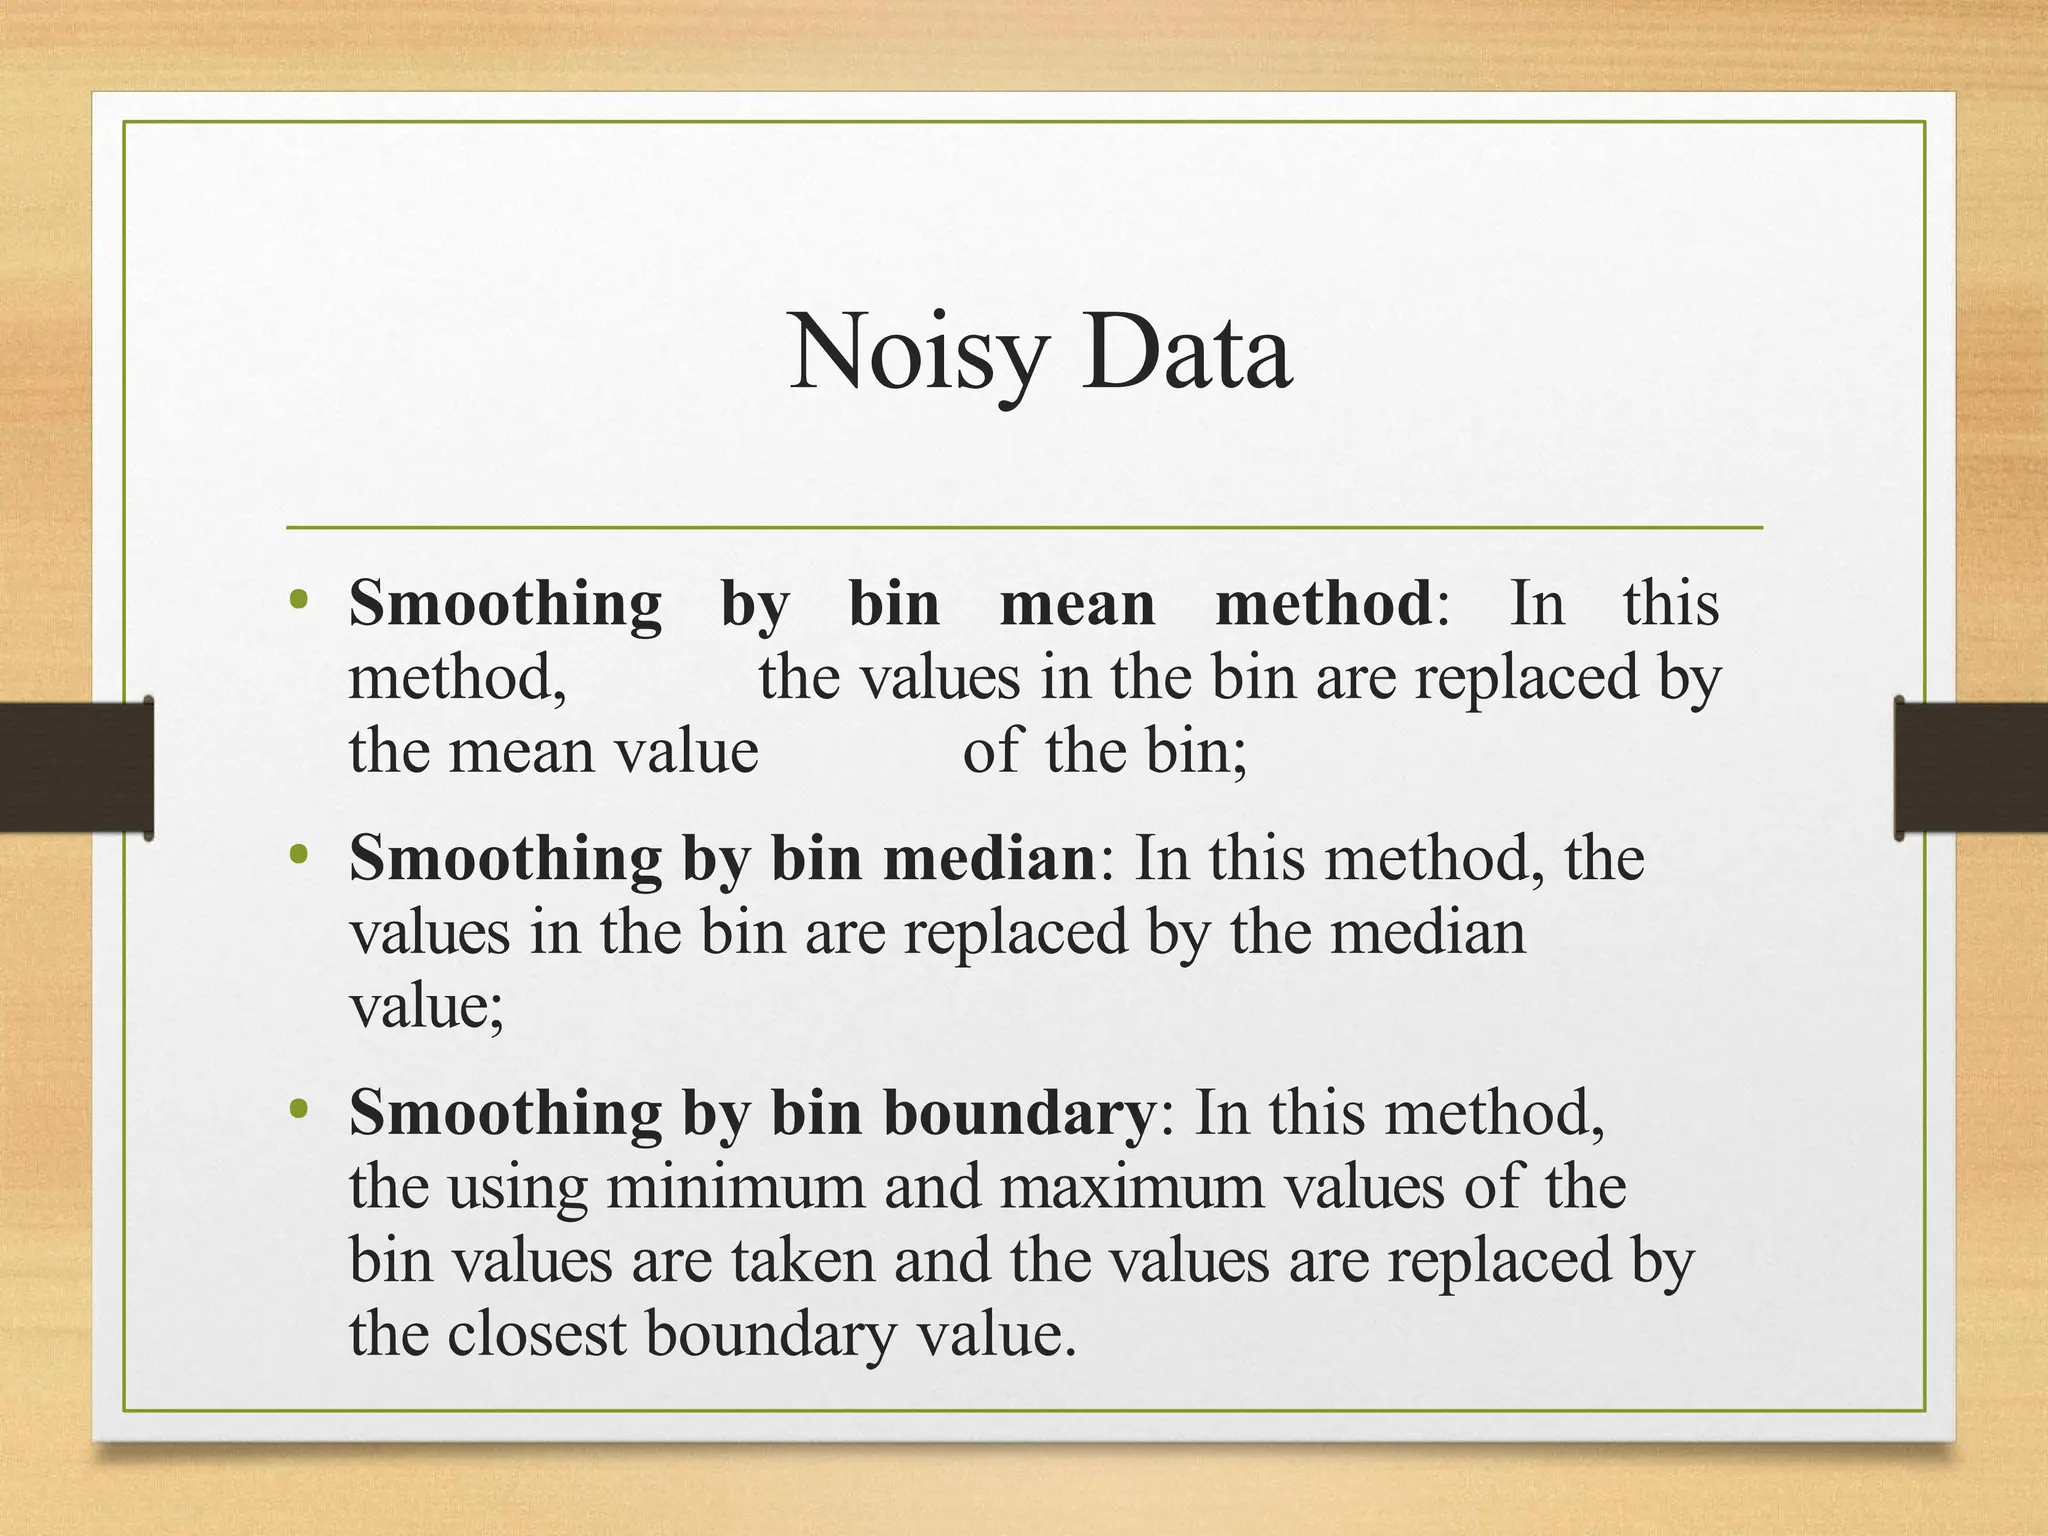
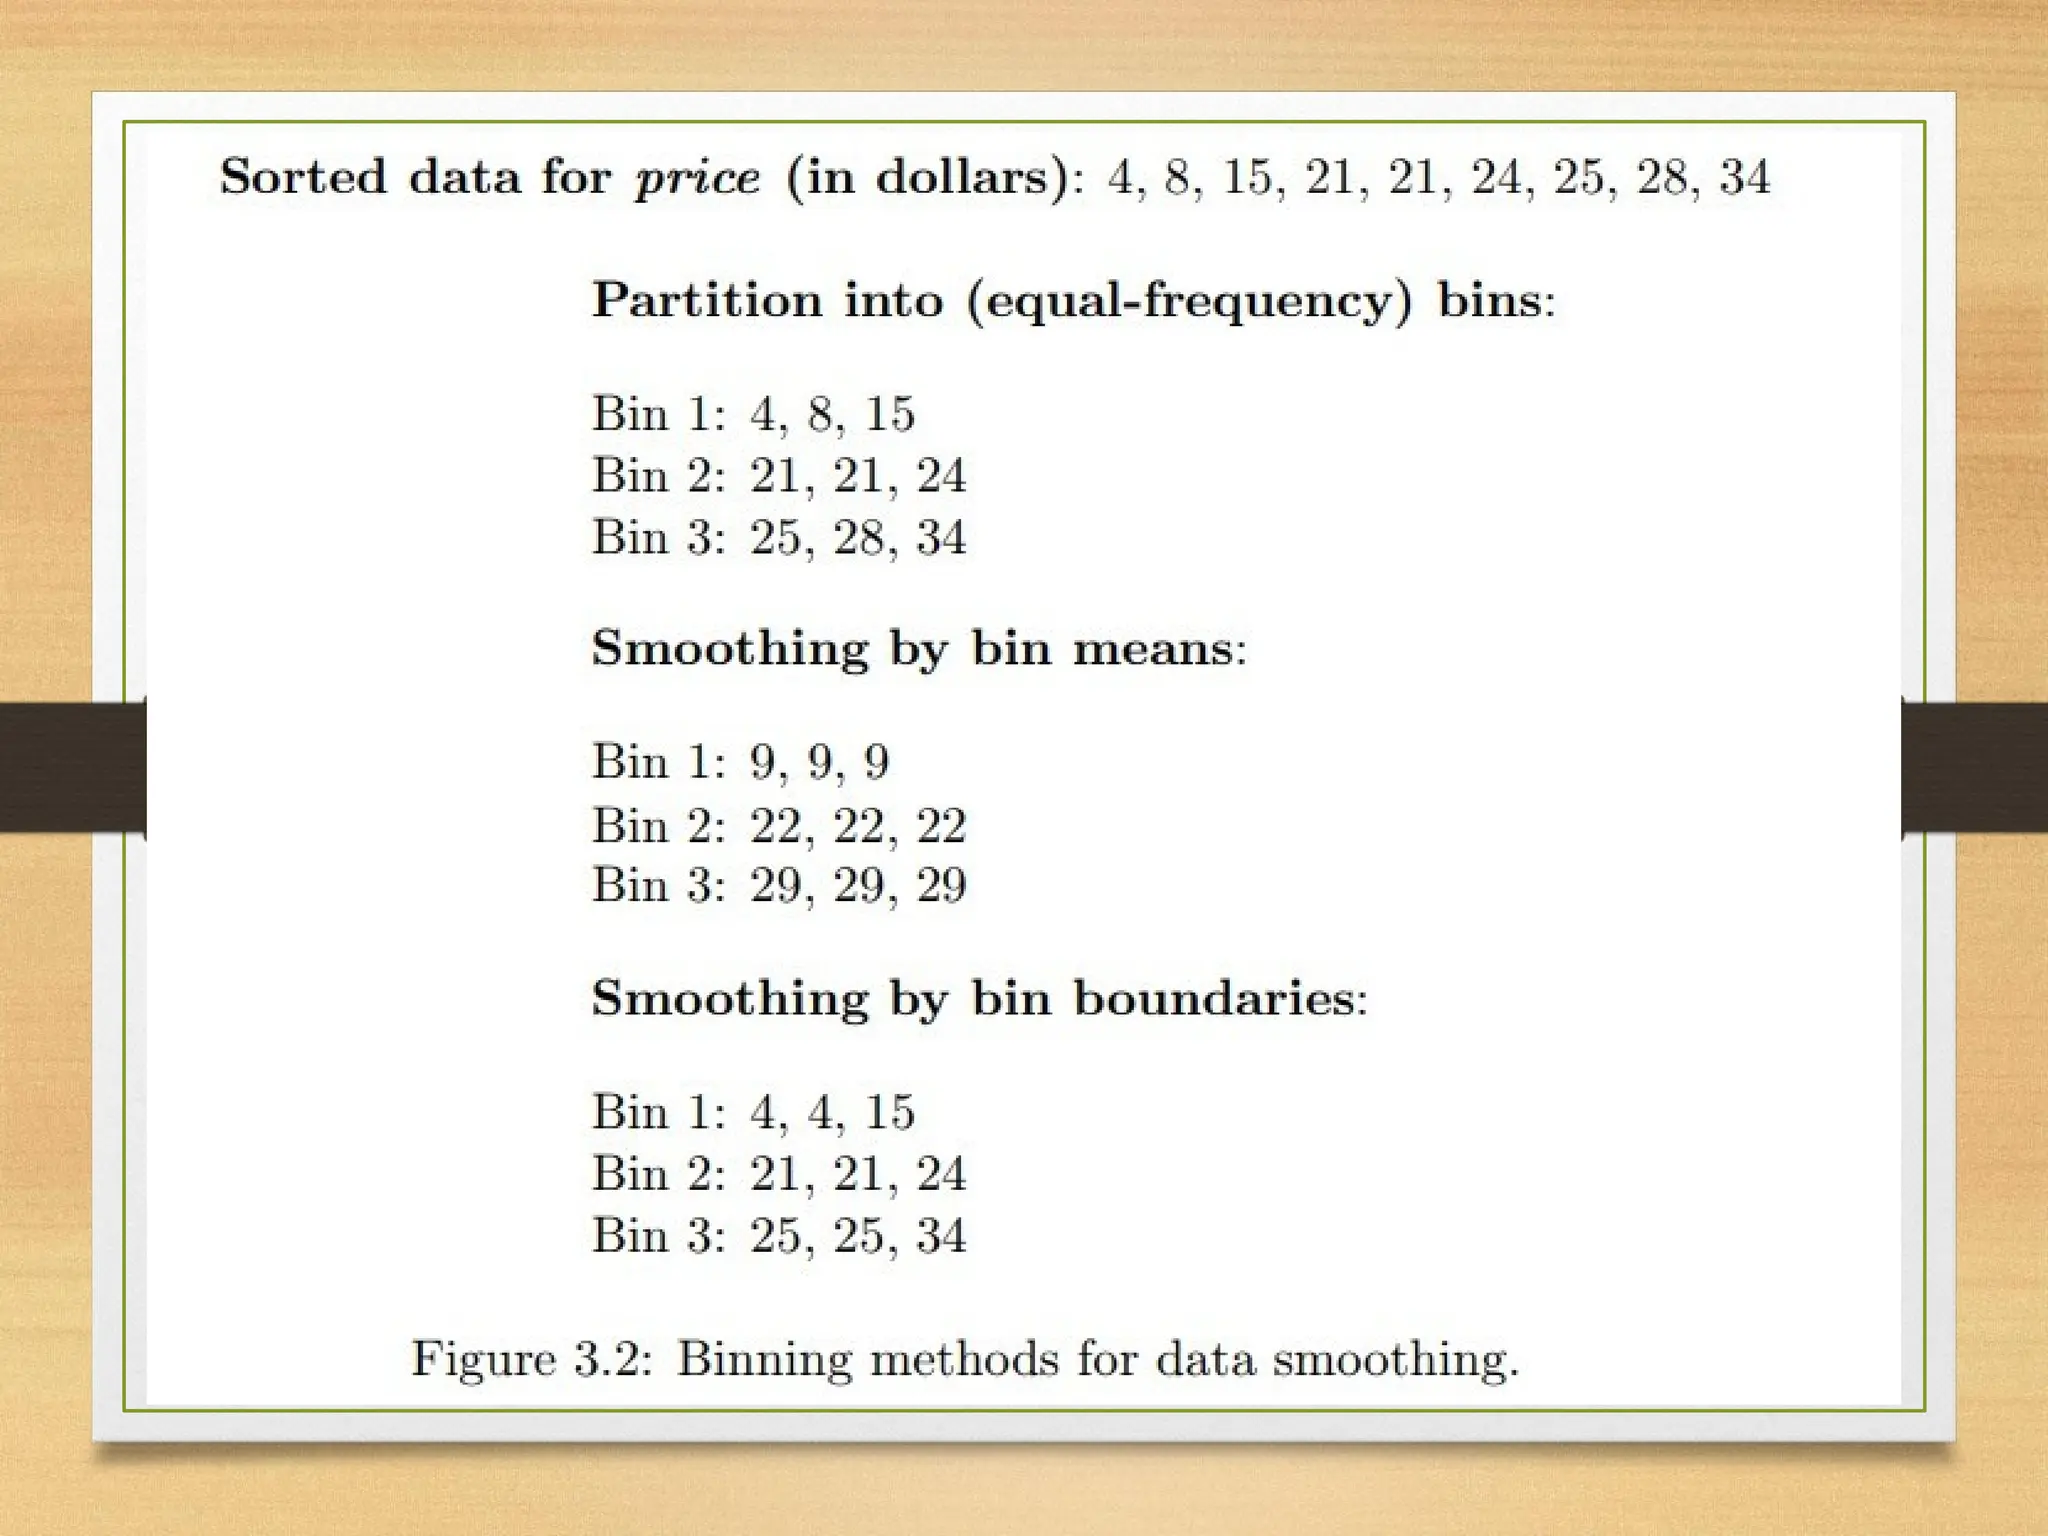
Noisy Data
• Smoothingby bin mean method: In this
method, the values in the bin are replaced by
the mean value of the bin;
• Smoothing by bin median: In this method, the
values in the bin are replaced by the median
value;
• Smoothing by bin boundary: In this method,
the using minimum and maximum values of the
bin values are taken and the values are replaced by
the closest boundary value.
63.
Mean, Median,
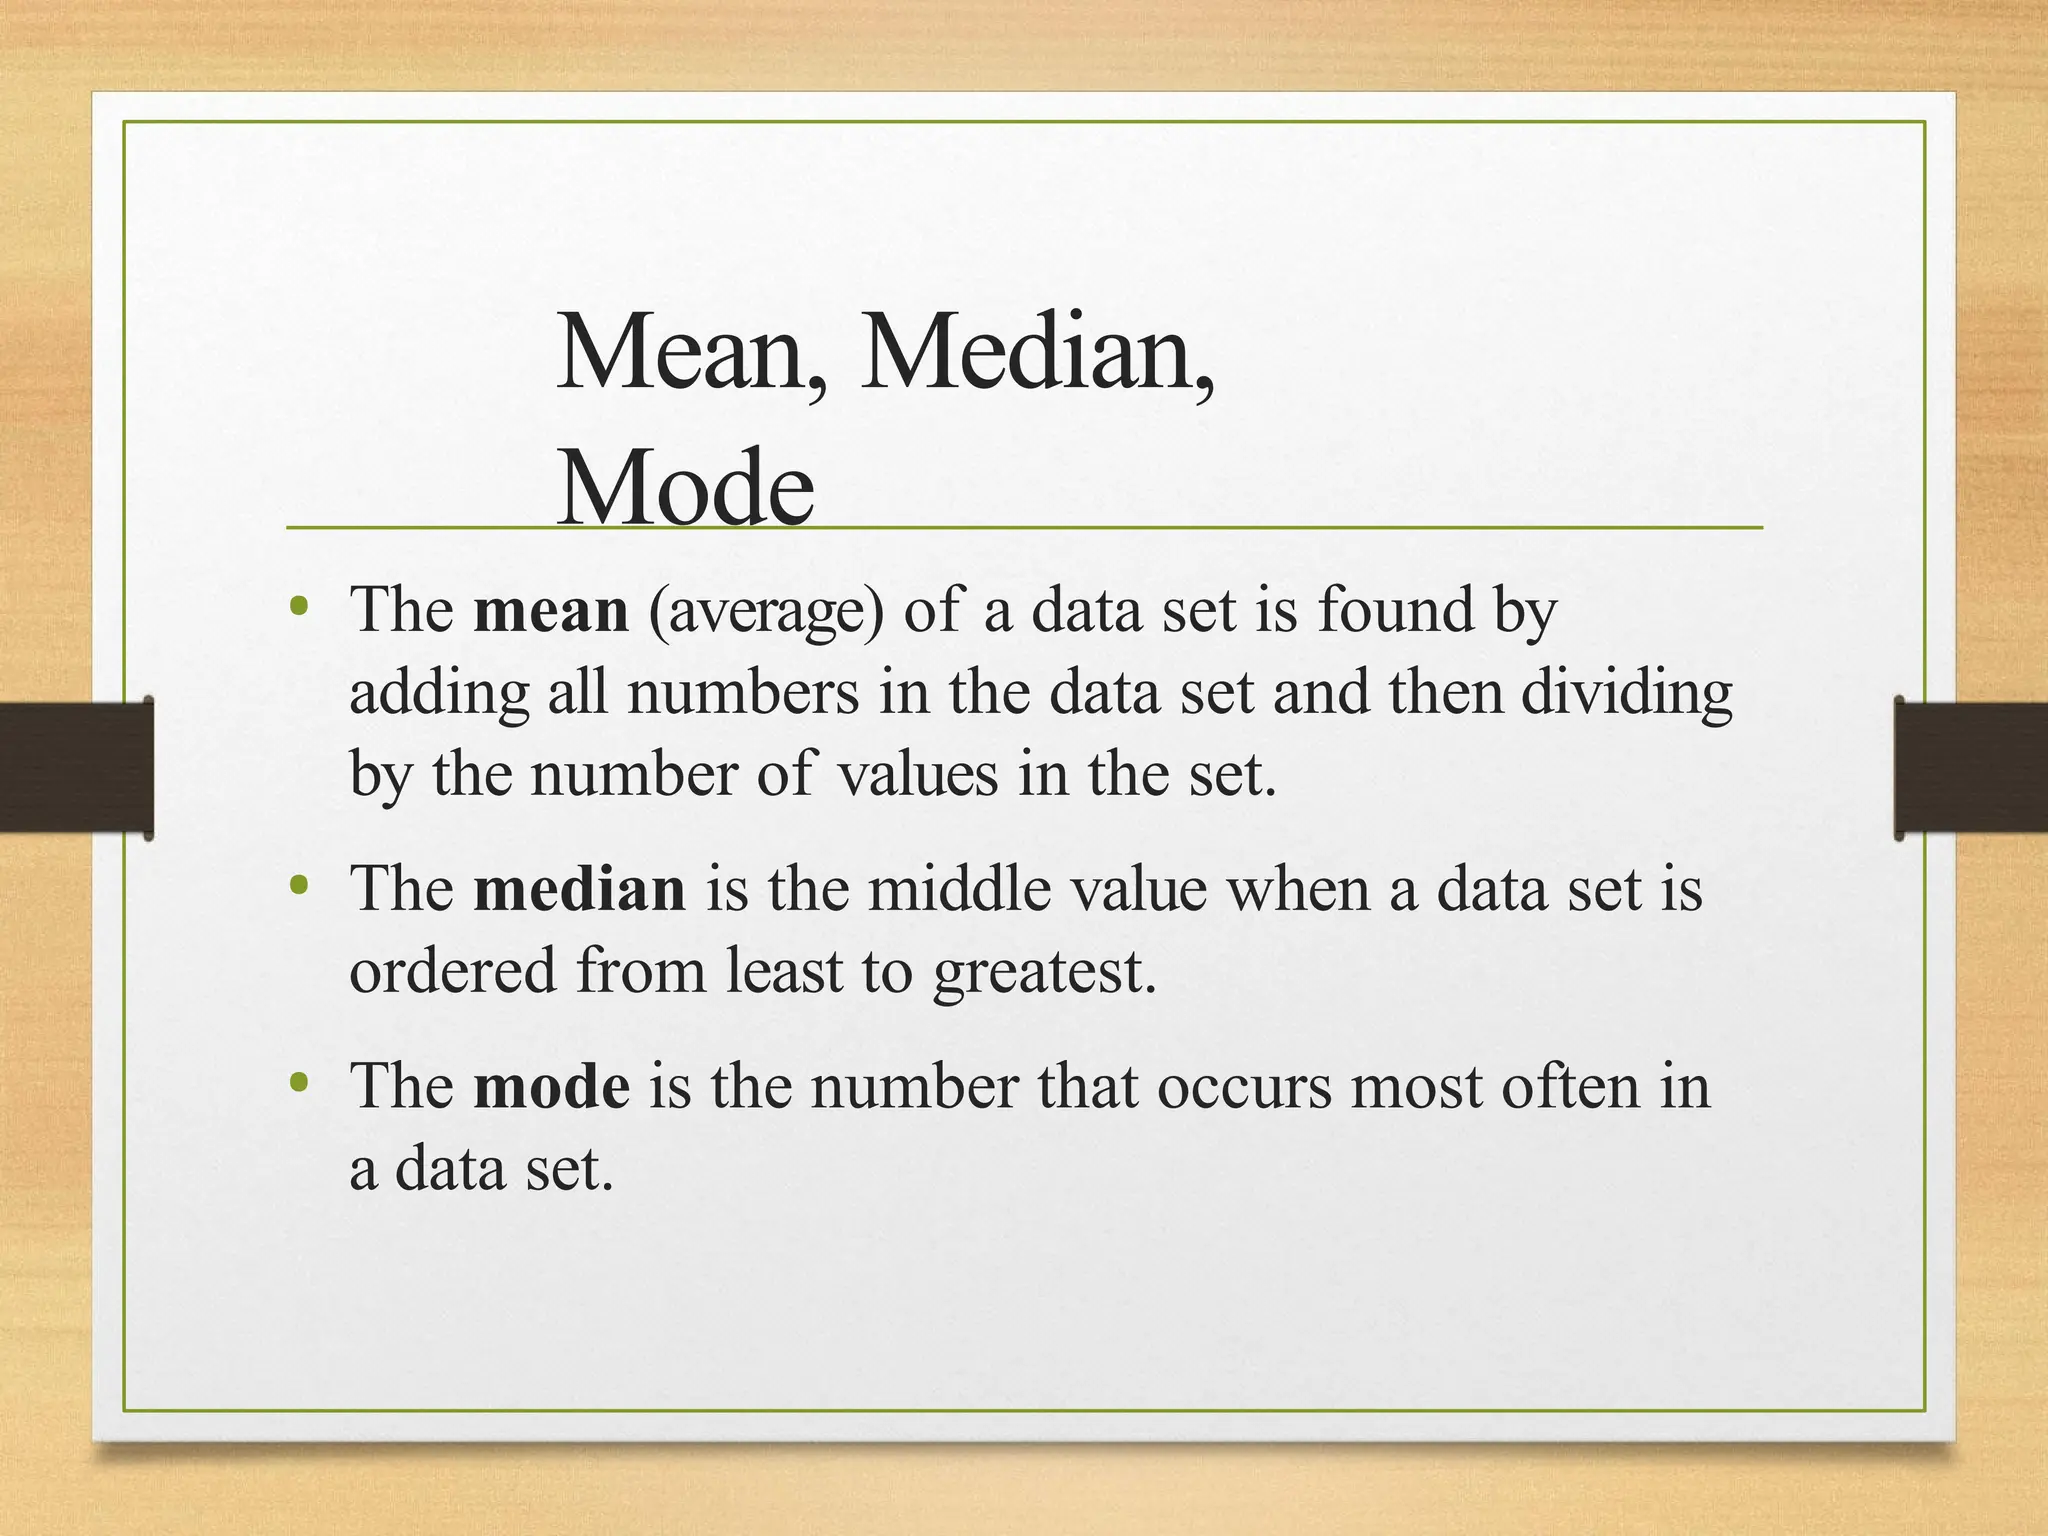
Mode
• Themean (average) of a data set is found by
adding all numbers in the data set and then dividing
by the number of values in the set.
• The median is the middle value when a data set is
ordered from least to greatest.
• The mode is the number that occurs most often in
a data set.
65.
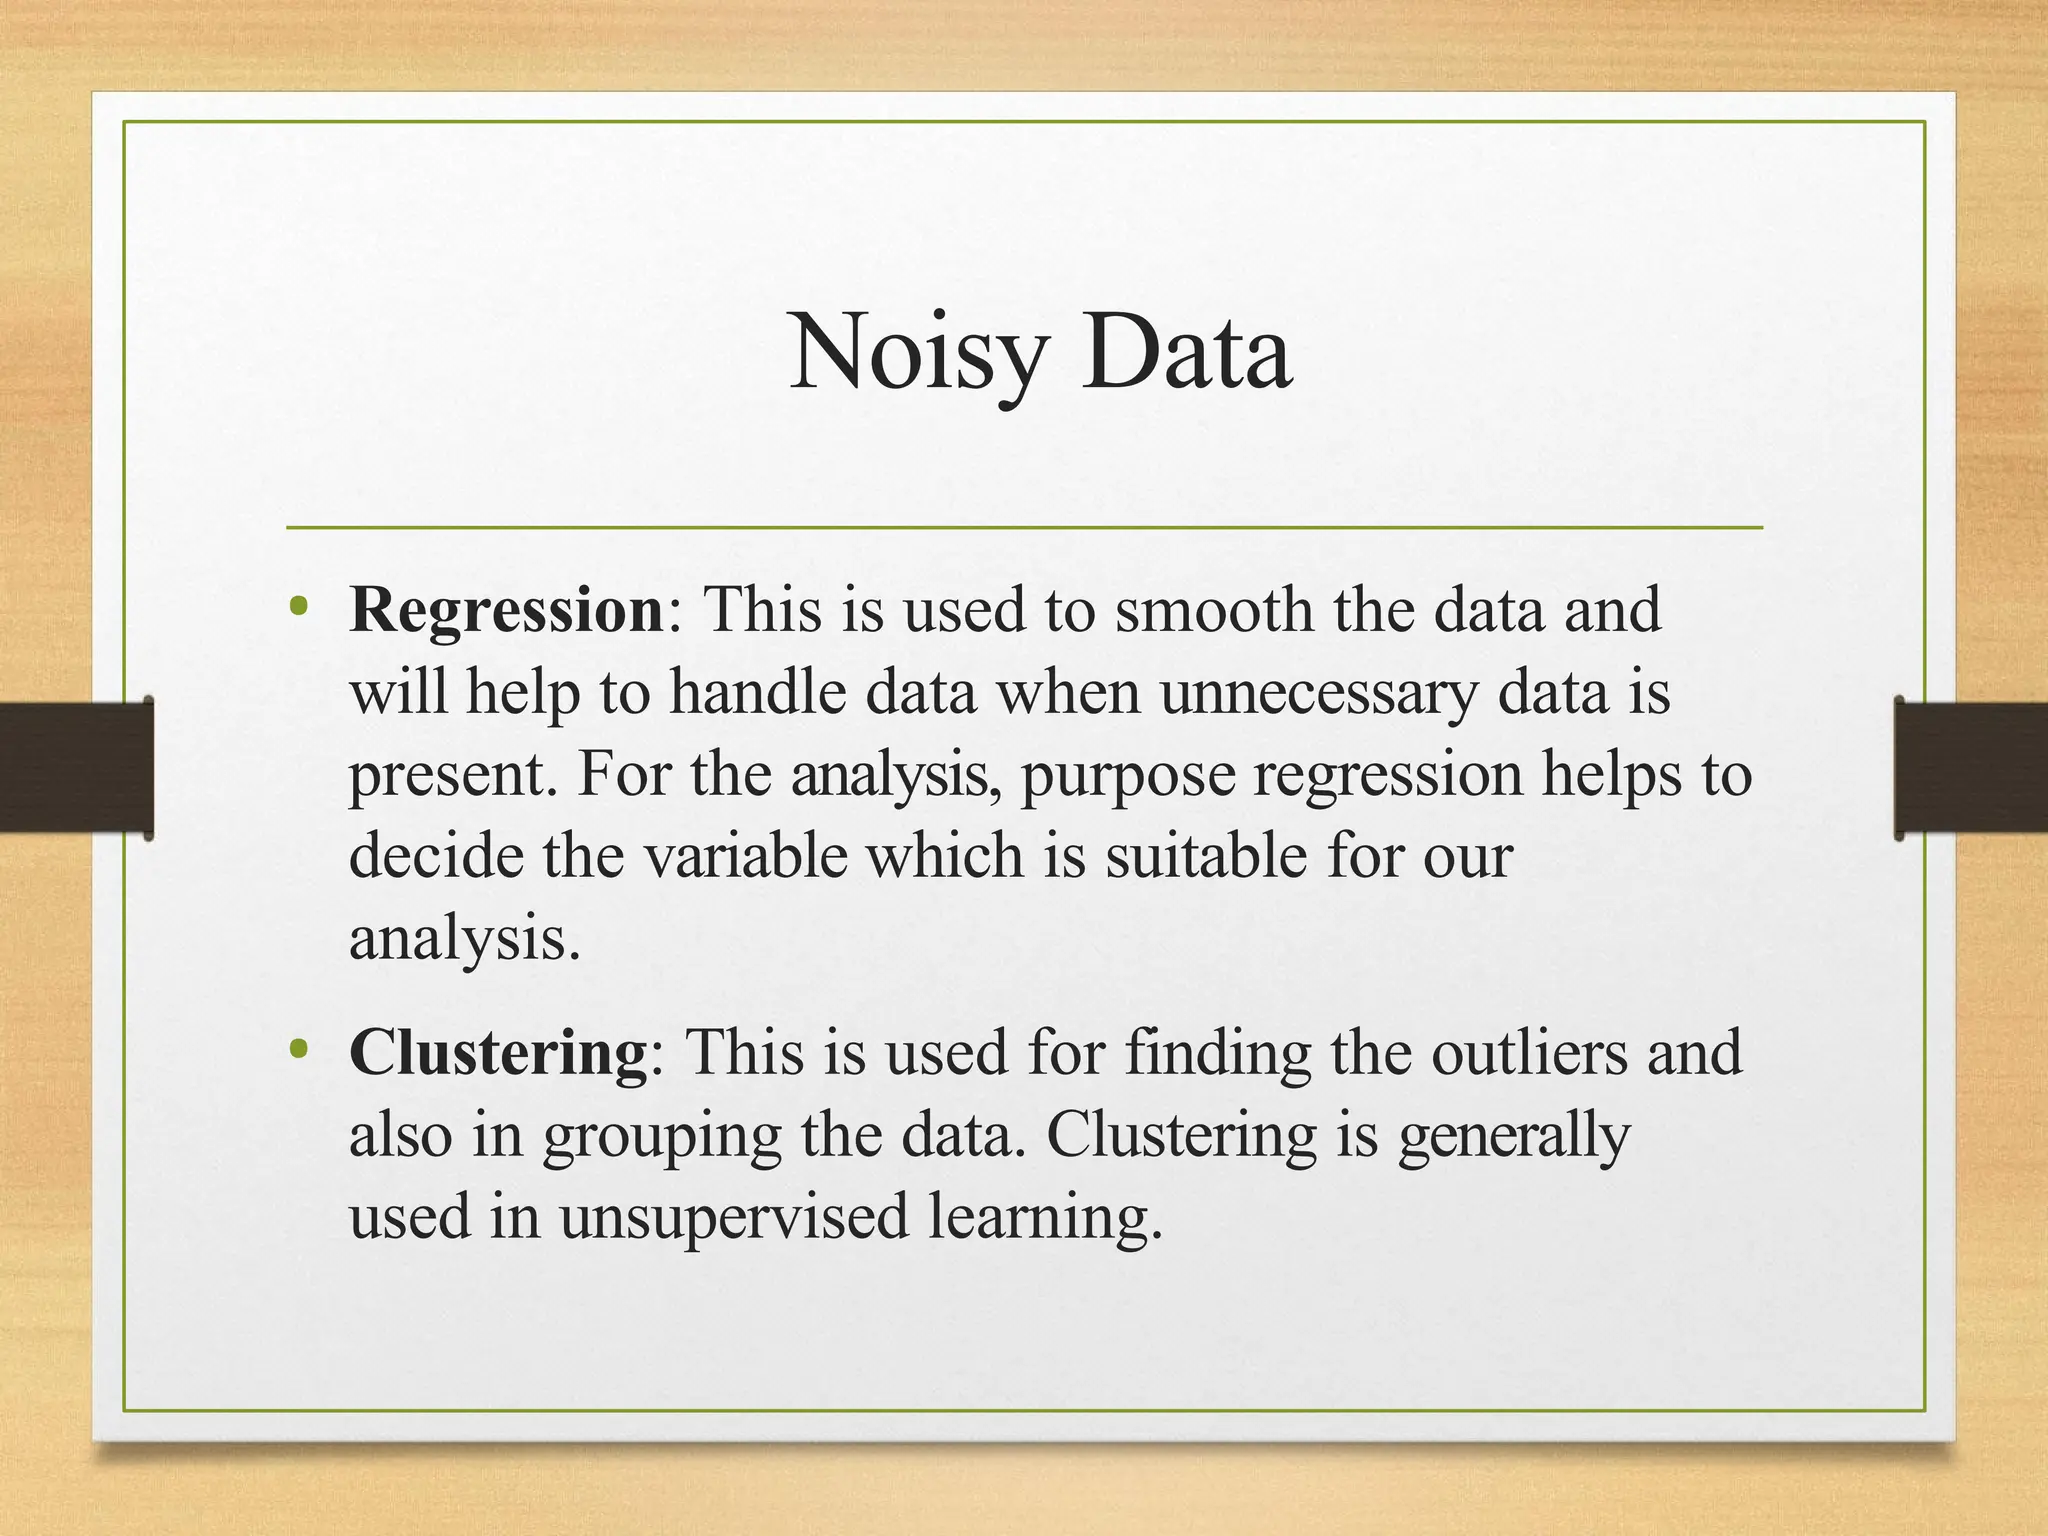
Noisy Data
• Regression:This is used to smooth the data and
will help to handle data when unnecessary data is
present. For the analysis, purpose regression helps to
decide the variable which is suitable for our
analysis.
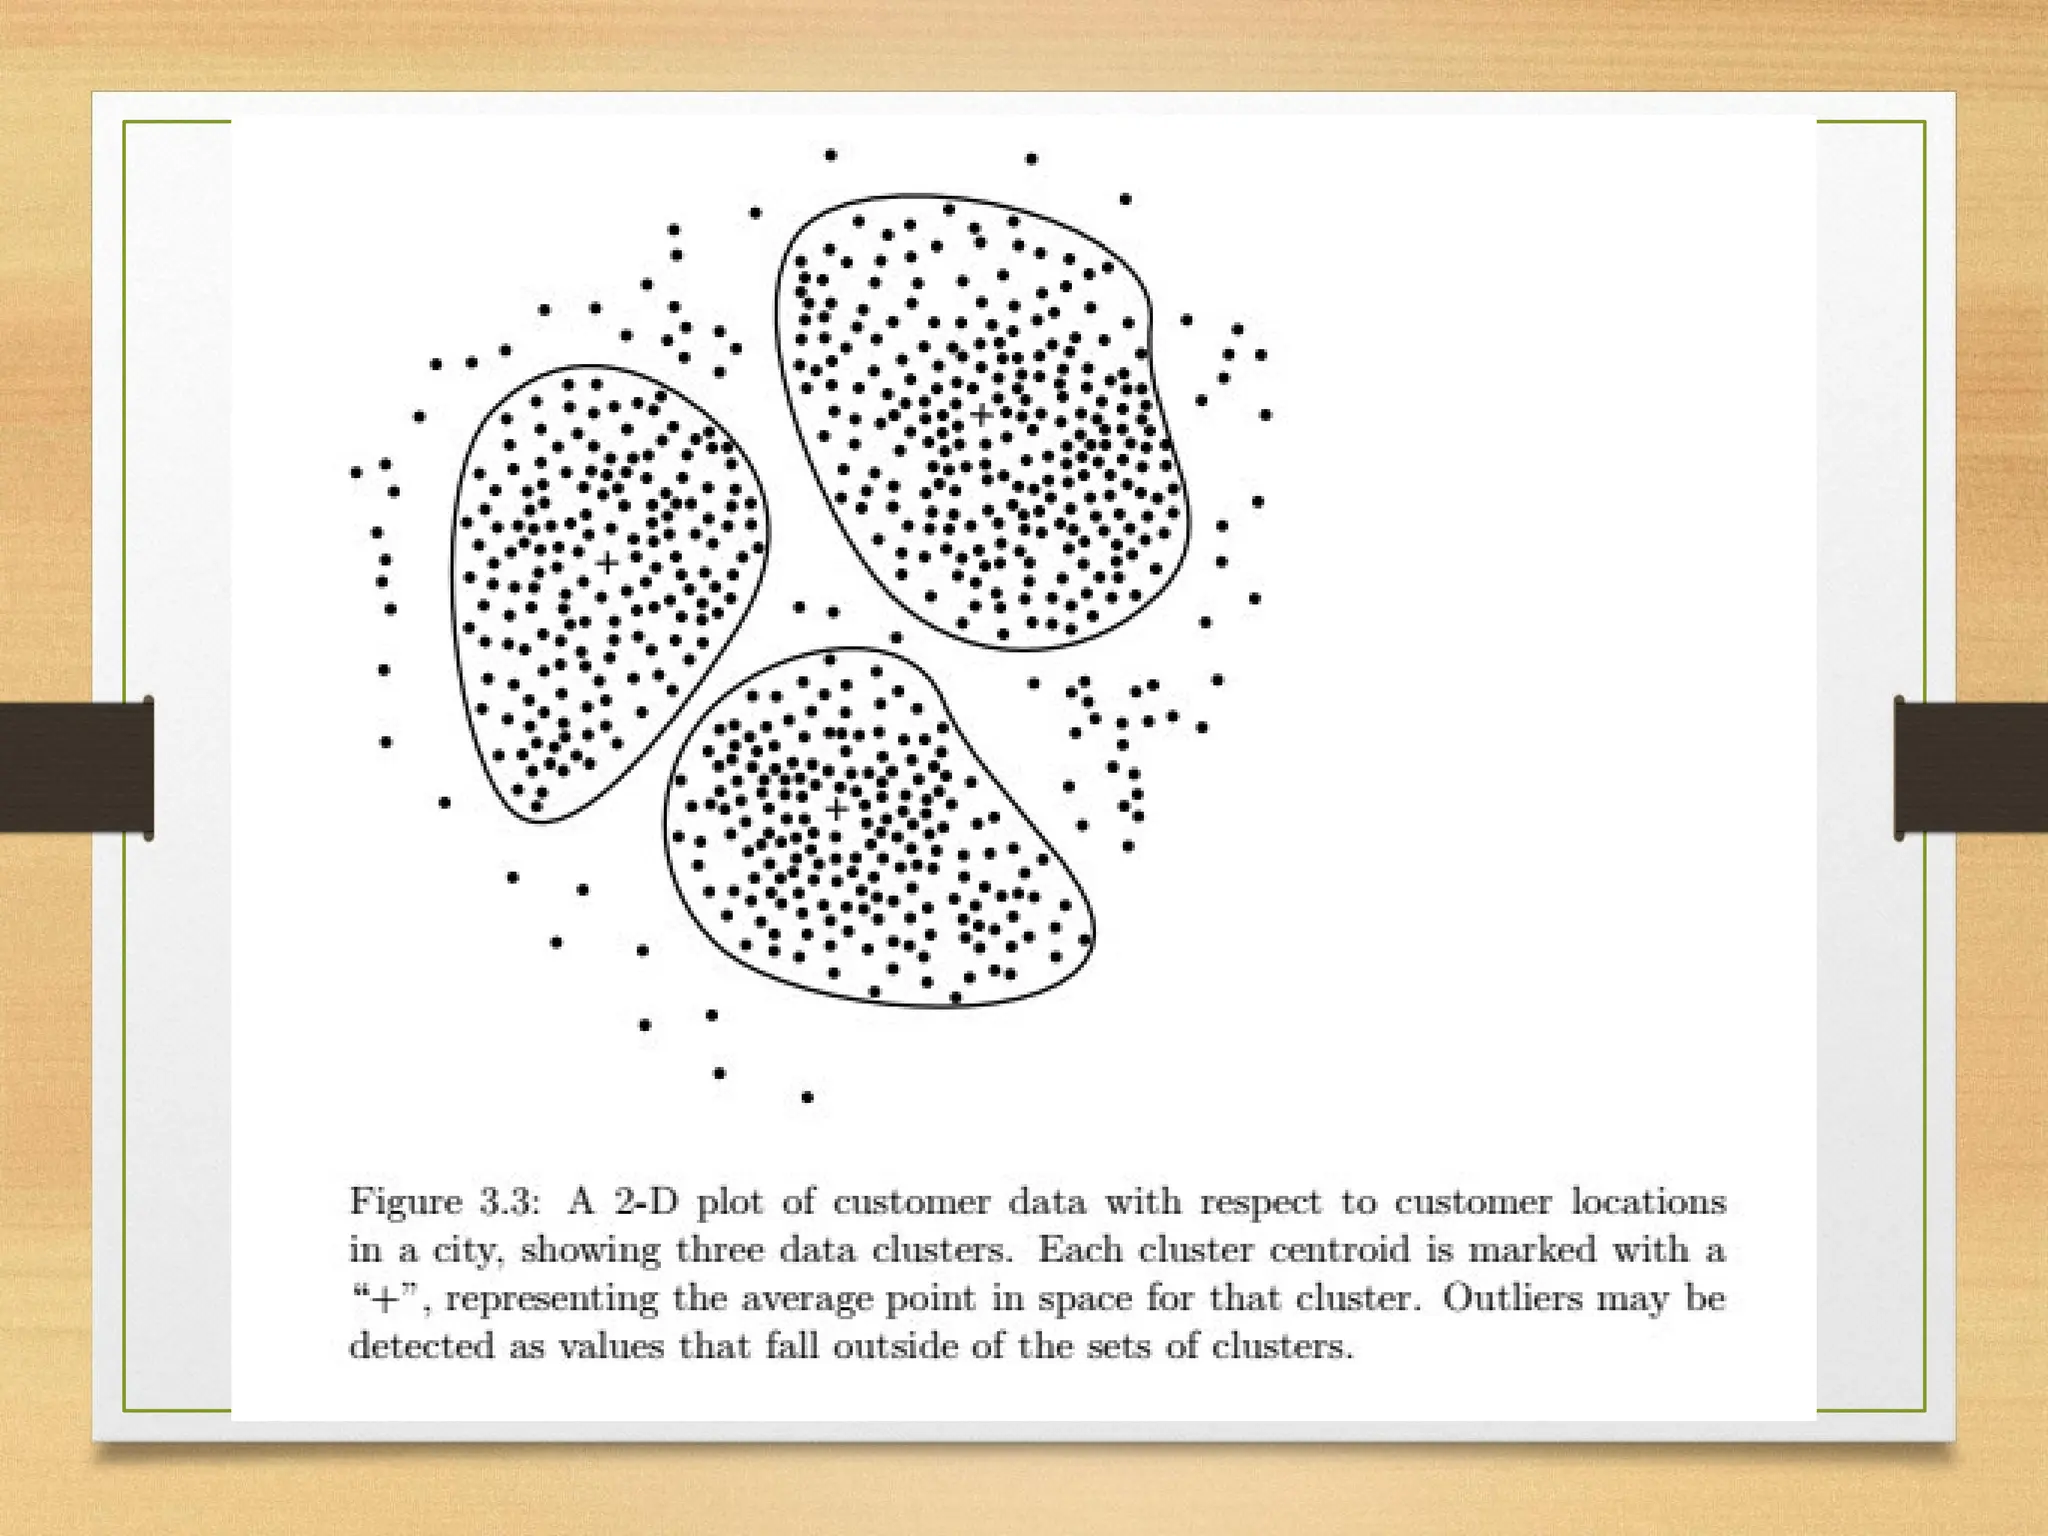
• Clustering: This is used for finding the outliers and
also in grouping the data. Clustering is generally
used in unsupervised learning.
67.
Handling outliers
• Outliersare data points that are significantly
different from other data points in a dataset.
• These can occur due to measurement errors,
data entry errors, or may represent genuine
extreme values.
• Handling outliers is an important part of data
cleaning, as they can skew statistical analysis and
lead to inaccurate conclusions
68.
Handling outliers
• DetectingOutliers: Before handling outliers, it is
important to detect them. Outliers can be detected
by visual inspection of the data or by using
statistical methods such as the Z-score,
Interquartile Range (IQR), or Tukey’s rule. A
common approach is to consider data points
beyond a certain number of standard deviations
from the mean as outliers.
69.
Handling outliers
• Imputation: If the outlier is due to measurement
error, it may be appropriate to impute the value
with a more reasonable value. This can be done by
replacing the outlier with the mean, median, or
mode of the dataset, or by using linear regression
to estimate the value based on other variables in the
dataset.
70.
Handling outliers
• Removal:Outliers can be removed from
the dataset if they are genuine errors or do
not represent the true distribution of the
data.
• However, care should be taken when removing
outliers, as it can significantly alter the
distribution and the statistical properties of the
data.
71.
Handling outliers
• Transformation:If the outliers are due to non-
normality or heteroscedasticity, transformation of
the data can be used to reduce the impact of
outliers. This can be done by applying logarithmic
or square root transformations, which can also
help to stabilize the variance of the data.
72.
Handling outliers
• Modeling:If outliers are due to genuine
extreme values, they may represent
important information that should not be
ignored.
• In such cases, modeling techniques such as
regression or decision trees can be used to
understand the relationship between the outliers
and other variables in the dataset.
73.
Data normalization
• Datanormalization is a process of transforming
data into a standardized format to eliminate data
redundancy and inconsistencies.
• It is a crucial step in data cleaning as it ensures
that data is consistent, valid, and in a format
that can be easily analyzed.
• Normalization can be done by applying a set of
mathematical rules to the data to transform it
into a standard form.
74.
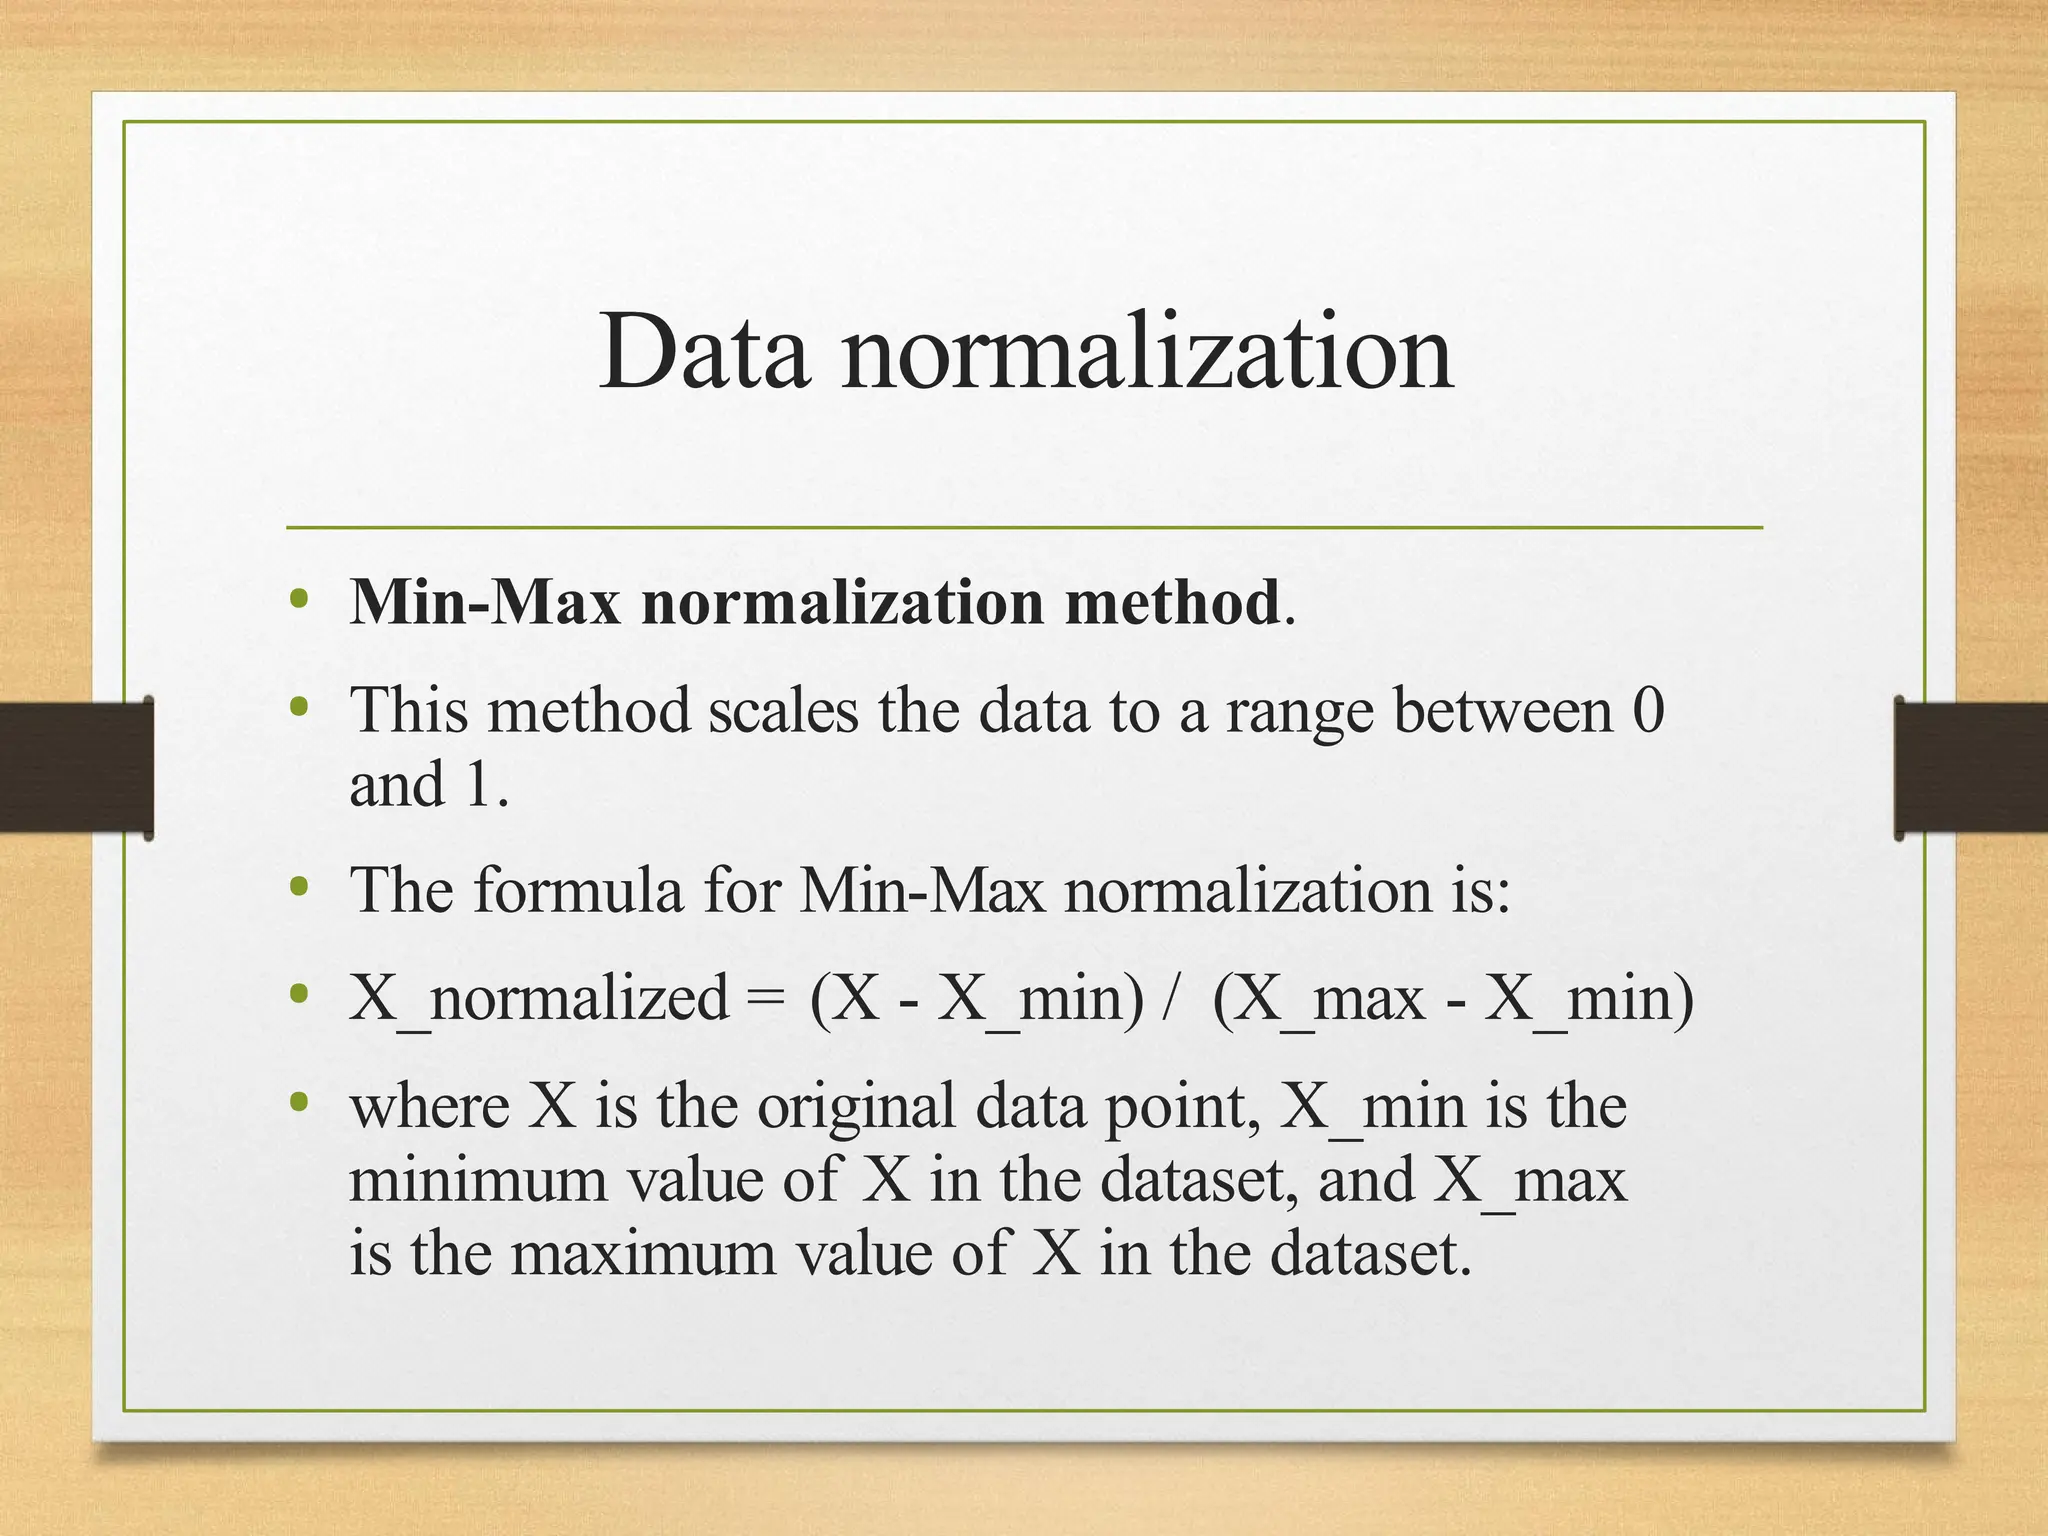
Data normalization
• Min-Maxnormalization method.
• This method scales the data to a range between 0
and 1.
• The formula for Min-Max normalization is:
• X_normalized = (X - X_min) / (X_max - X_min)
• where X is the original data point, X_min is the
minimum value of X in the dataset, and X_max
is the maximum value of X in the dataset.
75.
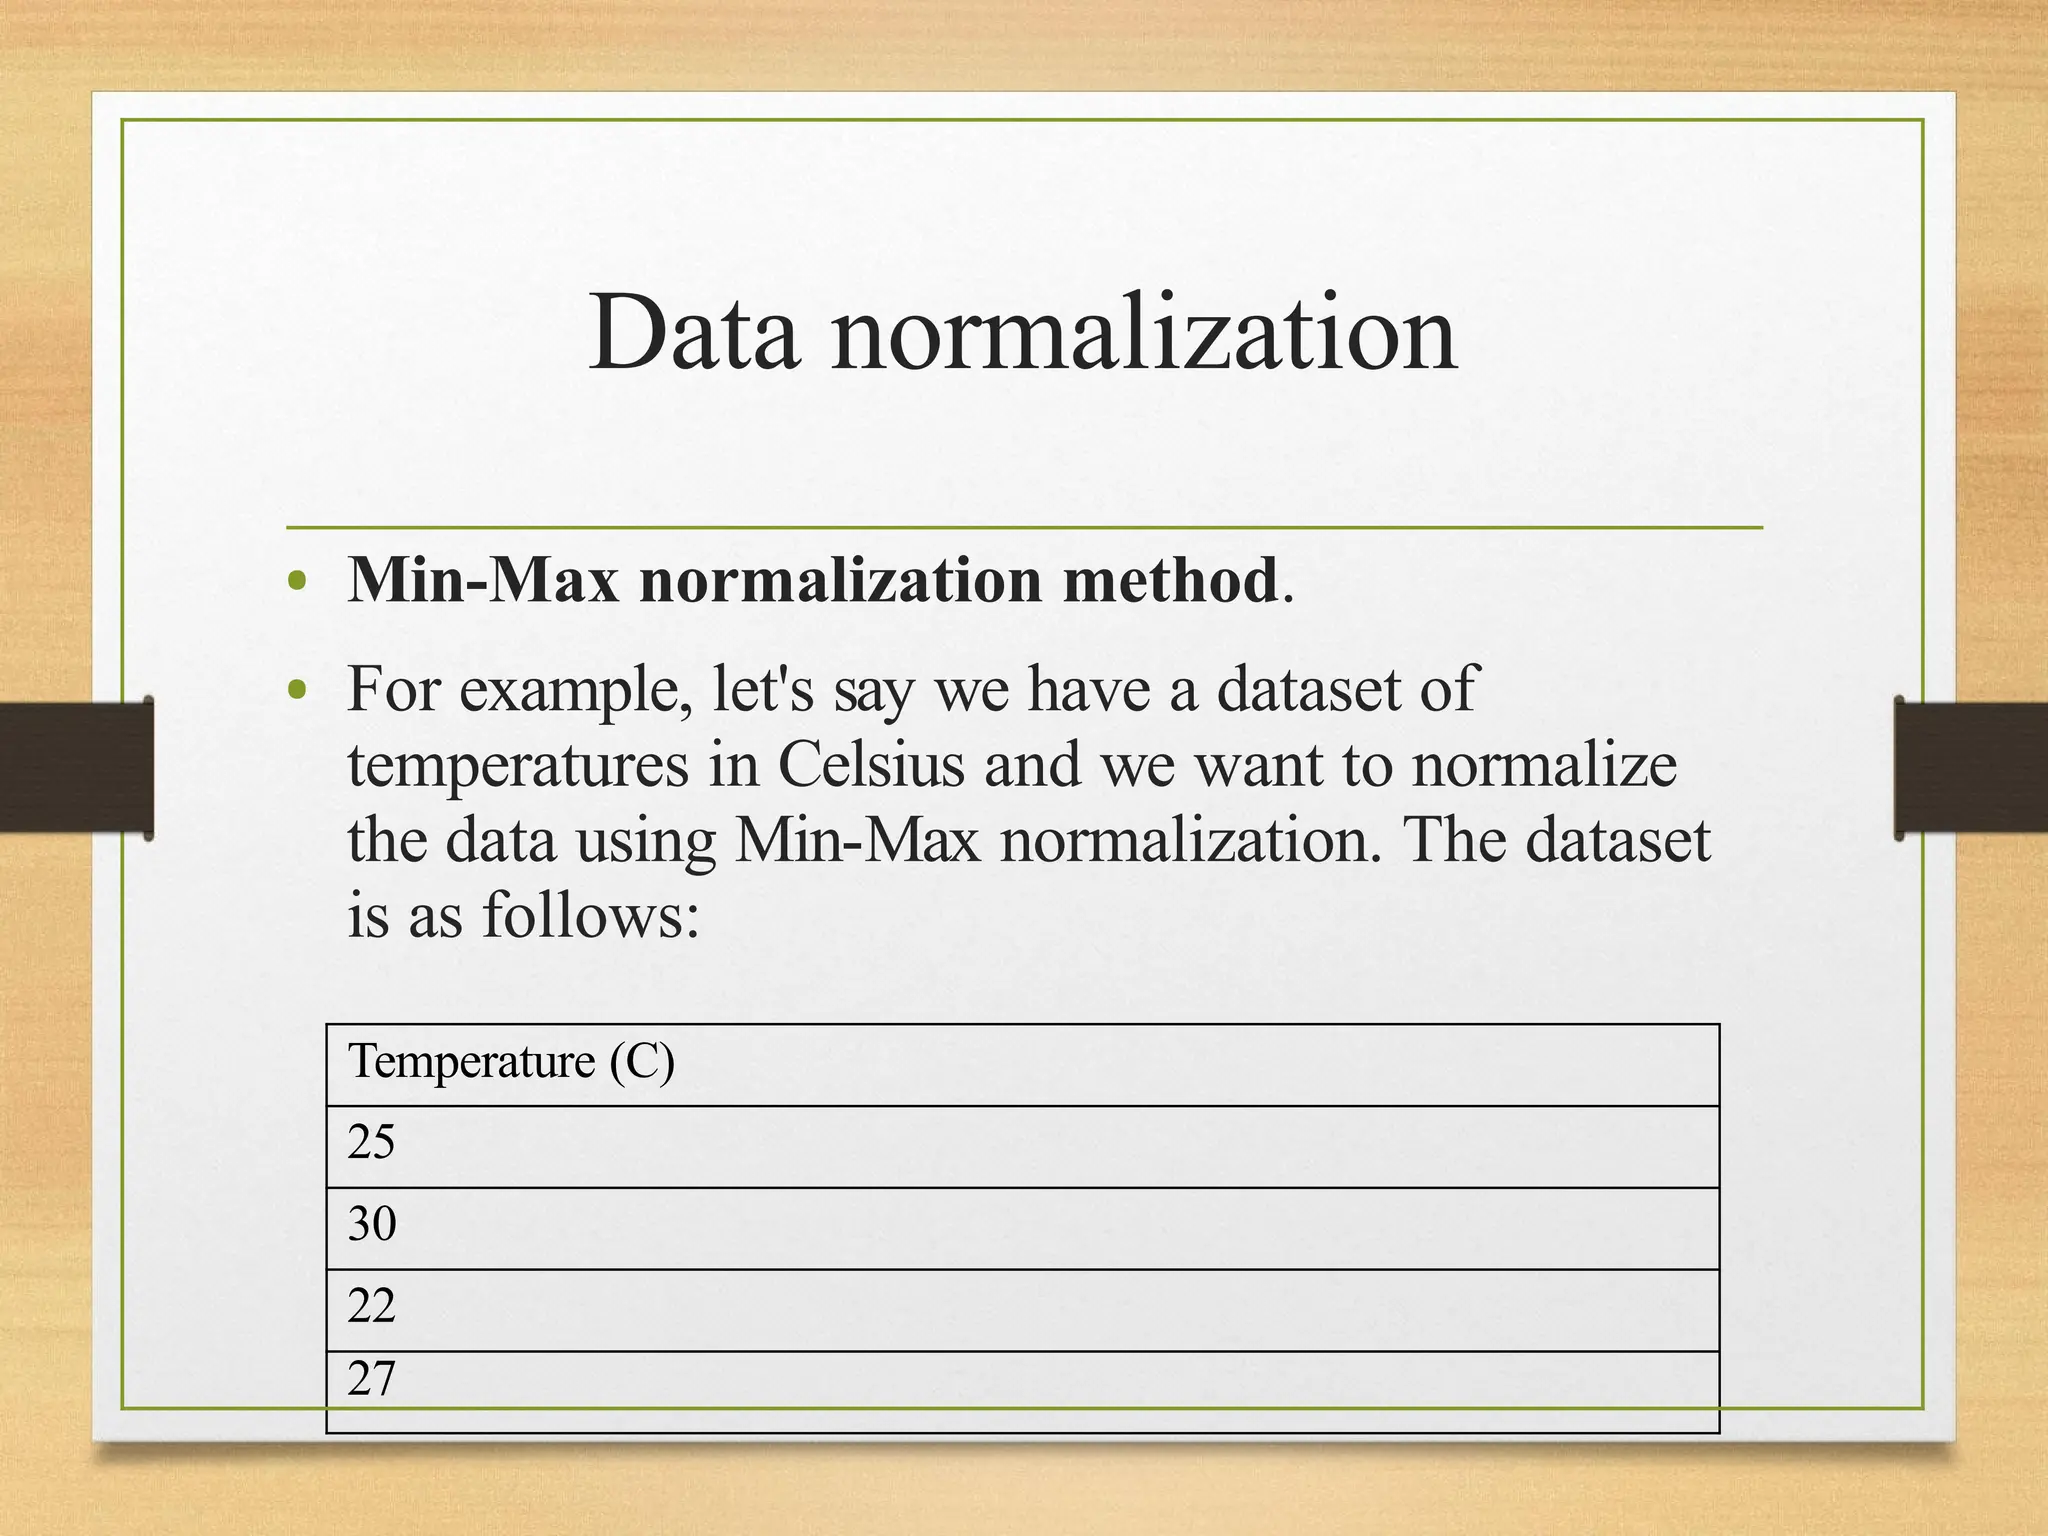
Data normalization
• Min-Maxnormalization method.
• For example, let's say we have a dataset of
temperatures in Celsius and we want to normalize
the data using Min-Max normalization. The dataset
is as follows:
Temperature (C)
25
30
22
27
76.
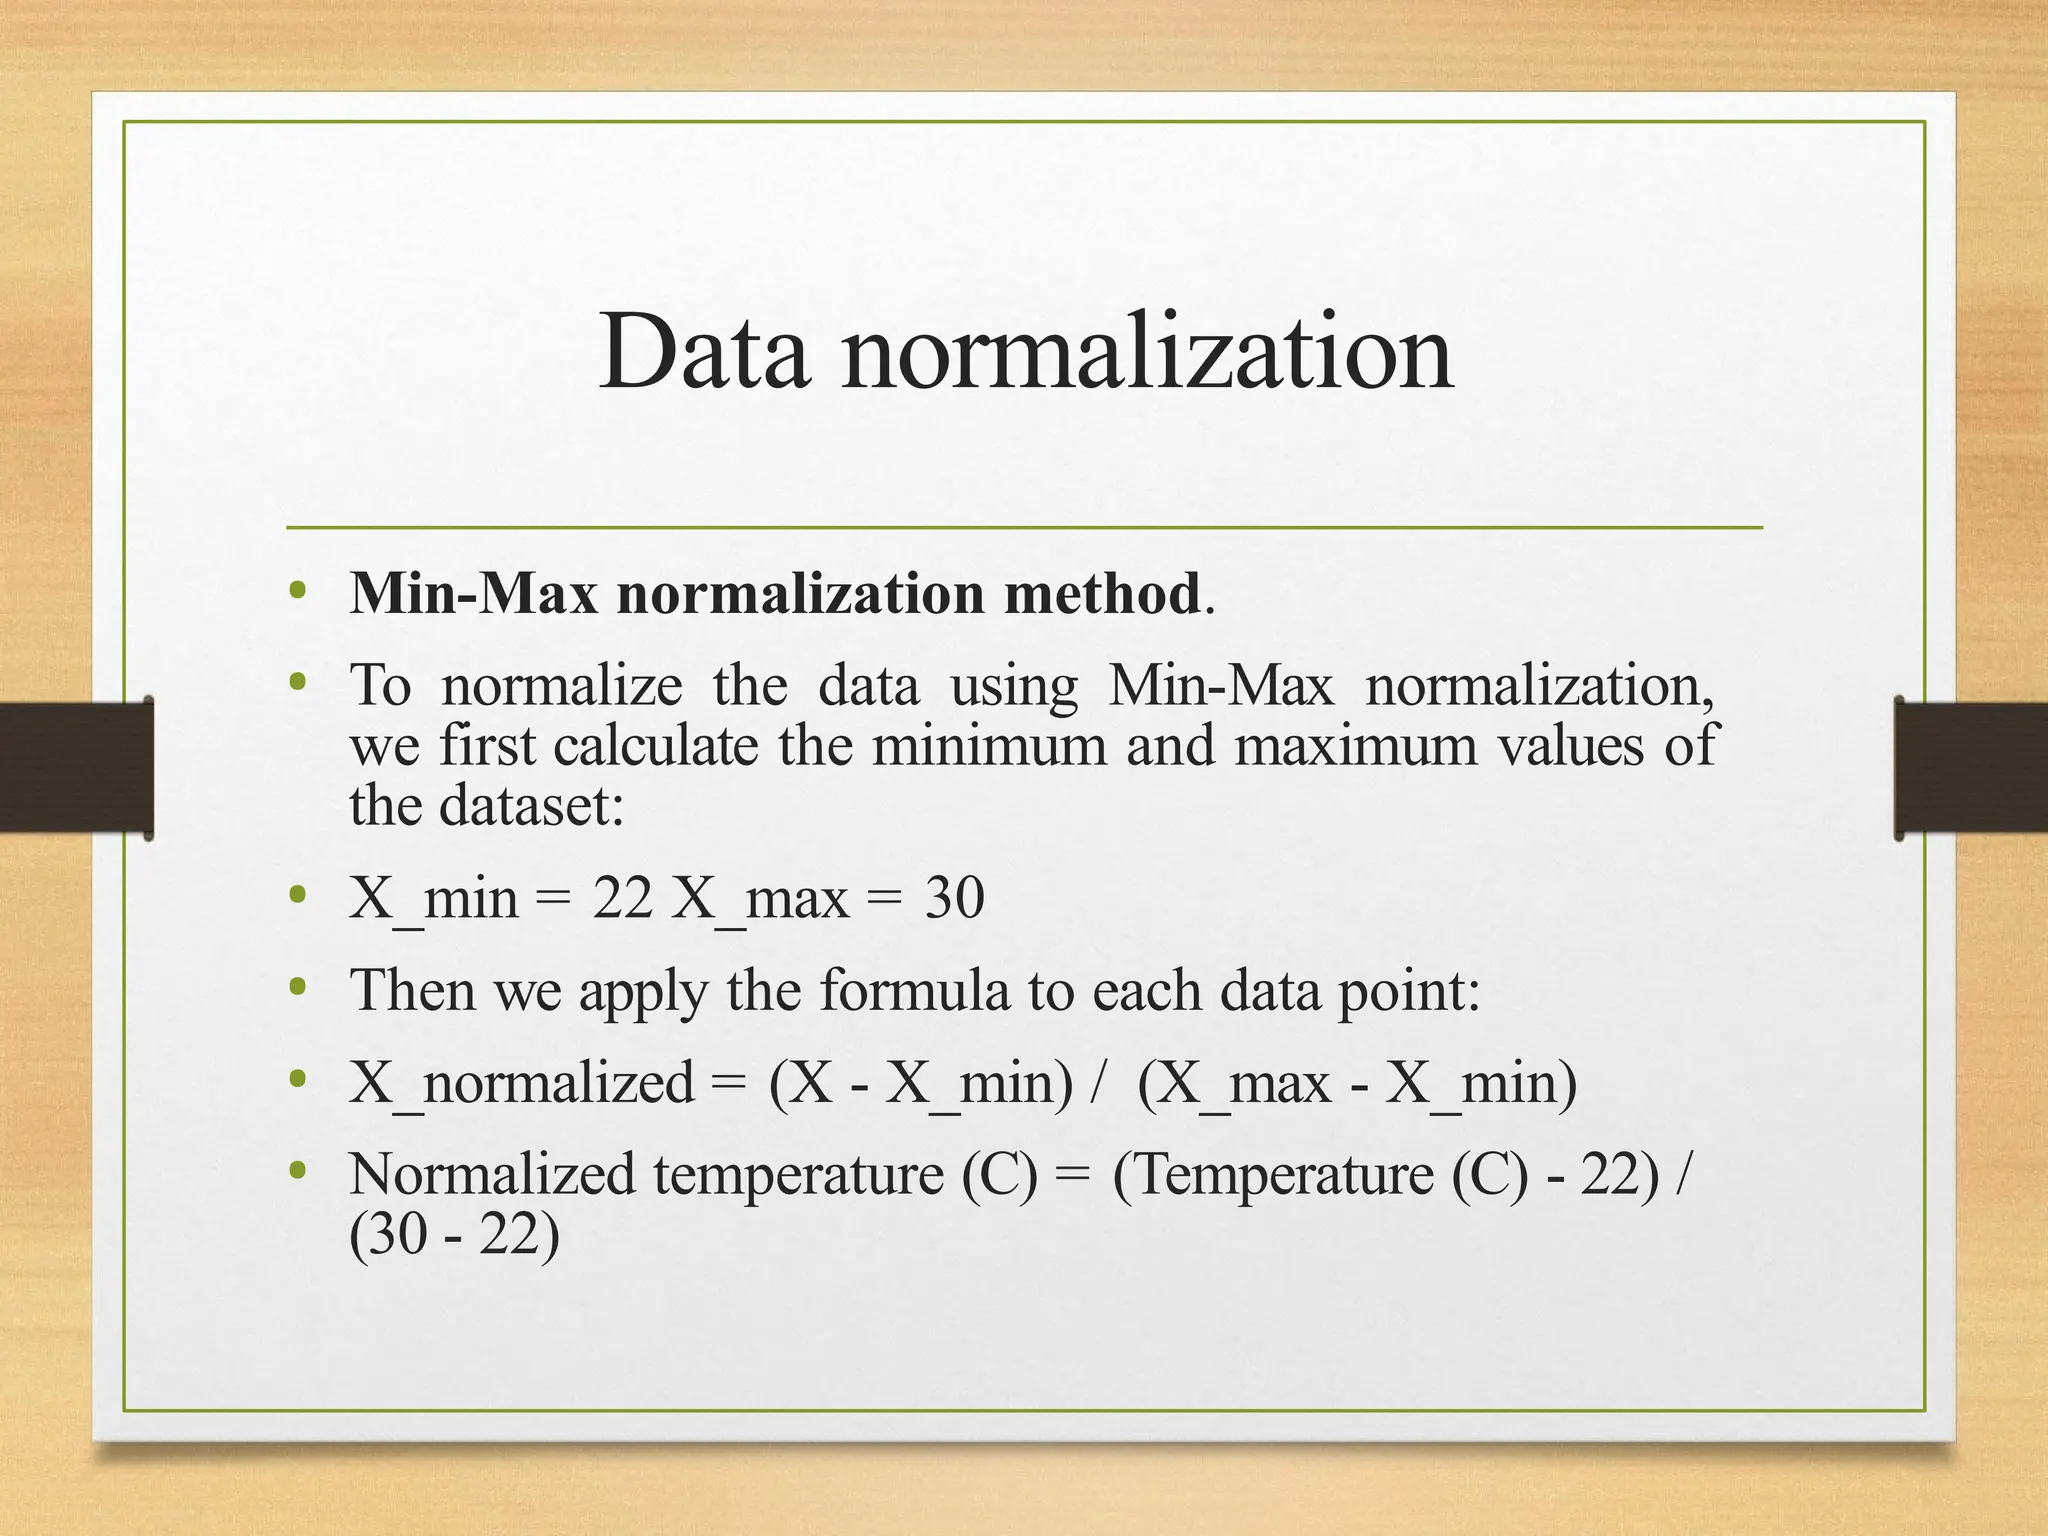
Data normalization
• Min-Maxnormalization method.
• To normalize the data using Min-Max normalization,
we first calculate the minimum and maximum values of
the dataset:
• X_min = 22 X_max = 30
• Then we apply the formula to each data point:
• X_normalized = (X - X_min) / (X_max - X_min)
• Normalized temperature (C) = (Temperature (C) - 22) /
(30 - 22)
77.
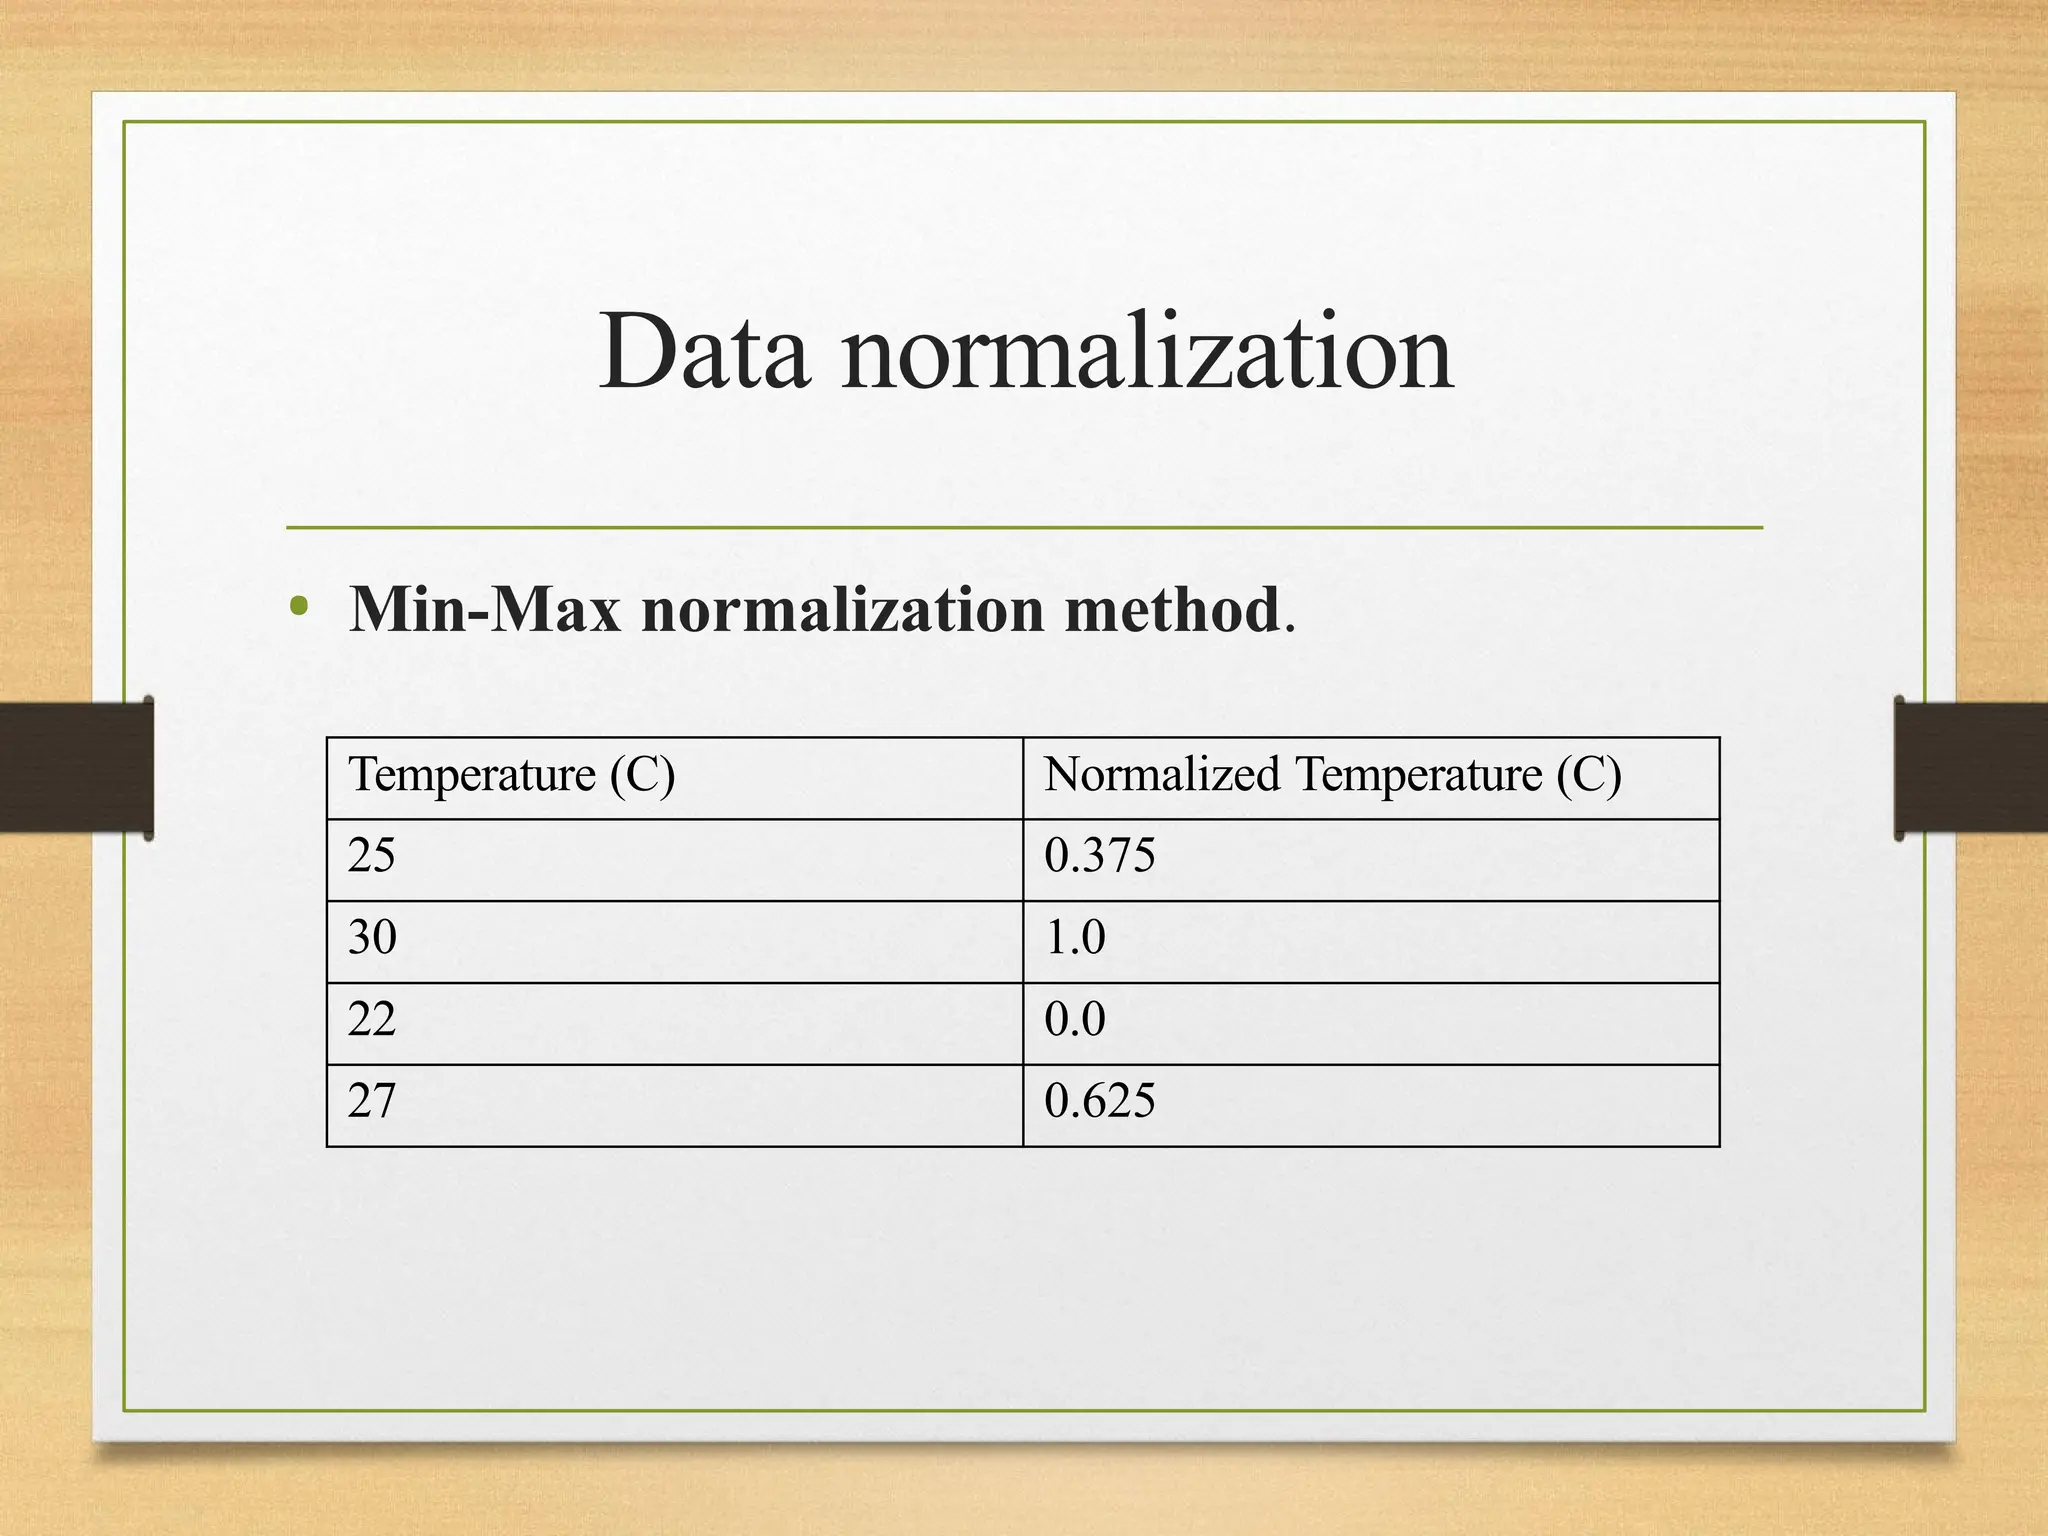
Data normalization
• Min-Maxnormalization method.
Temperature (C) Normalized Temperature (C)
25 0.375
30 1.0
22 0.0
27 0.625
78.
Data normalization
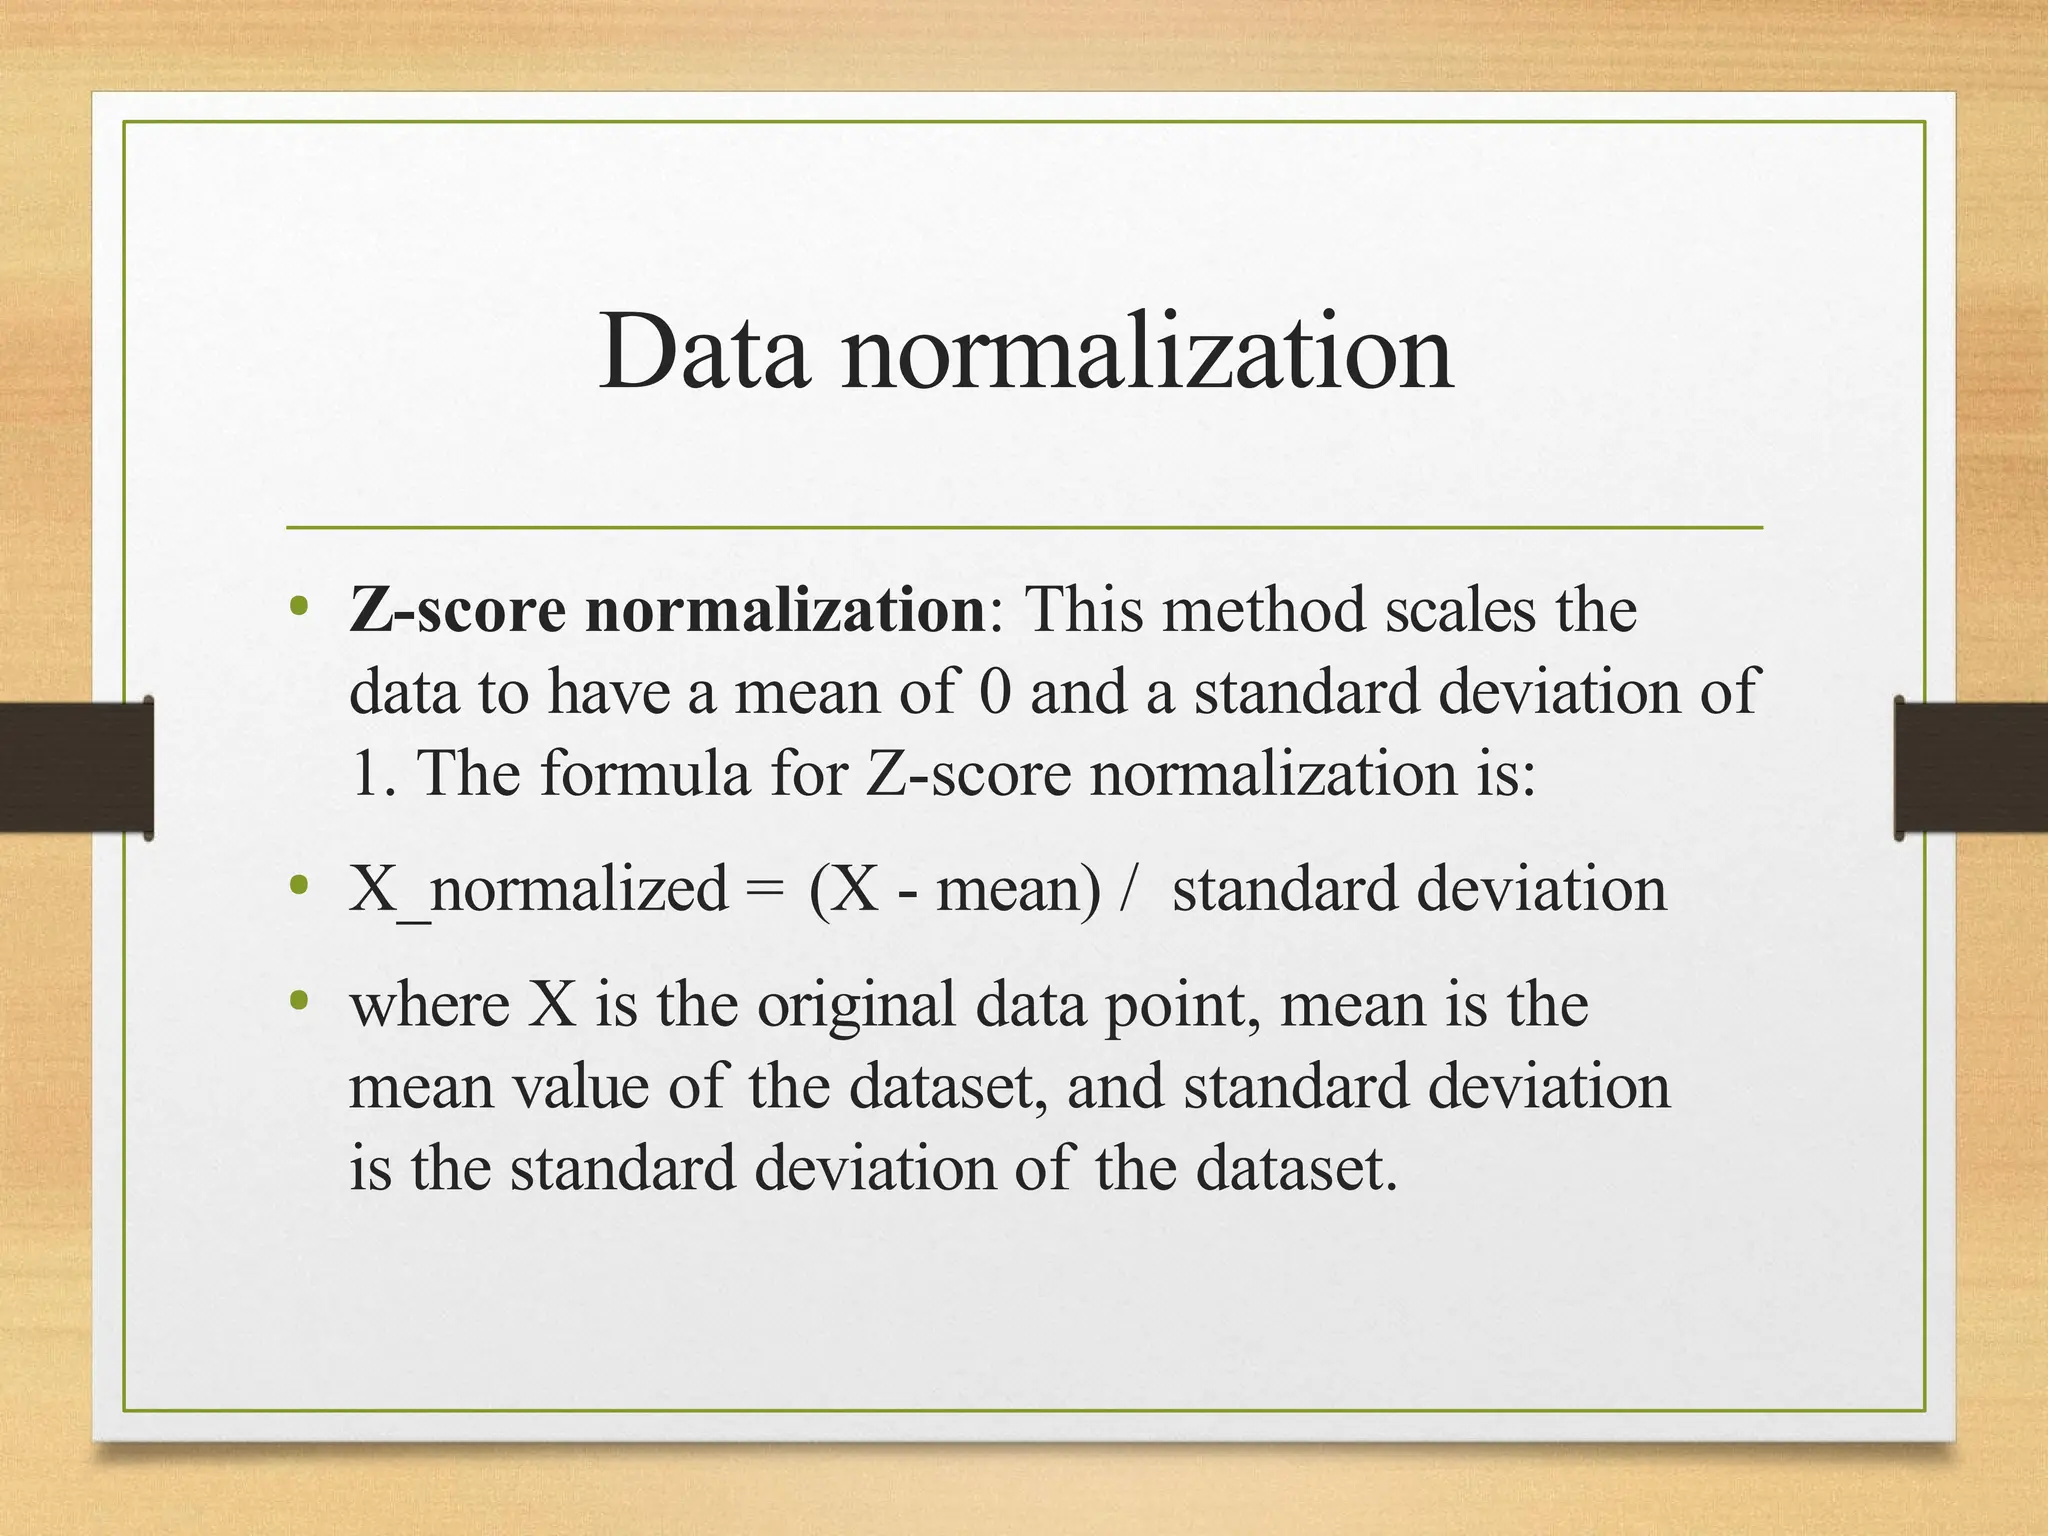
• Z-scorenormalization: This method scales the
data to have a mean of 0 and a standard deviation of
1. The formula for Z-score normalization is:
• X_normalized = (X - mean) / standard deviation
• where X is the original data point, mean is the
mean value of the dataset, and standard deviation
is the standard deviation of the dataset.
79.
Data Standardization
• Datastandardization, also known as feature scaling, is a
data cleaning technique that transforms data so that it
has a common scale and center point.
• This is important because some machine learning
algorithms require that input variables are on the same
scale in order to work effectively.
• Without data standardization, variables with larger
magnitudes or ranges can dominate smaller variables in
a model, leading to biased or inaccurate results.
80.
Data Standardization
• Datastandardization involves two main steps: Centering
and Scaling.
• Centering involves subtracting the mean value of a
variable from each data point so that the variable has
a mean of zero.
• Scaling involves dividing each data point by a measure of
scale, such as the standard deviation or range, so that
the variable has a standard deviation of one or a specific
range.
81.
Data Standardization
• Z-scorestandardization:
• This method involves subtracting the mean value of
a variable from each data point and then dividing
by the standard deviation of the variable. This
results in a variable with a mean of zero and a
standard deviation of one.
82.
Data Standardization
• Min-maxscaling:
• This method involves scaling the data so that it
falls within a specified range, typically between 0
and 1. This is done by subtracting the minimum
value of the variable from each data point and then
dividing by the range of the variable.
83.
Data Standardization
• Decimalscaling:
• This method scales data by shifting the decimal
point of each value to the left or right. The number
of decimal places to shift is determined by the
maximum absolute value of the data.
84.
Data validation
• Datavalidation is the process of ensuring that data is
accurate, complete, and consistent. It is a critical step in data
cleaning, as it helps to identify errors and inconsistencies in data
that can impact the validity and reliability of analyses and
models.
• Data validation involves checking data against a set of pre-
defined rules or criteria to ensure that it meets certain standards.
These rules can include checks for data type, range,
completeness, consistency, and integrity.
• For example, data validation may involve checking that
numerical values fall within a certain range, that dates are in a
valid format, or that there are no missing values in key fields.
85.
Data validation
• Manualchecking:
• This involves reviewing the data line by line to
identify errors or inconsistencies. This can be a
time- consuming process, but it allows for a more
thorough review of the data.
86.
Data validation
• Automatedvalidation:
• This involves using software tools or scripts to
perform checks on the data. This can be more
efficient than manual checking, but it may not
catch all errors or inconsistencies.
87.
Data validation
• Rangechecks:
• This involves checking that values fall within a
specified range. For example, checking that ages
are between 18 and 65.
88.
Data validation
• Formatchecks:
• This involves checking that values are in the
correct format. For example, checking that
phone numbers are in a valid format, or
that dates are in the correct format.
89.
Data validation
• Consistencychecks:
• This involves checking that data is consistent across
different fields or records. For example, checking
that an employee's department matches their job
title.
90.
Data validation
• Integritychecks:
• This involves checking that data is consistent within
a field or record. For example, checking that all
employee IDs are unique.
91.
Data validation
• Cross-fieldvalidation:
• This involves checking that data is consistent
across multiple fields. For example, checking that
an employee's age matches their date of birth.
92.
Data validation
• Statisticalanalysis:
• This involves using statistical methods, such as
outlier detection or clustering analysis, to identify
patterns or anomalies in data that may indicate
errors or inconsistencies.
93.
Data formatting
• Dataformatting is the process of changing the
appearance of data without changing its
underlying values.
• This can include changing the font, color, size,
alignment, or other visual characteristics of the
data.
• The goal of data formatting is to make the data
more readable and visually appealing, which can
help to improve understanding and interpretation.
94.
Data formatting
• Numberformatting:
• This involves changing the way numeric data is
displayed, such as adding currency symbols,
decimal places, or thousands separators.
95.
Data formatting
• Dateand time formatting:
• This involves changing the way date and time data
is displayed, such as changing the format to show
the month before the day or displaying the time in
24- hour format.
96.
Data formatting
• Textformatting:
• This involves changing the appearance of text
data, such as changing the font, size, or color.
97.
Data formatting
• Conditionalformatting:
• This involves formatting data based on certain
criteria or conditions, such as highlighting values
that are above or below a certain threshold.
98.
Data formatting
• Tableformatting:
• This involves formatting the appearance of
tables, such as adding borders, shading, or
alternate row colors to make the data easier to
read.
99.
Data formatting
• Chartformatting:
• This involves formatting the appearance of charts,
such as changing the colors, fonts, or labels to
make the data more visually appealing and easier to
understand.
100.
Data Cleaning asa
Process
• The first step in data cleaning as a process is
discrepancy detection
• Discrepancies can be caused by several factors,
including poorly designed data entry forms that
have many optional fields, human error in
data entry, deliberate errors
101.
Data Cleaning asa
Process
• Field overloading
• It is another source of errors that typically
results when developers squeeze new attribute
definitions into unused (bit) portions of
already defined attributes.
•
102.
Data Cleaning asa
Process
• The data should also be examined regarding unique
rules, consecutive rules, and null rules.
• A unique rule says that each value of the given attribute
must be different from all other values for that attribute.
• A consecutive rule says that there can be no missing values
between the lowest and highest values for the attribute, and
that all values must also be unique (e.g., as in check numbers).
• A null rule specifies the use of blanks, question marks,
special characters, or other strings that may indicate the null
condition.
103.
Data Cleaning asa
Process
• There are a number of different commercial tools that
can aid in the step of discrepancy detection.
• Data scrubbing tools use simple domain knowledge
(e.g., knowledge of postal addresses, and spell-checking)
to detect errors and make corrections in the data. These
tools rely on parsing and fuzzy matching techniques
when cleaning data from multiple sources.
• Data auditing tools find discrepancies by analyzing the
data to discover rules and relationships, and detecting
data that violate such conditions.
104.
Data Cleaning asa
Process
• Data migration tools allow simple transformations to be
specified, such as to replace the string “gender” by “sex”
• ETL (extraction/transformation/loading) tools allow
users to specify transforms through a graphical user
interface (GUI).
• These tools typically support only a restricted set of
transforms so that, often, we may also choose to write
custom scripts for this step of the data cleaning process.
105.
Data Cleaning asa process steps
• 1. Data Collection: The first step in data cleaning is
collecting data from various sources. The data can
be collected from different sources such as
spreadsheets, databases, web applications, etc.
106.
Data Cleaning asa process steps
• 2. Data Inspection: After collecting data, the next
step is to inspect the data to identify any errors,
inconsistencies, or missing values. This step
involves reviewing the data to ensure that it is
accurate, complete, and consistent.
107.
Data Cleaning asa process steps
• 3. Data Cleaning: Once errors or inconsistencies
are identified, the data cleaning process can begin.
This step involves correcting or removing errors,
inconsistencies, and missing values in the dataset.
Some common data cleaning techniques include
removing duplicates, handling missing values, and
handling outliers.
108.
Data Cleaning asa process steps
• 4. Data Transformation: The next step in the data
cleaning process is transforming the data into a
format that can be used for further analysis. This
step involves transforming data from one format to
another, standardizing data, and encoding
categorical variables.
109.
Data Cleaning asa process steps
• 5. Data Integration: Once the data is transformed,
the next step is to integrate the cleaned data into a
single dataset. This step involves merging data
from multiple sources and removing any duplicates
or inconsistencies.
110.
Data Cleaning asa process steps
• 6. Data Verification: The final step in the data
cleaning process is to verify the cleaned data to
ensure that it is accurate and consistent. This step
involves performing statistical analysis on the data
to verify that it meets the desired quality standards.
111.
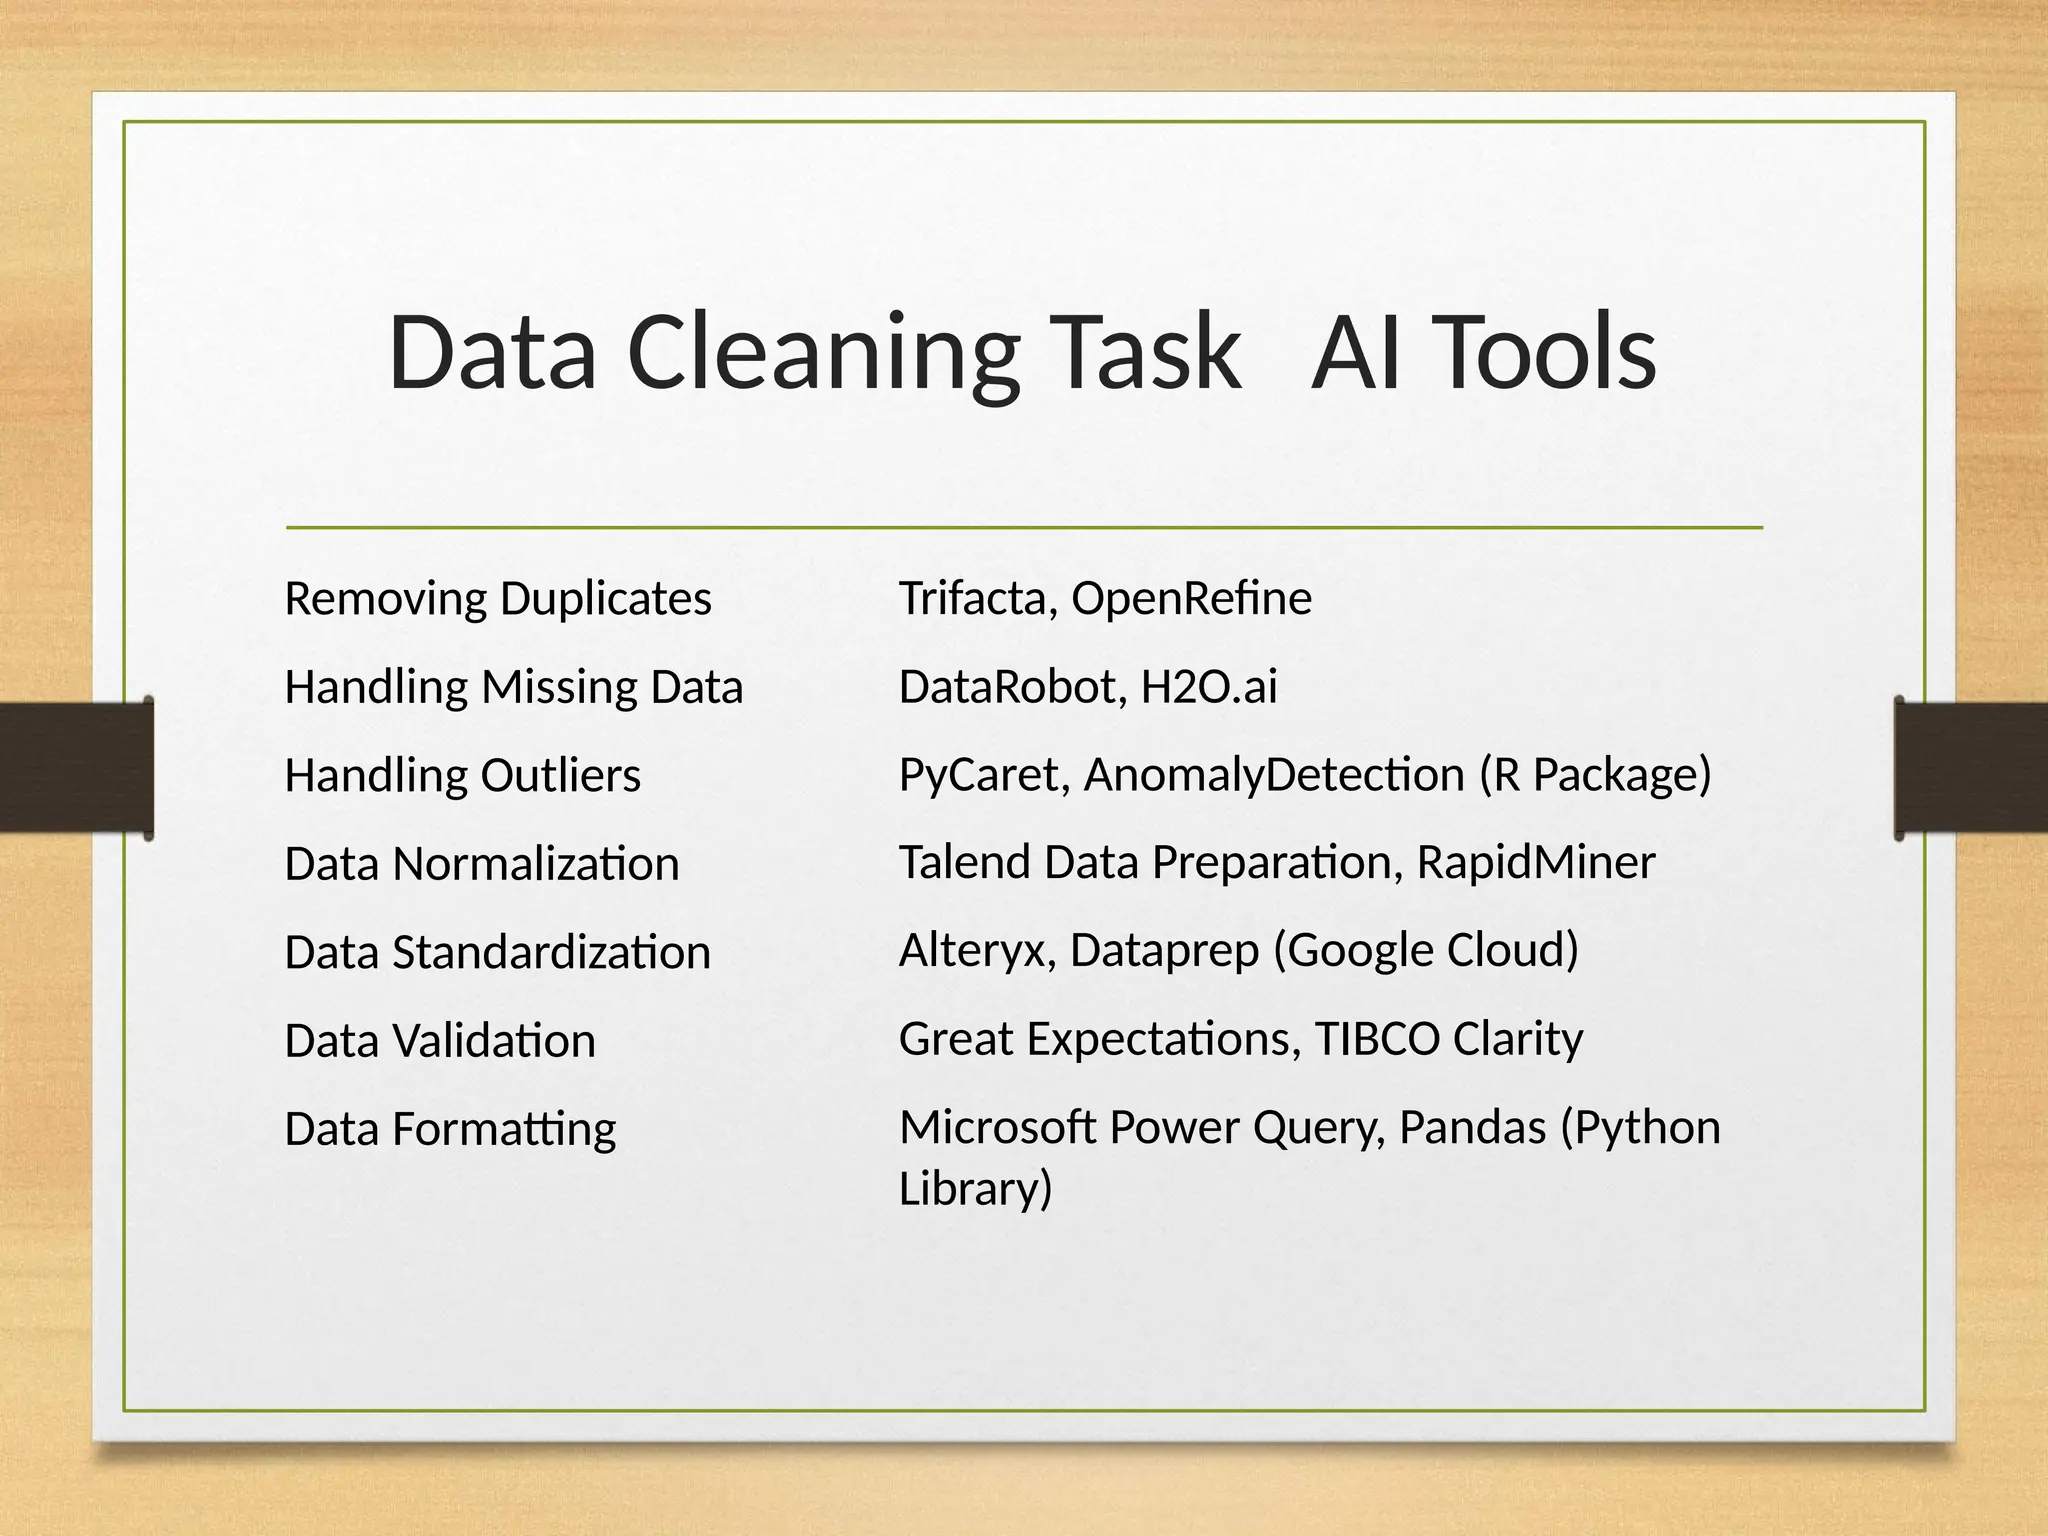
Data Cleaning TaskAI Tools
Removing Duplicates
Handling Missing Data
Handling Outliers
Data Normalization
Data Standardization
Data Validation
Data Formatting
Trifacta, OpenRefine
DataRobot, H2O.ai
PyCaret, AnomalyDetection (R Package)
Talend Data Preparation, RapidMiner
Alteryx, Dataprep (Google Cloud)
Great Expectations, TIBCO Clarity
Microsoft Power Query, Pandas (Python
Library)
Data Integration
• Datais collected from various sources and in
different formats, the process of combining
these multiple sourced data into a single dataset
is called Data Integration.
• The goal of data integration is to provide a more
complete and accurate picture of the data, which
can help to support better decision-making and
analysis.
114.
Methods of Data
Integration
•Manual integration:
• This involves manually combining data from
multiple sources using tools such as spreadsheets or
databases. While this method can be time-
consuming and error- prone, it can be useful for
small-scale integration projects.
115.
Methods of Data
Integration
•ETL (Extract, Transform, Load):
• This involves extracting data from multiple
sources, transforming it into a common format,
and then loading it into a target system. ETL tools
automate this process, making it more efficient and
less error- prone.
116.
Methods of Data
Integration
•Data Virtualization:
• This involves creating a virtual layer on top of the
source data, allowing users to access and
manipulate the data as if it were stored in a single
location. This method can be useful for integrating
data from multiple sources without physically
moving or duplicating the data.
117.
Methods of Data
Integration
•Enterprise service bus (ESB):
• This involves using an ESB to
facilitate communication between different
applications and
systems. This can help to integrat
e
systems
data and
in a more
functionality across
multiple seamless and
automated way.
118.
Methods of Data
Integration
•Data warehousing:
• This involves storing data from multiple sources in
a central repository, allowing users to access
and analyze the data in a consistent and
standardized way. Data warehousing can be
particularly useful for integrating large
volumes of data from disparate sources.
119.
Data Integration Process
1.Data Profiling:
This involves analyzing the data to identify any
quality issues, inconsistencies, or other problems that
may need to be addressed.
2. Data Mapping:
This involves mapping the data from the different
sources to a common format, so that it can be
easily combined and analyzed.
120.
Data Integration Process
3.Data Transformation:
This involves converting the data into a
consistent format, so that it can be easily combined and
analyzed.
4. Data loading:
This involves loading the transformed data into a target
system, such as a data warehouse or analytical database.
121.
Data Integration Challenges
•Schema integration:
• Schema is the organization of data as a blueprint
of how the database is constructed
• It contains data and meta data to provide insights
of
database
• Challenge is to integrate metadata (a set of data
that describes other data) from different sources.
122.
Data Integration Challenges
•Entity identification problem:
• Identifying entities from multiple databases.
• For example, the system or the user should know
student _id of one database and student_name
of another database belongs to the same
entity.
123.
Data Integration Challenges
•Detecting and resolving data value concepts:
• The data taken from different databases
while mergingmay differ.
• Like the attribute values from one database
may
differ from another database.
• For example, the date format may differ
like
“MM/DD/YYYY” or “DD/MM/YYYY”.
124.
Data Integration Challenges
•Redundancy and Correlation Analysis
Redundancy is another important issue in data integration. An
attribute (such as annual revenue, for instance) may be
redundant if it can be “derived” from another attribute or set of
attributes.
• For ex date of birth and current age
• Some redundancies can be detected by correlation analysis.
Given two attributes, such analysis can measure how strongly
one attribute implies the other, based on the available data.
• For ex salary and years of experience are strongly related
whereas
• Date of joining and years of experience are redundant
125.
Data Integration Challenges
•Tuple Duplication
it should also be detected at the tuple level (e.g., where
there are two or more identical tuples for a given
unique data entry case)
• For example, if a purchase order database contains
attributes for the purchaser’s name and address instead
of a key to this information in a purchaser database,
discrepancies can occur, such as the same purchaser’s
name appearing with different addresses within the
purchase order database.
126.
Data Integration Challenges
•Detection and Resolution of Data Value
Conflicts
• There may be different values or denominations
for the type of same data from different sources.
• For example in a hotel chain, the price of rooms
in different cities may involve not only different
currencies but also different services (such as free
breakfast) and taxes
127.
Data Integration Challenges
•Data quality issues
• Data from different sources may have different
levels of quality, consistency, and completeness. This
can make it difficult to integrate the data and may
require significant data cleansing efforts.
128.
Data Integration Challenges
•Inconsistent data formats
• Data from different sources may be in different
formats, such as CSV
, Excel, or JSON. This can
make it difficult to combine the data and may
require data transformation efforts.
129.
Data Integration Challenges
•Data Security Concerns
• Combining data from different sources can raise
security concerns, as sensitive data may be
exposed or shared in unintended ways.
This can require careful planning and
implementation of security controls.
130.
Data Integration Challenges
•Complex data relationships
• Data from different sources may have complex
relationships, such as many-to-many or
hierarchical relationships. This can make it
difficult to map and integrate the data.
131.
Data Integration Challenges
•Integration tool limitations
• Integration tools may have limitations in terms of
the types of data sources they can support,
the amount of data they can handle, or the
complexity of the integration process.
Data Reduction
• Datareduction is a process of reducing the size of a
dataset while retaining its important features,
patterns, and relationships. This is done to make
the data more manageable and easier to analyze.
• Data reduction is commonly used in situations where the
dataset is too large, complex, or noisy to be analyzed in
its entirety.
• This process helps in the reduction of the volume of the
data which makes the analysis easier yet produces the
same or almost the same result.
134.
Data Reduction Strategies
•Sampling: Sampling is a technique used in data reduction to select
a subset of the data for analysis. The selected subset, or sample, is
intended to represent the larger population from which it was
drawn. The goal of sampling is to obtain a representative sample
that accurately reflects the characteristics of the population, while
also reducing the size of the dataset.
• There are various sampling techniques, including
• Random sampling (population has an equal chance of being selected
for the sample)
• Stratified sampling (dividing the population into strata, or subgroups on
a characteristic of interest)
• Cluster sampling (dividing the population into clusters, or groups and
then selecting a random sample of clusters)
135.
Data Reduction Strategies
•Dimensionality reduction: This involves reducing the
number of features or variables in the dataset while
retaining as much information as possible.
• Some of the methods are
• Wavelet Transforms (sine waves to discreate functions)
• Principal Components Analysis (vector reduction)
• Attribute Subset Selection (removing irrelevant or
redundant attributes)
136.
Data Reduction Strategies
•Nonparametric methods for storing reduced
representations
of
the data include histograms, clustering,
• Numerosity Reduction replace the original data volume by
alternative, smaller forms of data representation
• Two types of methods
• Parametric method, a model is used to estimate the data, so
that typically only the data parameters need to be stored, instead
of the actual data. Example Regression and log-linear models
sampling, and data cube aggregation
137.
Data Reduction Strategies
•Data compression, transformations are applied so as
to obtain a reduced or “compressed”
representation of the original data
• If the original data can be reconstructed from the
compressed data without any loss of information, the
data reduction is called lossless.
• If, instead, we can reconstruct only an approximation
of the original data, then the data reduction is
called lossy.
138.
Data Reduction Strategies
•Feature selection:
• This involves selecting a subset of the most
important features or variables in the dataset.
This can be done using techniques such as
correlation analysis, chi-squared test, or mutual
information.
139.
Data Reduction Strategies
•Numerical compression:
• This involves reducing the size of numerical data
while retaining its important statistical
properties. This can be done using techniques
such as discrete wavelet transform
(DWT), singular value decomposition (SVD),
or clustering.
140.
Data Reduction Strategies
•Data discretization: This involves converting
continuous data into discrete categories. This can
be done using techniques such as equal width or
equal frequency binning.
141.
Data Reduction Strategies
•Rule-based methods:
• This involves applying rules to the data to
identify patterns or relationships.
• This can be done using techniques such
as
association rule mining or decision trees.
Data Transformation
• Inthis phase of data processing the data is
transformed or consolidated so that the
resulting mining process may be more
efficient, and the patterns found may be
easier to understand. The change made in the
format or the structure of the data is called
Data Transformation.
• Data transformation is the process of converting
or modifying data in order to make it more
suitable for analysis or modeling.
144.
Data Transformation Strategies
•Smoothing, which works to remove noise from
the data. Such techniques include binning,
regression, and clustering.
• Attribute construction (or feature construction),
where new attributes are constructed and added
from the given set of attributes to help the mining
process.
145.
Data Transformation Strategies
•Aggregation
• where summary or aggregation operations are
applied to the data. For example, the daily sales
data may be aggregated so as to compute
monthly and annual total amounts. This step is
typically used in constructing a data cube for
analysis of the data at multiple levels of
abstraction.
146.
Data Transformation Strategies
•Normalization:
• Normalization is a method of scaling data so that it
falls within a specific range. For example, we
can normalize a dataset so that all values fall
between 0 and 1. This can be useful for
comparing variables with different units or scales.
For example, if we have a dataset with
variables measured in dollars and variables
measured in inches, normalization can help us to
compare these variables on an equal scale.
147.
Data Transformation Strategies
•Discretization, where the raw values of a numeric
attribute (such as age) are replaced by interval
labels (e.g., 0-10, 11-20, and so on) or conceptual
labels (e.g., youth, adult, and senior).
• Hierarchy Generation for nominal data, where
attributes such as street can be generalized to
higher- level concepts, like city or country.
148.
Data Transformation Strategies
•Feature scaling: Feature scaling is a method of transforming
data so that it falls within a specific range or distribution. It can
be used to normalize data or to improve the convergence of
machine learning algorithms. For example, we can use feature
scaling to scale a dataset of heights and weights so that they are
on the same scale.
• Imputation: Imputation is a method of filling in missing data
with estimated values. It can be used to address missing data or
to improve the accuracy of machine learning algorithms.
For example, we can use imputation to fill in missing values
in a dataset of medical records.
Data Discretization
• Datadiscretization is the process of converting
continuous data into a finite set of discrete values.
• This is done by dividing the range of continuous values
into intervals or bins, and assigning each observation to
the bin that it falls into.
• Discretization is often used in data analysis and
machine learning to simplify the data and make it easier
to work with. Discretizing continuous data can reduce
noise and make patterns more apparent, and can also
help to reduce the size of the dataset.
151.
Discretization by Binning
•These methods are also used as discretization methods
for data reduction and concept hierarchy generation.
• For example, attribute values can be discretized by
applying equal-width or equal-frequency binning, and
then replacing each bin value by the bin mean or median,
as in smoothing by bin means or smoothing by bin
medians, respectively. These techniques can be applied
recursively to the resulting partitions in order to
generate concept hierarchies.
152.
• Equal widthbinning:
• This method divides the range of the data into a
fixed number of intervals of equal width.
• For example, if we have a dataset with values
ranging from 0 to 100, and we want to
divide it into 5 intervals, each interval would
have a width of 20.
153.
• Equal frequencybinning:
• This method divides the data into intervals so that
each interval contains roughly the same number
of observations.
• For example, if we have a dataset with 100
observations and we want to divide it into 5
intervals, each interval would contain 20
observations.
154.
Discretization by Histogram
Analysis
•histogram analysis is an unsupervised
discretization technique because it does not use
class information
• A histogram partitions the values of an attribute, A,
into disjoint ranges called buckets
• for example, the values are partitioned into equal
sized partitions or ranges
155.
Discretization by Cluster,
DecisionTree, and Correlation
Analyses
• A clustering algorithm can be applied to discretize a
numeric attribute, A, by partitioning the values of A
into clusters or groups
• decision tree approaches to discretization are
supervised, that is, they make use of class label
information
• ChiMerge is a correlation based discretization method,
it considers each distinct value of a numeric attribute
A is considered to be one interval
156.
• Clustering-based methods:
•These methods use clustering algorithms to group
similar observations together into discrete
categories. For example, we can use k-means
clustering to group similar observations together
based on their distance from a set of cluster
centers.
157.
• Decision tree-basedmethods:
• These methods use decision trees to partition the
data into discrete categories based on a set
of decision rules. For example, we can use a
decision tree to split the data into
categories based on the values of specific
attributes.
158.
Summary
• Data qualityis defined in terms of accuracy,
completeness, consistency, timeliness, believability,
and interpretabilty.
• These qualities are assessed
based on the intended use of the data.
159.
Summary
• Data cleaningroutines attempt to fill in missing
values, smooth out noise while identifying
outliers, and correct inconsistencies in the data.
• Data cleaning is usually performed as an iterative
two-step process consisting of discrepancy
detection and data transformation.
160.
Summary
• Data integrationcombines data from
multiple sources to form a coherent data store.
• The resolution of semantic heterogeneity,
metadata, correlation analysis, tuple duplication
detection, and data conflict detection contribute
toward smooth data integration.
161.
Summary
• Data reductiontechniques obtain a reduced
representation of the data while minimizing the
loss of information content.
• These include methods of dimensionality
reduction,
numerosity reduction, and data compression.
162.
Summary
• Data transformationroutines convert the data
into appropriate forms for mining.
• For example, in normalization, attribute data are
scaled so as to fall within a small range such as 0.0
to 1.0.
163.
Summary
• Data discretizationtransforms numeric data by
mapping values to interval or concept labels.
Such methods can be used to automatically
generate concept hierarchies for the data, which
allows for mining at multiple levels of
granularity. Discretization techniques include
binning, histogram analysis, cluster analysis,
decision-tree analysis, and correlation analysis.