TABLE OF CONTENTS
1.General Information
2. Terminology related to Diet, disease and exercise
3. Scientific methods for study
4. Results and outcome
5. Discussion
6. Q&A
4.
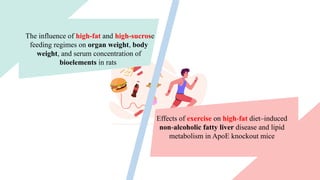
Effects of exerciseon high fat
‑ diet–induced
non alcoholic fatty liver
‑ disease and lipid
metabolism in ApoE knockout mice
The influence of high-fat and high-sucrose
feeding regimes on organ weight, body
weight, and serum concentration of
bioelements in rats
5.
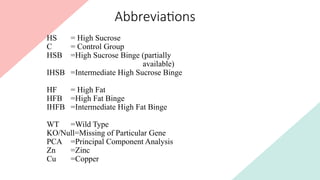
Abbreviations
HS = HighSucrose
C = Control Group
HSB =High Sucrose Binge (partially
available)
IHSB =Intermediate High Sucrose Binge
HF = High Fat
HFB =High Fat Binge
IHFB =Intermediate High Fat Binge
WT =Wild Type
KO/Null=Missing of Particular Gene
PCA =Principal Component Analysis
Zn =Zinc
Cu =Copper
6.
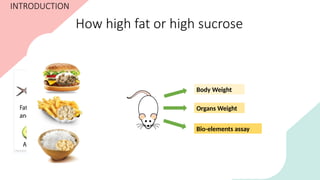
How high fator high sucrose
food looks like?
INTRODUCTION
Body Weight
Organs Weight
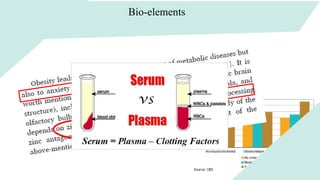
Bio-elements assay
Some background Fatcsand Concern:
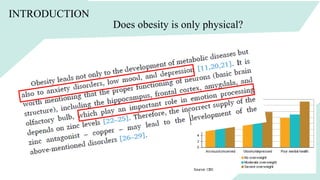
Obesity: Obesity is defined as the pathological accumulation of adipose tissues in the body that exceeds its
physiological needs and adaptation capabilities and may lead to adverse health effects:
In 2019, approximately 38.2 million children under the age of 5 years were overweight or obese. (Can any
one say where was the height percentage found?)
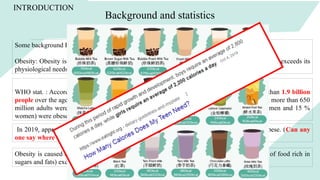
WHO stat. : According to the statistics of World Health Organization (WHO), in 2016, more than 1.9 billion
people over the age of 18 years were overweight (39 % of men and 40 % of women), of whom more than 650
million adults were obese. Overall, in 2016, 13 % of the world’s adult population (11 % men and 15 %
women) were obese.
Obesity is caused due to positive energy balance, i.e., when the energy supply (consumption of food rich in
sugars and fats) exceeds the energy expenditure (e.g., low physical activity).
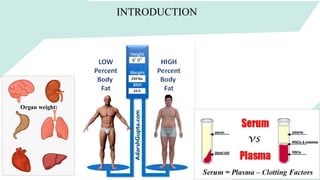
INTRODUCTION
Background and statistics
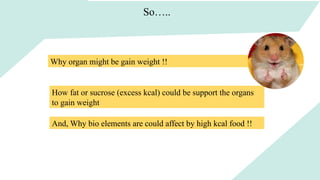
So…..
Why organ mightbe gain weight !!
How fat or sucrose (excess kcal) could be support the organs
to gain weight
And, Why bio elements are could affect by high kcal food !!
13.
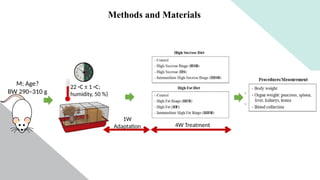
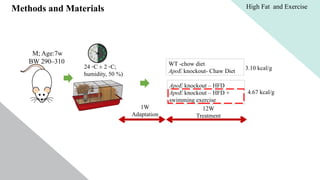
Methods and Materials
M;Age?
BW 290–310 g
22 ◦C ± 1 ◦C;
humidity, 50 %)
1W
Adaptation 4W Treatment
14.
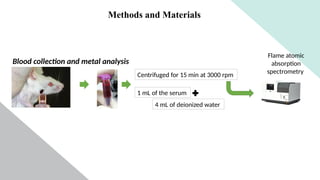
Blood collection andmetal analysis
Centrifuged for 15 min at 3000 rpm
1 mL of the serum
4 mL of deionized water
Flame atomic
absorption
spectrometry
Methods and Materials
15.
Results and Discussion
HighFat -Sucrose and
Organs weight
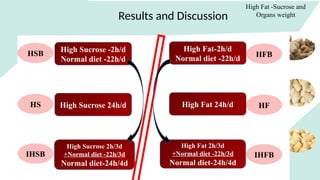
HSB HFB
HS HF
IHSB IHFB
High Sucrose -2h/d
Normal diet -22h/d
High Sucrose 24h/d
High Sucrose 2h/3d
+Normal diet -22h/3d
Normal diet-24h/4d
High Fat-2h/d
Normal diet -22h/d
High Fat 24h/d
High Fat 2h/3d
+Normal diet -22h/3d
Normal diet-24h/4d
17.
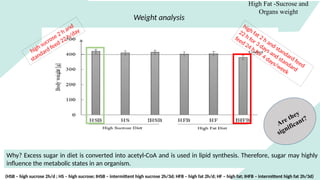
Weight analysis
high sucrose2 h and
standard feed 22 h/day
Why? Excess sugar in diet is converted into acetyl-CoA and is used in lipid synthesis. Therefore, sugar may highly
influence the metabolic states in an organism.
high fat 2 h and standard feed
22 h for 3 days and standard
feed 24 h for 4 days/week
High Fat -Sucrose and
Organs weight
(HSB – high sucrose 2h/d ; HS – high sucrose; IHSB – intermittent high sucrose 2h/3d; HFB – high fat 2h/d; HF – high fat; IHFB – intermittent high fat 2h/3d)
Are they
significant?
18.
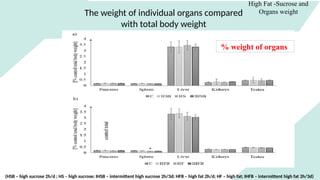
The weight ofindividual organs compared
with total body weight
High Fat -Sucrose and
Organs weight
% weight of organs
(HSB – high sucrose 2h/d ; HS – high sucrose; IHSB – intermittent high sucrose 2h/3d; HFB – high fat 2h/d; HF – high fat; IHFB – intermittent high fat 2h/3d)
19.
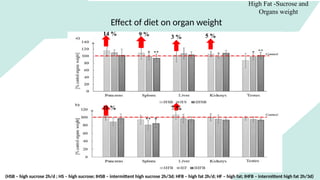
Effect of dieton organ weight
High Fat -Sucrose and
Organs weight
14 % 9 % 3 % 5 %
11 % 7 %
(HSB – high sucrose 2h/d ; HS – high sucrose; IHSB – intermittent high sucrose 2h/3d; HFB – high fat 2h/d; HF – high fat; IHFB – intermittent high fat 2h/3d)
20.
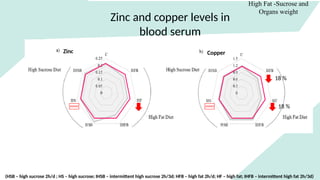
Zinc and copperlevels in
blood serum
High Fat -Sucrose and
Organs weight
Zinc Copper
18 %
18 %
(HSB – high sucrose 2h/d ; HS – high sucrose; IHSB – intermittent high sucrose 2h/3d; HFB – high fat 2h/d; HF – high fat; IHFB – intermittent high fat 2h/3d)
21.
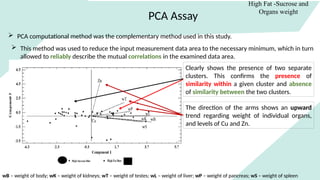
PCA Assay
High Fat-Sucrose and
Organs weight
PCA computational method was the complementary method used in this study.
This method was used to reduce the input measurement data area to the necessary minimum, which in turn
allowed to reliably describe the mutual correlations in the examined data area.
Clearly shows the presence of two separate
clusters. This confirms the presence of
similarity within a given cluster and absence
of similarity between the two clusters.
wB – weight of body; wK – weight of kidneys; wT – weight of testes; wL – weight of liver; wP – weight of pancreas; wS – weight of spleen
The direction of the arms shows an upward
trend regarding weight of individual organs,
and levels of Cu and Zn.
22.
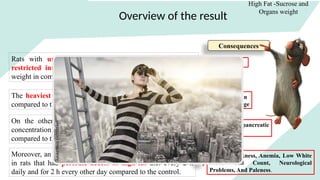
Overview of theresult
High Fat -Sucrose and
Organs weight
Rats with unlimited access to high fat diet (HF) and
restricted intake of high sugar diet have elevated body
weight in comparison to the control.
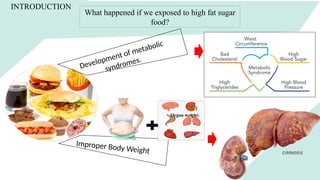
Obesity
The heaviest organ weights were recorded in the HSB rats
compared to the control group.
Chronic organ
disease/damage
On the other hand, an average 20 % decrease in zinc
concentration was observed in rats fed with high-fat diet
compared to the control
Can destroy pancreatic
beta cells
Moreover, an 18 % decrease in copper levels was observed
in rats that had periodic access to high-fat diet every 2 h
daily and for 2 h every other day compared to the control.
Muscle Weakness, Anemia, Low White
Blood Cell Count, Neurological
Problems, And Paleness.
Consequences
23.
This study showedthat exposure to both HF and HS diets increased animal body
weight. However, the chemometric analysis revealed that diets did not have the same
effect in both the investigated groups.
On the other hand principal component analysis revealed greater organ weights and
serum Zn and Cu in the high sucrose group. Thus it appears the high sucrose diet
had a greater impact on the parameters measured here than high fat diet.
Conclusion
24.
INTRODUCTION
Effects of exerciseon high fat
‑ diet–induced
non alcoholic fatty liver
‑ disease and lipid
metabolism in ApoE knockout mice
25.
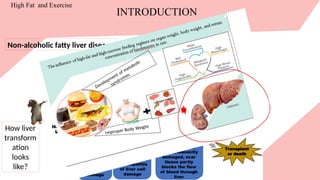
Non-alcoholic fatty liverdisease
High Fat and Exercise
INTRODUCTION
How liver
transform
ation
looks
like?
26.
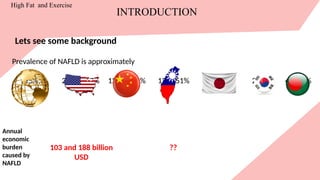
Lets see somebackground
Prevalence of NAFLD is approximately
25%; 21%–24.7% 12.5%–38% 12%–51% 23%–26% 27% 4-18.4%
103 and 188 billion
USD
??
Annual
economic
burden
caused by
NAFLD
INTRODUCTION
High Fat and Exercise
27.
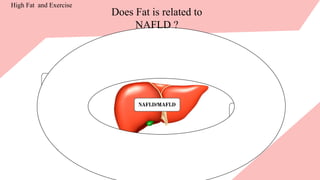
Does Fat isrelated to
NAFLD ?
High Fat and Exercise
28.
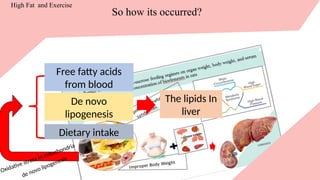
Oxidative stress inmitochondria
de novo lipogenesis
The lipids In
liver
Free fatty acids
from blood
De novo
lipogenesis
Dietary intake
So how its occurred?
High Fat and Exercise
29.
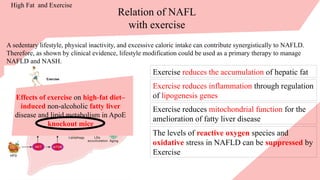
Relation of NAFL
withexercise
A sedentary lifestyle, physical inactivity, and excessive caloric intake can contribute synergistically to NAFLD.
Therefore, as shown by clinical evidence, lifestyle modification could be used as a primary therapy to manage
NAFLD and NASH.
Exercise reduces the accumulation of hepatic fat
Exercise reduces inflammation through regulation
of lipogenesis genes
Exercise reduces mitochondrial function for the
amelioration of fatty liver disease
The levels of reactive oxygen species and
oxidative stress in NAFLD can be suppressed by
Exercise
High Fat and Exercise
Effects of exercise on high fat diet–
‑
induced non alcoholic
‑ fatty liver
disease and lipid metabolism in ApoE
knockout mice
30.
What is Knockout ? High Fat and Exercise
WT= Wild Type= Presence of every gene
and all gene should function properly.
KO= Knock Out= Missing of particular or
specific gene.
All the healthy human or healthy
animals are called WT model
The particular gene could be knock out
or cut out for research purpose or
sometimes due to disease or medicine
our specific gene could be knock out.
Lets see understand why KO is
necessary for study…..
GNMT
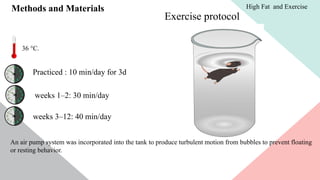
Methods and Materials
Exerciseprotocol
36 °C.
Practiced : 10 min/day for 3d
weeks 1–2: 30 min/day
weeks 3–12: 40 min/day
An air pump system was incorporated into the tank to produce turbulent motion from bubbles to prevent floating
or resting behavior.
High Fat and Exercise
34.
Methods and Materials
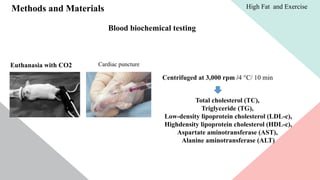
Bloodbiochemical testing
Euthanasia with CO2 Cardiac puncture
Centrifuged at 3,000 rpm /4 °C/ 10 min
Total cholesterol (TC),
Triglyceride (TG),
Low-density lipoprotein cholesterol (LDL-c),
Highdensity lipoprotein cholesterol (HDL-c),
Aspartate aminotransferase (AST),
Alanine aminotransferase (ALT)
High Fat and Exercise
35.
Methods and Materials
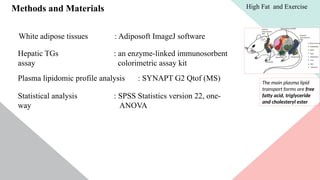
Whiteadipose tissues : Adiposoft ImageJ software
Hepatic TGs : an enzyme-linked immunosorbent
assay colorimetric assay kit
Plasma lipidomic profile analysis : SYNAPT G2 Qtof (MS) The main plasma lipid
transport forms are free
fatty acid, triglyceride
and cholesteryl ester
Statistical analysis : SPSS Statistics version 22, one-
way ANOVA
High Fat and Exercise
36.
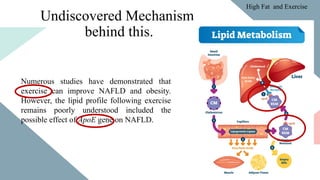
Undiscovered Mechanism
behind this.
Numerousstudies have demonstrated that
exercise can improve NAFLD and obesity.
However, the lipid profile following exercise
remains poorly understood included the
possible effect of ApoE gene on NAFLD.
High Fat and Exercise
37.
So what happenedif we consume HF diet and have exercise and also
have some Gene interaction?
38.
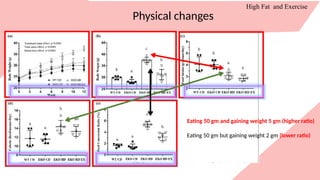
Physical changes
High Fatand Exercise
Eating 50 gm and gaining weight 5 gm (higher ratio)
Eating 50 gm but gaining weight 2 gm (lower ratio)
39.
High Fat andExercise
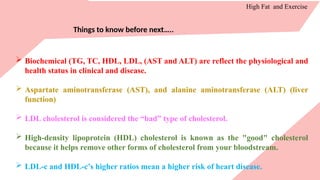
Things to know before next…..
Biochemical (TG, TC, HDL, LDL, (AST and ALT) are reflect the physiological and
health status in clinical and disease.
Aspartate aminotransferase (AST), and alanine aminotransferase (ALT) (liver
function)
LDL cholesterol is considered the “bad” type of cholesterol.
High-density lipoprotein (HDL) cholesterol is known as the "good" cholesterol
because it helps remove other forms of cholesterol from your bloodstream.
LDL-c and HDL-c’s higher ratios mean a higher risk of heart disease.
40.
High Fat andExercise
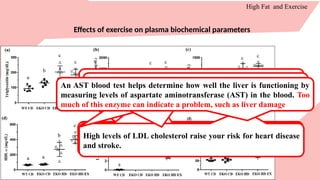
Effects of exercise on plasma biochemical parameters
Causes include obesity, eating too much unhealthy food,
genetics, certain illnesses including poorly controlled diabetes,
kidney disease, and underactive thyroid (hypothyroidism).
Too much cholesterol puts you at risk for heart disease and
stroke. High cholesterol has no signs or symptoms, so the only
way to know if you have it is to get your cholesterol checked.
High levels of LDL cholesterol raise your risk for heart disease
and stroke.
Higher levels of HDL have been associated with a lower risk of
cardiovascular disease.
LDL-c and HDL-c’s higher ratios mean a higher risk of heart
disease.
An AST blood test helps determine how well the liver is functioning by
measuring levels of aspartate aminotransferase (AST) in the blood. Too
much of this enzyme can indicate a problem, such as liver damage
41.
High Fat andExercise
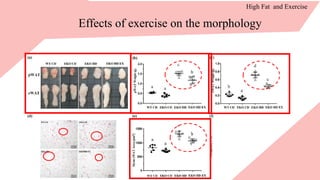
Effects of exercise on the morphology
42.
High Fat andExercise
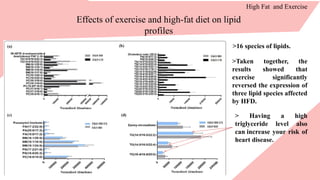
Effects of exercise and high-fat diet on lipid
profiles
>16 species of lipids.
>Taken together, the
results showed that
exercise significantly
reversed the expression of
three lipid species affected
by HFD.
> Having a high
triglyceride level also
can increase your risk of
heart disease.
43.
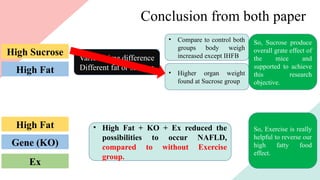
Conclusion from bothpaper
High Fat
High Sucrose
Various time difference
Different fat or sucrose
• Compare to control both
groups body weigh
increased except IHFB
• Higher organ weight
found at Sucrose group
So, Sucrose produce
overall grate effect of
the mice and
supported to achieve
this research
objective.
Gene (KO)
High Fat
Ex
• High Fat + KO + Ex reduced the
possibilities to occur NAFLD,
compared to without Exercise
group.
So, Exercise is really
helpful to reverse our
high fatty food
effect.
#19 The results showed a 14 % increase in pancreatic weight, 9 % increase in spleen weight, 3 % increase in liver weight, and 5 % increase in kidney weight in rats fed with HSB diet. On the contrary, only a 7 % increase in liver weight and 11 % increase in pancreas weight were observed in rats fed with HFB diet The diet had a very little effect on IHSB group which was periodically fed with HS diet, i.e., 3 days a week, 2 h a day (Fig. 4).
#38 Fig. 1 Effects of exercise on growth curve, diet, and feed conversion ratio (FCR). Related indices, such as growth curve (a), final body weight (b),
food intake (c), caloric intake (d), and FCR (e) were recorded during the experiment. Values are presented as the mean ± SD (n = 6). Different letters
indicate significant differences (p < 0.05) compared with the other groups, as assessed by one-way ANOVA. FCR (%): body weight increment/food
intake × 100. EKO CD, apolipoprotein E (ApoE) knockout mice fed a normal chow diet; EKO HD, ApoE knockout mice fed a high-fat diet; EKO HD EX,
ApoE knockout mice fed a high-fat diet along with swimming exercise; WT CD, wild type mice fed a normal chow diet
#39 Fig. 2 Effects of exercise on plasma biochemical variables in ApoE mice feed fed a high-fat diet. The levels of TG (a), TC (b), LDL-c (c), HDL-c
(d), LDL/HDL (e), AST (f), and ALT (g) in plasma were analyzed at the end of the study. Values are presented as the mean ± SD (n = 6). Different
letters indicate significant differences among the groups (one-way ANOVA, p < 0.05). ALT, alanine aminotransferase; ApoE, apolipoprotein E; AST,
aspartate aminotransferase; HDL-c, high-density lipoprotein cholesterol; LDL-c, low-density lipoprotein cholesterol; SD, standard deviation; TC, total
cholesterol; TG, triglyceride
#40 Fig. 2 Effects of exercise on plasma biochemical variables in ApoE mice feed fed a high-fat diet. The levels of TG (a), TC (b), LDL-c (c), HDL-c
(d), LDL/HDL (e), AST (f), and ALT (g) in plasma were analyzed at the end of the study. Values are presented as the mean ± SD (n = 6). Different
letters indicate significant differences among the groups (one-way ANOVA, p < 0.05). ALT, alanine aminotransferase; ApoE, apolipoprotein E; AST,
aspartate aminotransferase; HDL-c, high-density lipoprotein cholesterol; LDL-c, low-density lipoprotein cholesterol; SD, standard deviation; TC, total
cholesterol; TG, triglyceride
#41 Fig. 3 Effects of exercise on adipocyte morphology, weight, and distribution in ApoE mice fed a high-fat diet. Representative gross appearance
of perirenal white adipose tissue (pWAT) and epididymal white adipose tissue (eWAT) (a). Fat mass of pWAT (b) and eWAT (c). Representative H&E
staining of eWAT (d) to determine mean adipocyte size (e) and the distribution of adipocytes (f). Values are presented as the mean ± SD (n = 6).
Different letters indicated significant differences among the groups (one-way ANOVA, p < 0.05). H&E, hematoxylin and eosin
#42 Fig. 5 Multivariate analysis of the lipidomic profile after exercise and high-fat diet. Score plots from PCA and OPLS-DA. PCA score plot for the EKO
CD versus EKO HD groups (a) and EKO HD versus EKO HD EX groups (b). OPLS-DA score plot for the EKO CD versus EKO HD groups (c), EKO HD
versus EKO HD EX groups (d), and EKO CD versus EKO HD versus EKO HD EX groups (e). The x- and y-axes of PCA showing principal components
1 and 2, respectively, and the x- and y-axes of OPLS-DA showing the variance explained among and within the groups, respectively. OPLS-DA,
orthogonal projections to latent structures discriminant analysis; PCA, principal component analysis