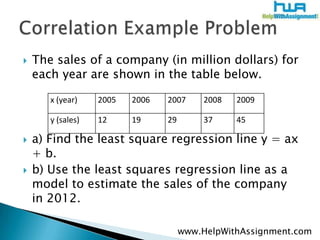
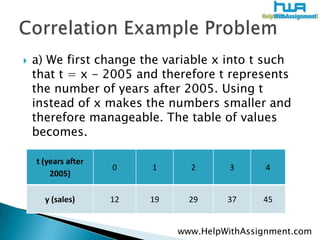
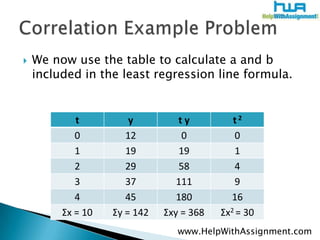
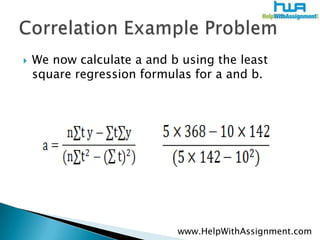
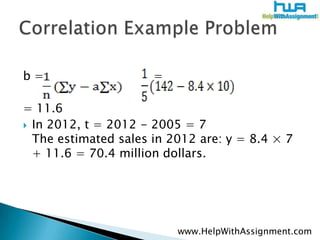
Statistics at HelpWithAssignment.com (Regression)www.HelpWithAssignment.com
Regression is an important concept in Statistics. Regression is used to measure the relation between two or more variables where one is independent and the others are dependant variables. Regression can be used to predict the dependant variable when the independent variable is known. Regression	www.HelpWithAssignment.com
We can see an example to understand regression clearly.Q: The regression line known as the least squares line is a plot of the expected value of the dependant variable of all values of the independent variable. In regression equation, y is always the dependant variable and x is always the independent variable. Regression	www.HelpWithAssignment.com
The sales of a company (in million dollars) for each year are shown in the table below. a) Find the least square regression line y = ax + b. b) Use the least squares regression line as a model to estimate the sales of the company in 2012. Correlation Example Problem	www.HelpWithAssignment.com
Sol: a) We first change the variable x into t such that t = x - 2005 and therefore t represents the number of years after 2005. Using t instead of x makes the numbers smaller and therefore manageable. The table of values becomes. Correlation Example Problem	www.HelpWithAssignment.com
a) We first change the variable x into t such that t = x - 2005 and therefore t represents the number of years after 2005. Using t instead of x makes the numbers smaller and therefore manageable. The table of values becomes. Correlation Example Problem	www.HelpWithAssignment.com
We now use the table to calculate a and b included in the least regression line formula. Correlation Example Problem	www.HelpWithAssignment.com
We now calculate a and b using the least square regression formulas for a and b. Correlation Example Problem	www.HelpWithAssignment.com
b =                             =   		= 11.6In 2012, t = 2012 - 2005 = 7 The estimated sales in 2012 are: y = 8.4 × 7 + 11.6 = 70.4 million dollars.Correlation Example Problem	www.HelpWithAssignment.com
At HelpWithAssignment.com we provide best quality Assignment help, Homework help, Online Tutoring and Thesis and Dissertation help as well. For any of the above services you can contact us at http://www.helpwithassignment.com/ andhttp://www.helpwithassignment.com/statistics-assignment-helpHelpWithAssignment.com	www.HelpWithAssignment.com
You can follow us on our blogs at http://helpwithassignment.blogspot.com/ andhttp://helpwithassignment.wordpress.com/Thank YouHelpWithAssignment.com	www.HelpWithAssignment.com

Statistics at HelpWithAssignment.com Regression Example

  • 1.
    Statistics at HelpWithAssignment.com(Regression)www.HelpWithAssignment.com
  • 2.
    Regression is animportant concept in Statistics. Regression is used to measure the relation between two or more variables where one is independent and the others are dependant variables. Regression can be used to predict the dependant variable when the independent variable is known. Regression www.HelpWithAssignment.com
  • 3.
    We can seean example to understand regression clearly.Q: The regression line known as the least squares line is a plot of the expected value of the dependant variable of all values of the independent variable. In regression equation, y is always the dependant variable and x is always the independent variable. Regression www.HelpWithAssignment.com
  • 4.
    The sales ofa company (in million dollars) for each year are shown in the table below. a) Find the least square regression line y = ax + b. b) Use the least squares regression line as a model to estimate the sales of the company in 2012. Correlation Example Problem www.HelpWithAssignment.com
  • 5.
    Sol: a) Wefirst change the variable x into t such that t = x - 2005 and therefore t represents the number of years after 2005. Using t instead of x makes the numbers smaller and therefore manageable. The table of values becomes. Correlation Example Problem www.HelpWithAssignment.com
  • 6.
    a) We firstchange the variable x into t such that t = x - 2005 and therefore t represents the number of years after 2005. Using t instead of x makes the numbers smaller and therefore manageable. The table of values becomes. Correlation Example Problem www.HelpWithAssignment.com
  • 7.
    We now usethe table to calculate a and b included in the least regression line formula. Correlation Example Problem www.HelpWithAssignment.com
  • 8.
    We now calculatea and b using the least square regression formulas for a and b. Correlation Example Problem www.HelpWithAssignment.com
  • 9.
    b = = = 11.6In 2012, t = 2012 - 2005 = 7 The estimated sales in 2012 are: y = 8.4 × 7 + 11.6 = 70.4 million dollars.Correlation Example Problem www.HelpWithAssignment.com
  • 10.
    At HelpWithAssignment.com weprovide best quality Assignment help, Homework help, Online Tutoring and Thesis and Dissertation help as well. For any of the above services you can contact us at http://www.helpwithassignment.com/ andhttp://www.helpwithassignment.com/statistics-assignment-helpHelpWithAssignment.com www.HelpWithAssignment.com
  • 11.
    You can followus on our blogs at http://helpwithassignment.blogspot.com/ andhttp://helpwithassignment.wordpress.com/Thank YouHelpWithAssignment.com www.HelpWithAssignment.com