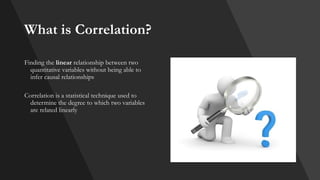
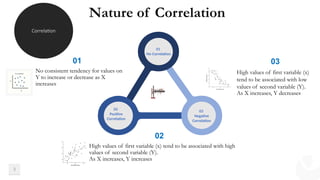
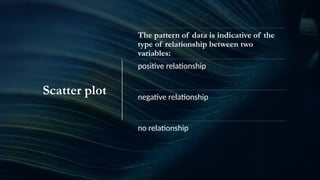
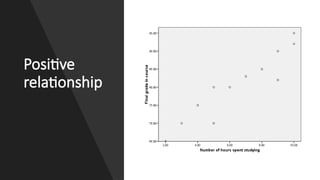
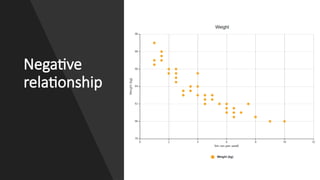
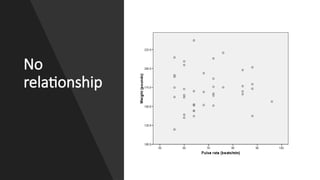
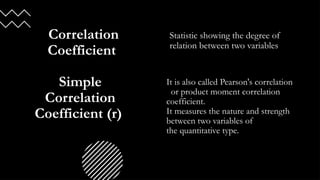
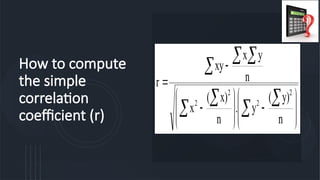
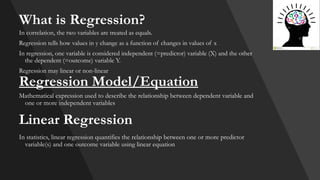
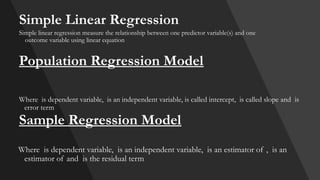
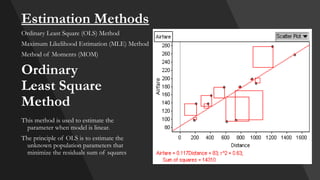
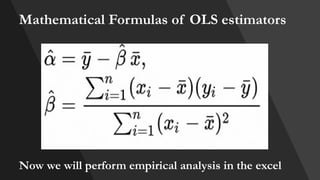
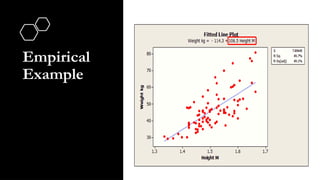
Correlation
and
Regression
What is Correlation?
Finding the linear relationship between two
quantitative variables without being able to
infer causal relationships
Correlation is a statistical technique used to
determine the degree to which two variables
are related linearly
3
Nature of Correlation
03
High values of first variable (x)
tend to be associated with low
values of second variable (Y).
As X increases, Y decreases
02
High values of first variable (x) tend to be associated with high
values of second variable (Y).
As X increases, Y increases
01
No Correlation
02
Positive
Correlation
01
No consistent tendency for values on
Y to increase or decrease as X
increases
Correlation
03
Negative
Correlation
Scatter plot
The pattern of data is indicative of the
type of relationship between two
variables:
positive relationship
negative relationship
no relationship
Positive
relationship
Negative
relationship
No
relationship
Correlation
Coefficient
Simple
Correlation
Coefficient (r)
Statistic showing the degree of
relation between two variables
It is also called Pearson's correlation
or product moment correlation
coefficient.
It measures the nature and strength
between two variables of
the quantitative type.
-1 1
0
-0.25
-0.75 0.75
0.25
strong strong
intermediate intermediate
weak weak
no relation
Perfect Negative
correlation
perfect Positive
correlation
positive
negative
The value of r ranges between ( -1) and ( +1)
The value of r denotes the strength of the association as
illustrated by the following diagram.
How to compute
the simple
correlation
coefficient (r) 



















 
 
  
n
y)
(
y
.
n
x)
(
x
n
y
x
xy
r
2
2
2
2
What is Regression?
In correlation, the two variables are treated as equals.
Regression tells how values in y change as a function of changes in values of x
In regression, one variable is considered independent (=predictor) variable (X) and the other
the dependent (=outcome) variable Y.
Regression may linear or non-linear
Linear Regression
In statistics, linear regression quantifies the relationship between one or more predictor
variable(s) and one outcome variable using linear equation
Mathematical expression used to describe the relationship between dependent variable and
one or more independent variables
Regression Model/Equation
Simple Linear Regression
Simple linear regression measure the relationship between one predictor variable(s) and one
outcome variable using linear equation
Population Regression Model
Where is dependent variable, is an independent variable, is called intercept, is called slope and is
error term
Sample Regression Model
Where is dependent variable, is an independent variable, is an estimator of , is an
estimator of and is the residual term
Ordinary
Least Square
Method
This method is used to estimate the
parameter when model is linear.
The principle of OLS is to estimate the
unknown population parameters that
minimize the residuals sum of squares
Estimation Methods
Ordinary Least Square (OLS) Method
Maximum Likelihood Estimation (MLE) Method
Method of Moments (MOM)
Mathematical Formulas of OLS estimators
Now we will perform empirical analysis in the excel
Empirical
Example
Thanks

Correlation and regression with Formulas and examples

  • 1.
  • 2.
    What is Correlation? Findingthe linear relationship between two quantitative variables without being able to infer causal relationships Correlation is a statistical technique used to determine the degree to which two variables are related linearly
  • 3.
    3 Nature of Correlation 03 Highvalues of first variable (x) tend to be associated with low values of second variable (Y). As X increases, Y decreases 02 High values of first variable (x) tend to be associated with high values of second variable (Y). As X increases, Y increases 01 No Correlation 02 Positive Correlation 01 No consistent tendency for values on Y to increase or decrease as X increases Correlation 03 Negative Correlation
  • 4.
    Scatter plot The patternof data is indicative of the type of relationship between two variables: positive relationship negative relationship no relationship
  • 5.
  • 6.
  • 7.
  • 8.
    Correlation Coefficient Simple Correlation Coefficient (r) Statistic showingthe degree of relation between two variables It is also called Pearson's correlation or product moment correlation coefficient. It measures the nature and strength between two variables of the quantitative type.
  • 9.
    -1 1 0 -0.25 -0.75 0.75 0.25 strongstrong intermediate intermediate weak weak no relation Perfect Negative correlation perfect Positive correlation positive negative The value of r ranges between ( -1) and ( +1) The value of r denotes the strength of the association as illustrated by the following diagram.
  • 10.
    How to compute thesimple correlation coefficient (r)                            n y) ( y . n x) ( x n y x xy r 2 2 2 2
  • 11.
    What is Regression? Incorrelation, the two variables are treated as equals. Regression tells how values in y change as a function of changes in values of x In regression, one variable is considered independent (=predictor) variable (X) and the other the dependent (=outcome) variable Y. Regression may linear or non-linear Linear Regression In statistics, linear regression quantifies the relationship between one or more predictor variable(s) and one outcome variable using linear equation Mathematical expression used to describe the relationship between dependent variable and one or more independent variables Regression Model/Equation
  • 12.
    Simple Linear Regression Simplelinear regression measure the relationship between one predictor variable(s) and one outcome variable using linear equation Population Regression Model Where is dependent variable, is an independent variable, is called intercept, is called slope and is error term Sample Regression Model Where is dependent variable, is an independent variable, is an estimator of , is an estimator of and is the residual term
  • 13.
    Ordinary Least Square Method This methodis used to estimate the parameter when model is linear. The principle of OLS is to estimate the unknown population parameters that minimize the residuals sum of squares Estimation Methods Ordinary Least Square (OLS) Method Maximum Likelihood Estimation (MLE) Method Method of Moments (MOM)
  • 14.
    Mathematical Formulas ofOLS estimators Now we will perform empirical analysis in the excel
  • 15.
  • 16.

Editor's Notes

  • #3 © Copyright Showeet.com – Creative & Free PowerPoint Templates