Reference
Newman, Earl E. “Yellow Signal Timing – Lessons Learned from a Red Light Camera Program.” Conference Paper ID AB10H2601, Presented at the 2010 ITE Annual Meeting and Exhibit, Vancouver, Canada, August 8th-10th, 2010. ( second attachment )
Read the above referenced paper and answer the questions below. The paper is on the shared drive (handouts directory). Write your answers directly into this handout and turn it in on the due date listed above. If you look up any information online and use it in your response, be sure to include a link to the document’s location.
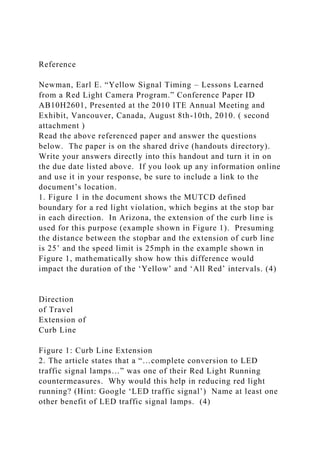
1. Figure 1 in the document shows the MUTCD defined boundary for a red light violation, which begins at the stop bar in each direction. In Arizona, the extension of the curb line is used for this purpose (example shown in Figure 1). Presuming the distance between the stopbar and the extension of curb line is 25’ and the speed limit is 25mph in the example shown in Figure 1, mathematically show how this difference would impact the duration of the ‘Yellow’ and ‘All Red’ intervals. (4)
Direction
of Travel
Extension of
Curb Line
Figure 1: Curb Line Extension
2. The article states that a “…complete conversion to LED traffic signal lamps…” was one of their Red Light Running countermeasures. Why would this help in reducing red light running? (Hint: Google ‘LED traffic signal’) Name at least one other benefit of LED traffic signal lamps. (4)
3. Looking at Table 2, rear end crashes increased after the installation of red light cameras not just at intersections where cameras were installed, but at all locations. What might be the cause of this system-wide increase? (4)
4. In this paper, the City of Springfield and the Missouri DOT used a Memorandum of Understanding (MOU) to establish common practices for timing clearance intervals. What other items in a transportation system might be improved if agencies engaged in more coordination across jurisdictional boundaries? Name 2. (4)
5. In this paper, the agencies involved used a perception-reaction time of 1.5s for timing clearance intervals, while the recommended value for practice is 1.0 seconds. What was the justification given for this choice? (4)
page 2 of 2
Yellow Signal Timing –
Lessons Learned from a Red Light Camera Program
Earl E. Newman
Abstract: The City Council for the City of Springfield, Missouri, approved a contract to install
up to sixteen cameras for automated red light enforcement in the spring of 2006. During the
implementation phase of the program, test sampling of potential intersections for placement of
the cameras revealed significant differences in yellow timings and red light running at city
signals compared to Missouri DOT signals inside the city.
This difference prompted city and state traffic engineers to review their respective methods of
calculating the yellow and all-red timings. Despite using the same equation recommended by
ITE, the agencies used different assumpt ...
ReferenceNewman, Earl E. Yellow Signal Timing – Lessons Learn.docx
1. Reference
Newman, Earl E. “Yellow Signal Timing – Lessons Learned
from a Red Light Camera Program.” Conference Paper ID
AB10H2601, Presented at the 2010 ITE Annual Meeting and
Exhibit, Vancouver, Canada, August 8th-10th, 2010. ( second
attachment )
Read the above referenced paper and answer the questions
below. The paper is on the shared drive (handouts directory).
Write your answers directly into this handout and turn it in on
the due date listed above. If you look up any information online
and use it in your response, be sure to include a link to the
document’s location.
1. Figure 1 in the document shows the MUTCD defined
boundary for a red light violation, which begins at the stop bar
in each direction. In Arizona, the extension of the curb line is
used for this purpose (example shown in Figure 1). Presuming
the distance between the stopbar and the extension of curb line
is 25’ and the speed limit is 25mph in the example shown in
Figure 1, mathematically show how this difference would
impact the duration of the ‘Yellow’ and ‘All Red’ intervals. (4)
Direction
of Travel
Extension of
Curb Line
Figure 1: Curb Line Extension
2. The article states that a “…complete conversion to LED
traffic signal lamps…” was one of their Red Light Running
countermeasures. Why would this help in reducing red light
running? (Hint: Google ‘LED traffic signal’) Name at least one
other benefit of LED traffic signal lamps. (4)
2. 3. Looking at Table 2, rear end crashes increased after the
installation of red light cameras not just at intersections where
cameras were installed, but at all locations. What might be the
cause of this system-wide increase? (4)
4. In this paper, the City of Springfield and the Missouri DOT
used a Memorandum of Understanding (MOU) to establish
common practices for timing clearance intervals. What other
items in a transportation system might be improved if agencies
engaged in more coordination across jurisdictional boundaries?
Name 2. (4)
5. In this paper, the agencies involved used a perception-
reaction time of 1.5s for timing clearance intervals, while the
recommended value for practice is 1.0 seconds. What was the
justification given for this choice? (4)
page 2 of 2
Yellow Signal Timing –
Lessons Learned from a Red Light Camera Program
Earl E. Newman
Abstract: The City Council for the City of Springfield,
Missouri, approved a contract to install
up to sixteen cameras for automated red light enforcement in
the spring of 2006. During the
implementation phase of the program, test sampling of potential
intersections for placement of
the cameras revealed significant differences in yellow timings
and red light running at city
3. signals compared to Missouri DOT signals inside the city.
This difference prompted city and state traffic engineers to
review their respective methods of
calculating the yellow and all-red timings. Despite using the
same equation recommended by
ITE, the agencies used different assumptions for perception-
reaction time and how to interpret
and use the results. City and state traffic engineers came to
agreement and documented the
assumptions to be used in a Memo of Understanding (MOU) to
bring consistency to the yellow
and all-red timings throughout the city. The result was that
yellow time at all city signals was
increased and yellow time at nearly all state signals was
decreased.
All signals were retimed in conformance with the MOU in the
spring of 2008 and in
conformance to ITE recommended practice, three months prior
to the first red light camera start-
up and 18 months prior to the installation of a camera on an
intersection where the yellow time
had been reduced. The result of the signal retiming has brought
credibility to the red light camera
program for the public and media with a reduction in rear-end
crashes in addition to a reduction
in total crashes at traffic signals.
INTRODUCTION
The City of Springfield, Missouri, has developed a model red
light camera enforcement program.
The program has reduced red light running and right-angle
crashes while being virtually revenue
4. neutral. From the start of the program, Springfield has been
committed to a program that helps
save lives and property. Because the program has been focused
on safety, not revenue,
community support has been high which is reflected in the news
media.
This paper is a summary of practices applied and lessons
learned. The keys to success have been
1) implementation of traffic engineering countermeasures before
considering a red light camera
program; 2) the traffic engineering staff has been engaged in the
red light camera program from
the start; 3) the selection of the vendor; 4) the selection of
intersections and approaches that will
raise motorist awareness to “Respect Red” and contribute to
improved driver behavior and safety
at all signalized intersections; 5) using the ITE proposed
recommended practice to calculate the
yellow change interval with retiming of all traffic signals prior
to the start of the camera
program; 6) reducing red light running and angle crashes; 7)
being revenue neutral; and 8)
achieving public (and media) acceptance of the program.
BACKGROUND
According to a recent USA Today article, there are 439
communities using red light cameras, yet
there continues to be organized efforts to ban the use of the
cameras. Unfortunately, camera
programs have been operated wherein 1) the vendors have
specified the yellow signal timing, 2)
yellow times have been found to be shorter at intersections with
5. cameras than at adjacent
intersections, 3) right turn on red is being strictly enforced at
the stop line, 4) there is a lack of
uniformity and consistency in the application of the ITE
nationally recommended practice for
determining the yellow change interval, and 5) many programs
are making large sums of money.
The programs that are making large amounts of money are the
primary targets of the anti-camera
advocates because the revenue is indicative of motorists
continuing to run red traffic signals.
WHAT IS THE LEGAL DEFINITION OF YELLOW AND RED
SIGNALS?
The Manual on Uniform Traffic Control Devices (MUTCD) and
the Uniform Vehicle Code
(UVC) defines yellow and red signals as follows:
Yellow Indication – Vehicular traffic facing a steady circular
yellow or yellow arrow signal is
thereby warned that the related green movement is being
terminated or that a red indication will
be exhibited immediately thereafter. A circular yellow or
yellow arrow indication, as
appropriate, shall be displayed immediately after every circular
green or green arrow interval.
Vehicles may legally enter the intersection while the yellow
indication is displayed.
Red Indication – Vehicular traffic facing a steady circular red
or red arrow indication alone shall
stop at a clearly marked stop line, but if none, before entering
the crosswalk on the near side of
the intersection, or if none, then before entering the
6. intersection, and shall remain standing until
an indication to proceed is shown. Vehicles that legally entered
the intersection while a green
or yellow indication was displayed may continue to cross the
intersection.
The red indication definition does not exclude right turn on red,
as may be allowed.
Enforcement of RTOR has become highly controversial with red
light enforcement cameras,
particularly if motorists stop but at a point past the stop line,
which blocks the path for
pedestrians, with either a marked or unmarked crosswalk. (1),
(2)
WHAT IS RED LIGHT RUNNING? STATE LAWS GOVERN
The “Permissive Yellow Rule” is that stated in the MUTCD and
Uniform Vehicle Code (UVC).
That is, vehicles can enter on yellow and legally be in the
intersection on red as long as they
entered the intersection on yellow. 37 states and the District of
Columbia have laws in
substantial conformity with the meaning of yellow and red
indications in the MUTCD and UVC.
State laws in the other states use what is called the “Restrictive
Yellow Rule” taking one of two
forms: that is, vehicles can neither enter the intersection nor be
in the intersection on red; or
vehicles must stop upon receiving the yellow indication unless
it is not possible to do so safely.
7. States using the Restrictive Yellow Rule are not in conformity
to the MUTCD and UVC. (1), (2)
The Permissive Yellow Rule is the legal basis for ITE’s
procedure for calculating the yellow
phase change interval. (3) “ITE’s procedure is the same for all
states regardless of the provision
of the local laws. The engineer must use judgment in the
application of the procedure to ensure
that the yellow signal length is compliant with any local or state
laws that govern the
jurisdiction.” (4)
Figure 1. Boundary for a red light violation using stop lines.
(5)
According to the MUTCD, the boundary for a red light violation
begins at the marked stop line
and for purposes of a red light camera program, it is necessary
to provide a stop line to define the
intersection. A driver is running a red light if his or her vehicle
enters the red shaded area as
shown in Exhibit 1, after the light turns red. (5)
SPRINGFIELD’S RED LIGHT CAMERA SYSTEM
In the early 2000’s, concern began to rise in the community
regarding red light running.
Enforcement of red light running by officers in the field had
become nearly impossible. The
courts were requiring that officers testify that they saw the same
traffic signal as the motorist
who was cited for running a red signal. It was virtually
8. impossible for officers to follow a red
light runner through an intersection after the signal had changed
to red and use of two officer
teams was not a good use of limited manpower. In response to
this concern, in January 2001,
City Council raised the minimum fine for running a red signal
from $29 to $100.
In the spring of 2006, the City Council authorized installation
of 16 red light enforcement
cameras with certain conditions: no photos of the drivers, civil
penalty of $100 (no points or info
to the insurance company), violations would be confirmed by a
police officer, citations would be
sent to the registered owner of the vehicle, the vendor to be paid
a flat rate per camera, and
revenue from the paid citations would be used to pay the cost of
the program. The City Traffic
Engineer would select the camera locations with concurrence of
the City Manager.
RED LIGHT RUNNING COUNTERMEASURES
In the three years prior to beginning the red light camera
program, the City implemented a
number of red light running countermeasures which would help
motorists to reduce red light
running. These countermeasures included complete conversion
to LED traffic signal lamps, a
pilot program of red light indicator lights at several
intersections to assist the police to know
when a motorist is running a red signal, launched a major public
education program. The Public
9. Information campaign included PSA’s, brochures, media events,
bumper stickers and on-street
signing to remind motorists to “Respect Red”.
SELECTION OF CANDIDATE INTERSECTIONS
Following authorization of the red light camera program, traffic
engineering staff determined
that it would be advantageous to place cameras at high volume,
high crash frequency
intersections throughout the city. Using the highest volume
four (4) north-south major arterials
and their intersections with the highest volume four (4) east-
west major arterials would include
13 of the highest 14 volume intersections in the city. In
addition, there were collectively over
500 crashes at these intersections (in 2005) with over 8% of the
angle type.
Of the 15 candidate intersections, 11 intersections were under
the jurisdiction of the Missouri
Department of Transportation (MoDOT) and only four (4)
intersections were under the City of
Springfield jurisdiction. See Figure 2. Selection of the
intersections in this manner also helped to
insure a geographic distribution of the cameras throughout the
city.
These high volume intersections had several features in
common:
• Traffic volume was > 50,000 vpd at every intersection (Over
800,000 vpd total)
• Over 500 crashes total at these intersections in 2005 with over
8% angle types
10. • High volume made these intersections the most difficult for
police to enforce
• 40 mph speed limits on all streets (except 35 mph on one
approach at one intersection)
• Separate right turn lanes with channelizing islands on all
approaches
• “Protected Only” left turn signal operation with dual left turn
lanes on all approaches
• Signal operation is interconnected with adjacent signals
Figure 2. Candidate Intersections for Red Light Cameras. (Red
– City; Purple – MoDOT)
Figure 3. Typical geometrics for a high volume intersection of
two major arterials
With the start the red light camera program, Springfield traffic
engineers recognized that they
would need to be involved in the program. This included
selection of the vendor, to approval of
design plans and wiring interface to city signal controllers,
approval of the location and
installation of the field equipment, be responsible for
monitoring crash records, and most
importantly, insure proper yellow signal timing. Although City
staff had used the ITE
recommended equation for over 20 years, staff was not sure how
MoDOT was timing the yellow
intervals at their signals. It was also important to the success of
the red light camera program
11. that the City and MoDOT time the yellow signals using the
same procedure since motorists
could drive through City and MoDOT signals on the same
street.
TESTING FOR RED LIGHT RUNNING
The need to look closer at the yellow times became even clearer
as the selected vendor
completed the first round of pre-testing for red light running at
the candidate intersections. To the
vendor’s credit, the vendor immediately advised staff to review
the data because there was a
remarkable difference between red light running at MoDOT
intersections compared to City
intersections. Table 1 below summarizes the initial pre-testing
results:
Table 1: Red Light Running Pre-Testing – Before & After
Retiming
Pre-Testing for Red Light Running - Before Retiming –
12/15/06
Approaches/Intersections # of Violations Violations/Approach
City Signals 16/4 210 13.1
MoDOT Signals 23/11 64 2.78
Pre-Testing for Red Light Running - After Retiming – 9/5/07
12. # of Approaches # of Violations Violations/Approach
City Signals 8/2 42 5.25
MoDOT Signals 8/2 19 2.38
Note: Before Installation of Cameras for Both Studies
Based on the pre-test results, there was significantly more red
light running at City intersections
than at MoDOT intersections. One City intersection was found
to have a total of 69 red light
running violations in a 10 hour period and all be one of the 16
approaches in the testing before
the retiming had at least 10 violations. 18 of the 23 approaches
to MoDOT signals had 5 or
fewer violations in the testing before retiming.
A review of MoDOT yellow timing revealed that MoDOT was
using a much longer yellow time
than the City. Table A-1 in the Appendix summarizes the
yellow phase change and all-red
clearance interval timings at the candidate traffic signals prior
to the retiming of the yellows.
With 115 MoDOT signals and 137 City signals in the city, were
motorists running the City
signals with greater frequency because MoDOT signals had a
longer yellow and the shorter
yellow for City signals was unexpected? Or, were motorists not
running the MoDOT signals
with as much frequency because motorists familiar with City
signals were expecting shorter
yellows?
It would have been a simple solution for the City to simply
13. lengthen all yellow intervals to match
MoDOT. However, since both agencies use the ITE equation to
calculation the yellow phase
change interval, shouldn’t both agencies be arriving at the same
results, assuming that the
agencies were using the same assumptions for the variables?
Advice was sought from Richard Retting, formerly of the
Insurance Institute for Highway Safety
(IIHS), an ITE member and recognized expert on red light
running and applications with red
light camera enforcement. Richard advised the City and
MoDOT to use the ITE recommended
equation and find agreement on the assumptions so the yellow
times would be determined in a
consistent manner for all signals within the City of Springfield.
ITE PROPOSED RECOMMENDED PRACTICE FOR
DETERMINING VEHICLE
SIGNAL CHANGE INTERVALS
ITE recommended practice was developed in consideration of
state laws for a permissive yellow
rule, consistent with the Uniform Vehicle Code and MUTCD
definitions of a red light violation,
to support safe stopping and an all red clearance interval to
provide for safe passage of vehicles
that may have just entered the intersection when the signal turns
red. (3) The equation for
calculation the Change Period is shown below:
14. Figure 4 - Equation for Calculating the Change Period (6)
The Proposed Recommended Practice published in the July 1989
ITE Journal states, “As
vehicles may legally enter the intersection during the display of
the yellow indication, the yellow
warning interval is not a clearance interval . . . If it is the
policy of the local agency to provide
clearance time, the traditional practice has been either to add
the time to the yellow warning
interval, or to use what has previously been call the “all red
interval,” herein referred to as the
red clearance interval. When clearance time is to be provided,
it should be in the form of a red
clearance interval . . .”. (3)
CITY OF SPRINGFIELD/MODOT TIMING MOU
Traffic engineering staff from both agencies reviewed the
recommended practice and current
agency policies. Yellow times were as much as 1.6 seconds
longer at MoDOT signals on streets
with the same speed limit as City signals. The difference was in
the assumption for Perception
15. Reaction Time (City used 1.0 seconds / MoDOT used 1.5
seconds) and MoDOT had a policy of
using 0.5 or 1.0 seconds for the all-red clearance interval
resulting in a longer yellow time.
Yellow Change Interval All-Red
CP = t + _ V _ + W + L
CP = Total Phase Change Interval (seconds)
t = Driver’s Perception-Reaction Time
V = Approach Speed (ft/sec)
a = Vehicle Deceleration Rate (ft/sec2)
g = Percent Grade of Roadway Approach
L = Length of Vehicle (feet)
W = Width of Intersection (feet)
As a result of these discussions, a Memorandum of
Understanding (MOU) was drafted for
consideration by both agencies. The MOU was approved on
January 26, 2007 and a copy is
attached in the Appendix.
The basic points of the MOU agreement are summarized below:
– 1.5 second Perception/Reaction Time (Note: City had been
using 1.0 seconds)
– Use of speed limit for Approach Speed
– Vehicle Deceleration Rate (10 ft/sec/sec)
– Adjust for Percent Grade for Downgrade Only
– Length of Vehicle = 20 feet
16. – How to measure the Width of Intersection
– Use the first two terms for the yellow time
– Use of the third term for the all-red time
RETIMING OF ALL TRAFFIC SIGNALS
Four months prior to the first camera going live, City and
MoDOT engineers retimed the yellow
times and the “all-red” time that follows in accordance with the
MOU at all signals in the City of
Springfield. A copy of the Springfield News-Leader newspaper
article is attached in the
Appendix which followed the news release to the public about
the retiming project. Because
many signals would have the yellow times reduced, this was an
extremely important part of the
process.
Table A-1 in the Appendix summarizes the yellow phase change
and all-red clearance interval
timings at the candidate traffic signals after the retiming. It
should be emphasized that all signals
in the City of Springfield were retimed in accordance with the
MOU, not just the signals which
have or may ultimately have a red light enforcement camera.
Consistent yellow times at all
signals in accordance with recommended national practice is
one of the keys to success of a red
light camera program.
RED LIGHT CAMERA PROGRAMS ARE BEING WATCHED
The City of Springfield along with other cities has been cited in
national news stories and on
17. various websites for shortening yellow times to create violators
and . . . make money. Referring
back to Table 1, the MoDOT signals which had the yellow time
shortened actually reduced the
number of red light violators compared to the number of
violators with the longer yellow times.
ITE has been accused by opponents of red light cameras of
making a deliberate change in the
yellow time calculation to force more drivers to run red lights,
thus promoting the use of red light
cameras. On one of these websites, cited in the list of
references, has a quote from Tom Brahms
as follows:
"We do not believe in entrapment," says Thomas W. Brahms,
executive director of the Institute
of Transportation Engineers. “Any engineer or municipality
that timed traffic lights to maximize
ticket revenue would create huge legal liabilities”, he says. "It
would be an absolutely ludicrous
thing to do." (7)
BEFORE/AFTER CRASHES
A comparison has been made of the crashes before and after
installation of red light cameras in
Springfield from the first camera going live on June 30, 2007
thru February 20, 2010. Although
the amount of time that each camera has been operational
varies, the same time periods of the
year have been used for comparison for this summary.
18. As shown in Table 2, angle crashes at intersections with red
light cameras have reduced by
20.51% and by 13.98% at all signals since the start of the
program. Rear end crashes have
increased by 11.24% at the camera locations which is actually
less of an increase than the
15.76% experienced at all signals. However, total crashes are
up by 5.97% at camera locations
compared to all signals which are up by 3.07%. The increase at
the camera locations could be
due to the fact that these intersections are the heaviest volume
intersections in the city.
Concurrent with this increase has been a 2.5% decrease in total
crashes reported in the city in
2009 with the crash history for the city shown in Figure 5.
Table 2 - Crashes Before/After Installation of Cameras
At Signals w/Cameras
Angle Crashes - 20.51%
Rear End Crashes - 11.24%
Total Crashes - 5.97%
19. At All Signals
Angle Crashes - 13.98%
Rear End Crashes - 15.76%
Total Crashes - 3.07%
City-Wide Totals 2006 TO 2009
Total Annual Crashes - 2.50%
SPRINGFIELD PROGRAM CITATIONS & REVENUE
Table 3 summarizes the citations issued and theoretical revenue
over the duration of the red light
camera program in Springfield. Citations per camera have
averaged 1.34 per day per camera
with an average of 1.38 citations per day needed to theoretically
break even with the vendor’s
cost. Although some could accuse the City of attempting to
generate revenue, the program has
lost a minimum of $32,724 despite the fact that the program has
a theoretical income of just
under $1 million since June 30, 2007. It is reported in some
cities that one camera has made
over $1 million in less than a year.
Table 3 - Citations & Revenue - 6/30/07 to 2/20/10
20. TRAFFIC CRASH HISTORY
From the start of the program thru February 20, 2010, red light
running at camera locations has
been reduced by 36%. In the 30 days ending, February 20,
2010, the average violation rate had
been reduced to 1.05 violations per day per camera or 13.6
violations per day at the 13 active
cameras with daily approach volumes of 208,250 vehicles per
day. It is estimated that there is
99.9 % compliance by motorists at intersection approaches with
cameras when signals turn
yellow and only 0.1% of motorists violating the red signals.
It would be easy to say that camera enforcement would not be
necessary with such high
compliance at signals in the city, however, the 36% reduction in
red light running, at
intersections with cameras, and nearly 14% reduction in angle
crashes, city-wide, have made the
camera enforcement an essential ingredient in the city’s traffic
safety program.
21. 7,231 Camera Days
9,684 Approved Citations
---------------------------------------------------------------------------
---------------------------------
1.34 Average Citations Per Day Per Camera
1.38 Average Citations Per Day Per Camera (To Break
Even with Vendor)
---------------------------------------------------------------------------
---------------------------------
$ 968,400 Theoretical Income @ $100 / Citation (If all
penalties are collected)
$1,001,124 Vendor Cost @ $4,194/Month/Camera
---------------------------------------------------------------------------
---------------------------------
< $ 32,724 > Net Expense over Revenue
Figure 5. 1997-2009 Annual Crash Trends, Springfield,
Missouri.
Annual traffic crashes reached a 14 year low in 2009 with
7,436. The reduction in crashes in
Springfield since the high of 8,390 reached in 1999 is the result
of efforts in Enforcement,
Education and Engineering which includes major intersection
bottleneck elimination program,
designing for all users, computerized signal system and
transportation management center,
access management, reduced neighborhood speed limits, traffic
calming, safe routes to school,
conversion to LED signal lamps, traffic safety education, and . .
. use of red light cameras.
22. LEGAL CHALLENGE / PUBLIC ACCEPTANCE
As successful as the Springfield program has been, it is not
without its challenges.
On March 2, 2010, the Missouri Supreme Court ruled that
Springfield has not followed state law
with the appeal process establishes for red light camera
citations. The City had established an
administrative process for hearing citations which are appealed
using an administrative hearing
officer outside of municipal court. This process is used for
several other types of civil violations
in the city and it was thought to be an acceptable manner of due
process.
It is important to note that the cameras were not ruled
unconstitutional, only the process.
However, with the ruling of the Missouri Supreme Court, it has
been necessary to place the red
light camera system on hold. This was done immediately on the
date of the ruling.
The Springfield News-Leader newspaper lead editorial on
March 3, 2010, stated, “. . . When they
(the cameras) were first installed . . . we expressed concern
that they could be used primarily as
revenue generators. The city has shown that isn’t the case . . .
No one should forget that
preventing death and injury is the . . . goal. If cameras can
help, the city should find a way to
keep them up and running.” A copy of this editorial is attached
in the Appendix.
23. CONCLUSIONS
1. Red light running countermeasures to reduce red light
running should be applied before
considering red light cameras with retiming of the yellow
change intervals consistent city-wide.
2. There can be differences between agencies, even in the same
city. It is important to be able to
say to the public and media that the City and MoDOT use
nationally recommended practice.
Consistent timing of yellow change intervals and all-red
clearance intervals throughout the
community has improved safety and given credibility to the
program.
3. Angle crashes will vary year to year at individual signals.
The selection of high volume, high
frequency crash locations using major arterial roadways
distributed around the community has
helped to educate over 800,000 motorists each day to the
presence of a red light camera
enforcement system and to raise awareness to “Respect Red” at
signals throughout the city.
4. Close monitoring of crashes, citations, cost and revenue for
a red light camera program is
important. Agencies should proactively work towards reducing
red light running if the program
begins to make money. A program that is successful in
reducing red light running would have a
diminishing revenue stream and the public support received in
the city of Springfield is primarily
24. due to have a program that has been revenue neutral.
5. A red light camera program is just one of the tools in the
toolbox to reducing crashes and all
safety initiatives contribute to the overall safety program.
ACKNOWLEDGMENTS
The author wishes to acknowledge and thank Ms. Mandy
Buettgen, Senior Traffic Technician,
City of Springfield, for providing crash data and analyses in
support of the City’s Automated
Red Light Enforcement Program.
REFERENCES
(1) FHWA, “Manual on Uniform Traffic Control Devices,”
(MUTCD), U.S. Department
of Transportation (2009).
(2) National Committee on Uniform Traffic Laws and
Ordinances, “Uniform Vehicle Code
– Millennium Edition”, (UVC), (2000).
(3) ITE Technical Council Committee 4A-16. “Proposed
25. Recommended Practice,
Determining Vehicle Signal Change Intervals.” ITE Journal
(July 1989): p. 27-32.
(4) Eccles, Kimberly A. and McGee, Hugh W., “A History of
the Yellow and All-Red
Intervals for Traffic Signals,” prepared for the Institute of
Transportation Engineers,
2001.
(5) FHWA, “Red Light Running,” Safer Roads for a Safer
Future, 2009,
http://safety.fhwa.dot.gov/intersection/redlight/outreach/marketi
ng/rlr_pps022509/long/rl
r_long.pdf
(6) FHWA, “Traffic Control Devices Handbook,” U.S.
Department of Transportation,
Federal Highway Administration (2001).
(7) Jonathan Berr, “Shorter Yellow Lights: Is it Your Town’s
Latest Cash Cow,” Daily
Finance, 2010,
http://www.dailyfinance.com/story/insurance/shorter-yellow-
lights-is-it-
your-towns-latest-cash-cow/19378356/
26. Author’s information:
Earl E. Newman
Assistant Director of Public Works (Retired)
City of Springfield (MO)
P.O. Box 8368
Springfield, MO 65801 USA
Phone 417-864-1863
Fax 417-864-1983
Email: [email protected]
APPENDIX
Clearance Interval Timing –
Memorandum of Understanding (MOU), Approved by
MoDOT January 26, 2007
ingfield (MO)
News-Leader –
“Timing slows red-light cam plan”, News Release RE:
Change in Yellow Timing
News-Leader – “City of
Springfield should adjust red light camera program instead of
27. scrapping it.”
-1 – Phase Change & Clearance Interval Timing – Old
and New Timings
MEMORANDUM OF UNDERSTANDING
RE: Yellow Change and Red Clearance Interval Timing
City of Springfield / MoDOT District 8 (Springfield Office)
Approved on January 26, 2007
Based on discussions January 8, the City and MoDOT District 8
agree to determine and provide
traffic signal yellow change interval and red clearance timing
using common application
procedure guidelines as defined below for all signals within the
city of Springfield:
FORMULA FOR CALCULATIONS
The following equation, provided in the 2001 Traffic Control
Devices Handbook, will be used to
determine the Total Phase Change Interval Time (CP). The
equation includes consideration of
driver perception-reaction time, deceleration element, and time
needed to clear the intersection.
28. CP = t + _ V _ + W + L
Terms in the equation are defined as follows:
CP = Total Phase Change Interval (seconds)
t = Driver’s Perception-Reaction Time
V = Approach Speed (ft/sec)
a = Vehicle Deceleration Rate (ft/sec2)
g = Percent Grade of Roadway Approach
L = Length of Vehicle (feet)
W = Width of Intersection (feet)
YELLOW CHANGE INTERVAL TIME
Yellow Change Interval Time (Y) will be calculated using the
first two terms of the Phase
Change Interval Time Period equation as follows:
Y = t + __ V _____ , rounded up to nearest 0.1
second.
Perception Reaction Time “t” – It is agreed to use 1.5 seconds
for “t” in the equation.
Approach Speed “V” – It is agreed to use the posted speed limit
for the approach speed. If the
speed limit changes across the intersection, the Yellow Change
Interval Time shall be calculated
for each approach using the posted speed limits. The Yellow
Change Interval Time calculated
using the higher approach speed may be used for both directions
29. on the same street.
Deceleration Rate “a” – It is agreed to use a deceleration rate of
10 ft/sec².
Percent Grade of the Roadway Approach “g” – It is agreed to
use g = 0 except where the
approach has a down-grade for which the slope is determined to
be greater than -2%.
If the calculation result is less than 3.0 seconds, the Yellow
Change Interval Time will be set at
3.0 seconds.
RED CLEARANCE INTERVAL TIME
Red clearance time (R) will be calculated using the third term of
the Phase Change Interval Time
equation as follows:
R = W + L , rounded up to nearest 0.1 second.
V
Width of Intersection “W” – It is agreed that the width of the
intersection is to be measured from
the stop bar on the near side to the curb line, or lane edge line
extended, on the far side of the
intersection.
Length of Vehicle “L” – It is agreed to use 20 feet as the length
of vehicle for this calculation.
Approach Speed “V” – It is agreed to use the posted speed limit
30. for the approach speed. If the
speed limit changes across the intersection, the Red Clearance
Interval Time shall be calculated
for each approach using the posted speed limits. The Red
Clearance Interval Time calculated
using the lower approach speed may be used for both directions
on the same street.
APPLICATION OF PHASE CHANGE INTERVAL TIME
CALCULATIONS TO LEFT-
TURN PHASES
Protected/Permissive (P/P) Left Turn Phasing w/Protected Left
Turn Phase in Leading Position
– When a leading protected left turn (ARROW) phase is
followed by a permissive left turn
(CIRCULAR GREEN) phase, use same Yellow Change Interval
Time as calculated for adjacent
through movement to terminate the protected phase. This
guideline is given recognizing that a
motorist may enter the intersection on Yellow Arrow signal,
knowing that the signal will turn to
a Circular Green indication which may be used to complete the
left turn after yielding to
conflicting vehicles and/or pedestrians.
Protected Only (PO) Left Turn Phasing – When Protected Only
left turn phasing is used, either
in the leading or lagging position, use same Yellow Change
Interval Time and Red Clearance
Interval Time as calculated for adjacent through movement.
31. This is a printer friendly version of an article from News-
Leader.com
To print this article open the file menu and choose Print.
Published February 6, 2007
CAMERA DELAYED »
Timing slows red-light cam plan
City, state must align yellow signal timing before camera use
can begin.
Jane Huh
News-Leader
Plans to install cameras at select Springfield intersections have
hit a delay as officials of the city
and the Missouri Department of Transportation work to align
the timing of the yellow signal
lights.
City and state roads operate under the same equation to
calculate the total time for the yellow
and all-red clearance. It was found, however, that "the agencies
use slightly different
assumptions (perception-reaction time, deceleration rates, and
measure of the speed of
approaching traffic) ...," the City Council was told in a memo
from city management.
When the City Council approved the $1.1 million contract with
Laser-Craft in early January, it
32. was expected that the city would see its first camera at the
intersection of National Avenue and
Battlefield Road by February.
The delay puts the first camera's implementation by the end of
February and then three additional
cameras at city signals by the end of May.
Enforcement, however, begins after a 30-day grace period. So
anyone who violates the red light
signal at the intersection within the first 30 days will receive a
warning but will not have to pay
the $100 fine.
For the next month, city and state traffic engineers will work to
re-time the yellow signal times
aligning the length with the state-operated traffic signals.
The changes likely will result in an approximate half-second
increase on city signals and a half-
second decrease for the state-operated signals, totaling 241
intersections, said Earl Newman, the
city's traffic engineer.
"We'll be retiming everything so it's all consistent," Newman
said. "That is so important for the
system to work and for the credibility of the camera system to
work."
Officials plan to have 16 cameras installed through- out the city
by the first quarter of 2008.
The
link e
d
33. imag
e c…
The
link e
d
imag
e c…
SPRINGFIELD NEWS-LEADER - OUR VOICE
City of Springfield should adjust red light camera program
instead of scrapping it
City should examine ways to make system adhere to court
ruling.
MARCH 3, 2010
Ouch. The Missouri Supreme Court has put a big hurt on the
city of Springfield.
No more red light cameras. At least for now.
All pending $100 tickets are dismissed. And there's a chance
those who have already paid fines -
- a total of more than $800,000 since the cameras started
operating in June 2007 -- will get their
money back.
Of course, it's too early to tell the overall impact of the court's
ruling, which found fault not with
the cameras themselves but with the process the city uses to
force car owners to pay fines.
Trying to move that enforcement process along more quickly,
the city opted to use
34. "administrative hearings" with lesser standards of proof and
fewer appeal options. That, the court
said, conflicts with state law.
So, you could say that on this traffic-control issue, the court
found fault with the city for
speeding.
Well, it's time now for everyone to please slow down. If you're
a critic who never liked the
cameras, try to resist that urge to shout "I told you so." The city
was not reckless to install these
devices. And, if you've been a proponent of the cameras, it's
not time to throw in the towel yet,
either.
If there's a way to make this system adhere to the Supreme
Court ruling with adjustments that are
affordable, the city should pursue them. We offered cautious
support to the cameras when they
were first installed. Though we expressed concern that they
could be used primarily as revenue
generators, the city has shown that isn't the case.
What the city could not do, though, was fend off a challenge to
a ticket issued to an indomitable
former state trooper, Adolph Belt Jr. Looking for an upside to
this case, it's a heartening
reminder that the system can work for the little guy. With the
help of an unflappable and
effective attorney, Belt got the attention and support of the
state's top jurists. That certainly
doesn't happen every day.
Hopefully, the city can respond through a careful weighing of
costs versus benefits and find a
35. way -- as other cities have done -- to more fairly balance a
driver's right to a fair hearing against
the pervasive power of this innovative photographic monitoring.
No one should forget that preventing death and injury is the
overarching goal here. If cameras
can help, the city should find a way to keep them up and
running.
Intersection Y R Total Y R Total Y R Total Y R Total Y R
Total Y R Total
National and Sunshine 3.6 2.4 6.0 3.9 2.1 6.0 3.6 2.4 6.0 3.6 2.4
6.0 3.9 2.1 6.0 3.9 2.1 6.0
National and Battlefield 3.9 2.3 6.2 3.9 2.0 5.9 3.9 2.3 6.2 3.9
2.3 6.2 3.9 2.0 5.9 3.9 2.0 5.9
Campbell and Sunshine 3.9 2.1 6.0 3.9 2.1 6.0 3.9 2.1 6.0 3.9
2.1 6.0 3.9 2.1 6.0 3.9 2.1 6.0
Campbell and Battlefield 3.9 2.2 6.1 3.9 2.2 6.1 3.9 2.2 6.1 3.9
2.2 6.1 3.9 2.2 6.1 3.9 2.2 6.1
Kansas and Battlefield 4.4 1.0 5.4 4.8 1.0 5.8 4.4 1.0 5.4 4.4 1.0
5.4 4.8 1.0 5.8 4.8 1.0 5.8
Kansas and Sunshine 5.0 1.0 6.0 5.0 1.0 6.0 5.0 1.0 6.0 5.0 1.0
6.0 5.0 1.0 6.0 5.0 1.0 6.0
Kansas and Chestnut 5.0 0.5 5.5 5.0 0.5 5.5 5.0 0.5 5.5 5.0 0.5
5.5 5.0 0.5 5.5 5.0 0.5 5.5
Kansas and Kearney 5.5 0.5 6.0 6.0 0.5 6.5 5.5 0.5 6.0 5.5 0.5
6.0 6.0 0.5 6.5 6.0 0.5 6.5
Chestnut and Campbell 5.0 1.0 6.0 5.0 0.5 5.5 N/A N/A 5.0 0.5
5.5 N/A
Chestnut and National 4.9 0.5 5.4 4.5 0.5 5.0 4.0 0.5 4.5 4.0 0.5
4.5 4.0 0.5 4.5 4.5 0.5 5.0
Kearney and National 5.0 0.5 5.5 5.0 0.5 5.5 4.0 0.5 4.5 4.0 0.5
36. 4.5 4.0 0.0 4.0 4.0 0.0 4.0
Glenstone and Battlefield 5.0 0.5 5.5 5.0 0.5 5.5 4.0 0.5 4.5 4.0
0.5 4.5 4.0 0.5 4.5 4.0 0.5 4.5
Glenstone and Sunshine 5.0 0.5 5.5 5.0 0.5 5.5 5.0 0.5 5.5 5.0
0.5 5.5 5.0 0.5 5.5 5.0 0.5 5.5
Glenstone and Chestnut 5.0 1.0 6.0 5.0 1.0 6.0 5.0 1.0 6.0 5.0
1.0 6.0 5.0 1.0 6.0 5.0 1.0 6.0
Glenstone and Kearney 5.0 0.5 5.5 5.0 0.5 5.5 5.0 0.5 5.5 5.0
0.5 5.5 5.0 0.5 5.5 5.0 0.5 5.5
Intersection Y R Total Y R Total Y R Total Y R Total Y R
Total Y R Total
National and Sunshine 4.4 2.5 6.9 4.4 2.2 6.6 4.4 2.5 6.9 4.4 2.5
6.9 4.4 2.2 6.6 4.4 2.2 6.6
National and Battlefield 4.4 2.2 6.6 4.4 2.0 6.4 4.4 2.2 6.6 4.4
2.2 6.6 4.4 2.0 6.4 4.4 2.0 6.4
Campbell and Sunshine 4.4 2.0 6.4 4.4 2.0 6.4 4.4 2.0 6.4 4.4
2.0 6.4 4.4 2.0 6.4 4.4 2.0 6.4
Campbell and Battlefield 4.4 2.0 6.4 4.4 2.0 6.4 4.4 2.0 6.4 4.4
2.0 6.4 4.4 2.0 6.4 4.4 2.0 6.4
Kansas and Battlefield 4.8 1.8 6.6 4.4 2.3 6.7 4.8 1.8 6.6 4.8 1.8
6.6 4.4 2.3 6.7 4.4 2.3 6.7
Kansas and Sunshine 4.8 2.0 6.8 4.8 2.3 7.1 4.8 2.0 6.8 4.8 2.0
6.8 4.8 2.3 7.1 4.8 2.3 7.1
Kansas and Chestnut 4.4 2.1 6.5 4.4 2.0 6.4 4.4 2.1 6.5 4.4 2.1
6.5 4.4 2.0 6.4 4.4 2.0 6.4
Kansas and Kearney 4.4 2.3 6.7 4.8 2.2 7.0 4.4 2.3 6.7 4.4 2.3
6.7 4.8 2.2 7.0 4.8 2.2 7.0
Chestnut and Campbell 3.7 2.6 6.3 4.7 1.5 6.2 N/A N/A 4.7 1.5
6.2 N/A
Chestnut and National 4.2 2.0 6.2 4.4 1.6 6.0 4.2 2.0 6.2 4.2 2.0
6.2 4.4 1.6 6.0 4.4 1.6 6.0
Kearney and National 4.1 1.9 6.0 4.4 1.8 6.2 4.1 1.9 6.0 4.1 1.9
6.0 4.4 1.8 6.2 4.4 1.8 6.2
Glenstone and Battlefield 4.4 2.1 6.5 4.4 2.3 6.7 4.4 2.1 6.5 4.4
37. 2.1 6.5 4.4 2.3 6.7 4.4 2.5 6.9
Glenstone and Sunshine 4.4 2.1 6.5 4.4 2.0 6.4 4.4 2.1 6.5 4.4
2.1 6.5 4.4 2.0 6.4 4.4 2.0 6.4
Glenstone and Chestnut 4.4 2.1 6.5 4.4 2.0 6.4 4.4 2.1 6.5 4.4
2.1 6.5 4.4 2.0 6.4 4.4 2.0 6.4
Glenstone and Kearney 4.9 0.5 5.4 4.9 2.0 6.9 4.9 2.1 7.0 4.9
2.1 7.0 4.9 2.0 6.9 4.9 2.0 6.9
Note: Yellow time for Campbell at Sunshine was adjusted to 4.7
seconds for all approaches on May 14, 2007 due to downgrades
greater than 2%.
Table A-1 - Candidate Intersections for Cameras
Westbound
Thru Thru Left Turn Left Turn Left Turn Left Turn
WestboundEastbound
(Note: City intersections in white, MoDOT intersections in
green)
Left Turn Left Turn
New Phase Change & Clearance Interval Timing - 3/19/2007
Left Turn Left TurnThru Thru
Old Phase Change & Clearance Interval Timing - 12/13/2006
North-South East-West Northbound Southbound Eastbound
SouthboundNorthboundEast-WestNorth-South