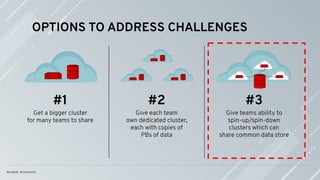
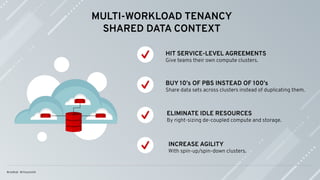
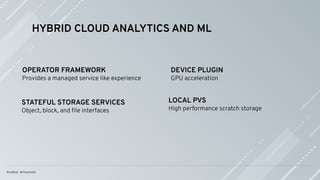
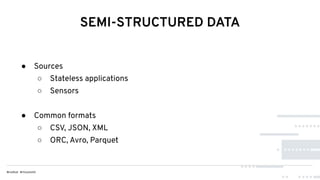
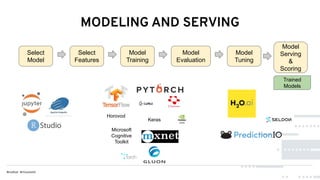
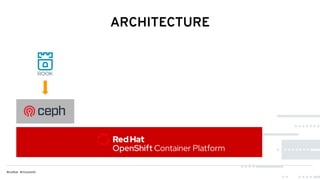
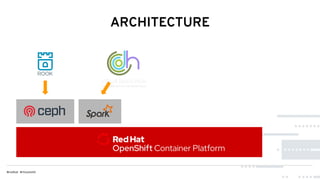
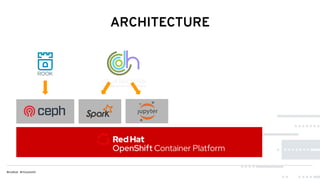
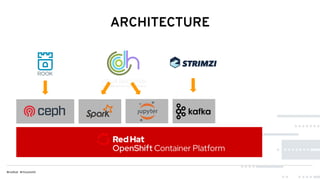
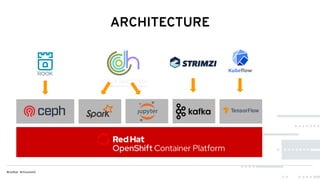
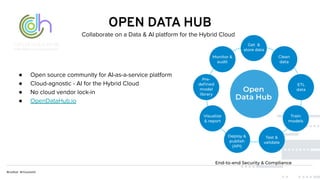
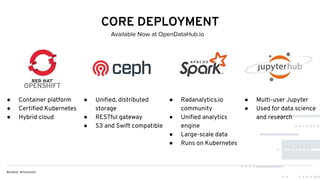
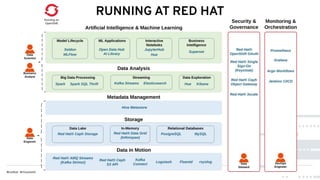
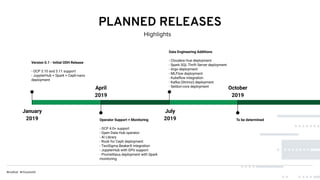
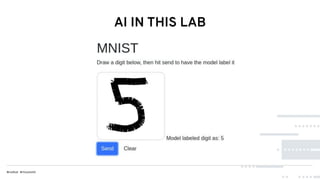
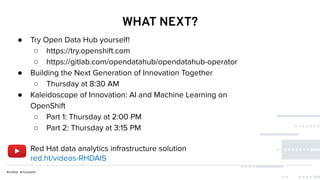
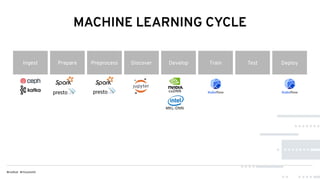
This document discusses Red Hat's Open Data Hub platform for multi-tenant data analytics and machine learning. It describes the challenges of sharing data and compute resources across teams and the Open Data Hub architecture which allows teams to spin up and down their own compute clusters while sharing a common data store. Key elements of the Open Data Hub include Spark, Ceph storage, JupyterHub notebooks, and TensorFlow/Keras for modeling. The document provides an overview of data structures, analytics workflows, and the components and roadmap for the Open Data Hub platform.
Microsoft and Revolution Analytics -- what's the add-value? 20150629Mark Tabladillo
Microsoft has been a leader in the enterprise analytics space for years. In 2014, Microsoft had already created R language functionality within Azure Machine Learning. On April 6, 2015, Microsoft and closed on a deal to acquire Revolution Analytics, a company focusing on scalable processing solutions initiated by the well-known R language. Many data science projects and initial demos do not need high-volume solutions: however, having a high-volume answer for the R language allows for planning or working toward the largest data science solutions.
This presentation describes the add-value for the Revolution Analytics acquisition. The talk covers 1) an overview of current data science technologies from Microsoft; 2) a description of the R language; 3) a brief review of the add-value for R with Azure Machine Learning, and 4) a description of the performance architecture and demo of the language constructs developed by Revolution Analytics. Most of the presentation will be focused on sections two and four. It is anticipated that these technologies will be partially if not fully integrated into SQL Server 2016.
Etosha - Data Asset Manager : Status and road mapDr. Mirko Kämpf
Etosha is an enterprise focused collaborative graph database with facts about data sets, analysis procedures, and research methods. People from multiple organizations can be connected while every owner retains full control about its own data.
Scaling and Unifying SciKit Learn and Apache Spark PipelinesDatabricks
Pipelines have become ubiquitous, as the need for stringing multiple functions to compose applications has gained adoption and popularity. Common pipeline abstractions such as “fit” and “transform” are even shared across divergent platforms such as Python Scikit-Learn and Apache Spark.
Scaling pipelines at the level of simple functions is desirable for many AI applications, however is not directly supported by Ray’s parallelism primitives. In this talk, Raghu will describe a pipeline abstraction that takes advantage of Ray’s compute model to efficiently scale arbitrarily complex pipeline workflows. He will demonstrate how this abstraction cleanly unifies pipeline workflows across multiple platforms such as Scikit-Learn and Spark, and achieves nearly optimal scale-out parallelism on pipelined computations.
Attendees will learn how pipelined workflows can be mapped to Ray’s compute model and how they can both unify and accelerate their pipelines with Ray.
Large Scale Geospatial Indexing and Analysis on Apache SparkDatabricks
SafeGraph is a data company — just a data company — that aims to be the source of truth for data on physical places. We are focused on creating high-precision geospatial data sets specifically about places where people spend time and money. We have business listings, building footprint data, and foot traffic insights for over 7 million across multiple countries and regions.
In this talk, we will inspect the challenges with geospatial processing, running at a large scale. We will look at open-source frameworks like Apache Sedona (incubating) and its key improvements over conventional technology, including spatial indexing and partitioning. We will explore spatial data structure, data format, and open-source indexing like H3. We will illustrate how all of these fit together in a cloud-first architecture running on Databricks, Delta, MLFlow, and AWS. We will explore examples of geospatial analysis with complex geometries and practical use cases of spatial queries. Lastly, we will discuss how this is augmented by Machine Learning modeling, Human-in-the-loop (HITL) annotation, and quality validation.
Neo4j-Databridge: Enterprise-scale ETL for Neo4jGraphAware
Neo4j - London User Group Meetup - 28th March, 2018
If your data ingestion requirements have grown beyond importing occasional CSV files then this talk is for you. Neo4j-Databridge from GraphAware is a comprehensive ETL tool specifically built for Neo4j. It has been designed for usability, expressive power and high performance to address the most common isues faced when importing data into Neo4j - multiple data sources and type, very large data sets, bespoke data conversions, non-tabular formats, filtering, merging and de-duplication, as well as bulk imports and incremental updates.
In this talk, we'll take a quick tour of the some of the main features, loading data from Kafka, Redis, JDBC and various other data sources along the way, to understand how Neo4j Databridge solves these problems and how it can help you import your data quickly and easily into Neo4j.
Vince Bickers is a Principal Consultant at GraphAware and the main author of Spring Data Neo4j (v4). He has been writing software and leading software development teams for over 30 years at organisations like Vodafone, Deutsche Bank, HSBC, Network Rail, UBS, VMWare, ConocoPhillips, Aviva and British Gas.
Observability for Data Pipelines With OpenLineageDatabricks
Data is increasingly becoming core to many products. Whether to provide recommendations for users, getting insights on how they use the product, or using machine learning to improve the experience. This creates a critical need for reliable data operations and understanding how data is flowing through our systems. Data pipelines must be auditable, reliable, and run on time. This proves particularly difficult in a constantly changing, fast-paced environment.
Collecting this lineage metadata as data pipelines are running provides an understanding of dependencies between many teams consuming and producing data and how constant changes impact them. It is the underlying foundation that enables the many use cases related to data operations. The OpenLineage project is an API standardizing this metadata across the ecosystem, reducing complexity and duplicate work in collecting lineage information. It enables many projects, consumers of lineage in the ecosystem whether they focus on operations, governance or security.
Marquez is an open source project part of the LF AI & Data foundation which instruments data pipelines to collect lineage and metadata and enable those use cases. It implements the OpenLineage API and provides context by making visible dependencies across organizations and technologies as they change over time.
When We Spark and When We Don’t: Developing Data and ML PipelinesStitch Fix Algorithms
The data platform at Stitch Fix runs thousands of jobs a day to feed data products that provide algorithmic capabilities to power nearly all aspects of the business, from merchandising to operations to styling recommendations. Many of these jobs are distributed across Spark clusters, while many others are scheduled as isolated single-node tasks in containers running Python, R, or Scala. Pipelines are often comprised of a mix of task types and containers.
This talk will cover thoughts and guidelines on how we develop, schedule, and maintain these pipelines at Stitch Fix. We’ll discuss guidelines on how we think about which portions of the pipelines we develop to run on what platforms (e.g. what is important to run distributed across Spark clusters vs run in stand-alone containers) and how we get them to play well together. We’ll also provide an overview of tools and abstractions that have been developed at Stitch Fix to facilitate the process from development, to deployment, to monitoring them in production.
Personalization allows Stitch Fix to style its clients and provide recommendations to help them find what they love. To do this, the company gathers information about a client’s preferences up front when they sign up from the service and learns more about them as they become longer-term customers. This information is important for making recommendations but also must be protected and managed with care.
The data science team at Stitch Fix is the primary owner of the recommendation systems. Backing them up is the data platform team, who maintain the data infrastructure, data warehouse, and supporting tools and services. This data warehouse has several different data sources that read and write into it. This includes a logging pipeline for events, every Spark-based ETL, and daily snapshots of structured data from Stitch Fix applications.
Neelesh Srinivas Salian explains Stitch Fix’s process to better understand the movement and evolution of data within its data warehouse, from the initial ingestion from outside sources through all of its ETLs. Neelesh also details how Stitch Fix built a service that helps the company understand the lineage information that is associated with each table in the data warehouse. This service helps the company understand the source, parentage, and journey of all data in the warehouse. Although Stitch Fix makes sure to anonymize and filter out sensitive information from this data, the company needs a more flexible long-term solution as the business expands.
Data Science Languages and Industry AnalyticsWes McKinney
September 19, 2015 talk at Berkeley Institute for Data Science. On how comparatively poor JSON / structured data tools pose a challenge for the data science languages (Python, R, Julia, etc.).
Transitioning from Traditional DW to Apache® Spark™ in Operating Room Predict...Databricks
The prevailing issue when working with Operating Room (OR) scheduling within a hospital setting is that it is difficult to schedule and predict available OR block times. This leads to empty and unused operating rooms leading to longer waiting times for patients for their procedures. In this three-part session, Ayad Shammout and Denny will show:
1) How we tried to solve this problem using traditional DW techniques
2) How we took advantage of the DW capabilities in Apache Spark AND easily transition to Spark MLlib so we could more easily predict available OR block times resulting in better OR utilization and shorter wait times for patients.
3) Some of the key learnings we had when migrating from DW to Spark.
Graph Features in Spark 3.0: Integrating Graph Querying and Algorithms in Spa...Databricks
Spark 3.0 introduces a new module: Spark Graph. Spark Graph adds the popular query language Cypher, its accompanying Property Graph Model and Graph Algorithms to the data science toolbox. Graphs have a plethora of useful applications in recommendation, fraud detection and research. The tutorial aims to help understanding when graphs should be used and how Spark Graph can be used to extend analytical workflows. In this tutorial we will explore the concepts and motivations behind graph querying and graph algorithms, the components of the new Spark Graph module and their APIs, and how those APIs allow you to successfully write your own graph applications and integrate them in your data science workflows.
The tutorial is a mixture of presentation, code examples, and notebooks. We will demonstrate how to write an end-to-end Graph application that operates on different kinds of input data. We will show how Spark Graph interacts with Spark SQL and openCypher Morpheus, a Spark Graph extension that allows you to easily manage multiple graphs and provides built-in Property Graph Data Sources for the Neo4j graph database as well as Cypher language extensions.
At the end of the tutorial, attendees will have a good understanding of when to apply graphs in their data science workflows, how to bring Spark Graph into an existing Spark workflow and how to make best use of the new APIs. This tutorial will be both lead by the presenters and also hands-on interactive session. The tutorial material will be made available during the presentation.
Societal Challenge 6: Social Sciences - Spending ComparisonBigData_Europe
Jürgen Jakobitsch describes the BDE project pilot for Societal Challenge 6 (Social Sciences). The platform is being used to ingest, analyse and visualise spending data from multiple sources.
CuRious about R in Power BI? End to end R in Power BI for beginners Jen Stirrup
In this session, we will start R right from the beginning, from installing R through to datatransformation and integration, through to visualizing data by using R in PowerBI. Then, we will move towards powerful but simple to use datatypes in R such as data frames. We will also upgrade our data analysis skills by looking at Rdata transformation using a powerful set of tools to make things simple: the tidyverse. Then, we will look at integrating our R work into Power BI, and visualizing our data using beautiful visualizations with R and Power BI. Finally, we will share our work by publishing our Power BI project, with our R code, to the Power BI service. We will also look at refreshing our dataset so that our new dashboard has refreshed data.
This session is aimed at getting beginners up to speed as gently and quickly as possible. Join this session if you are curious about R and want to know more. If you are already a Power BI expert, join this session to open up a whole new world of Power BI to add toyour skill set. If you are new to Power BI, you will still get value from this session since you'll be able to see a Power BI dashboard being built in an end-to-end solution.
Evaluation of TPC-H on Spark and Spark SQL in ALOJADataWorks Summit
The Evaluation of TPC-H on Spark and Spark SQL in ALOJA was conducted at the Big Data Lab to obtain the master degree in Management Information Systems at the Johann-Wolfgang Goethe University in Frankfurt, Germany. Furthermore, the analysis was partially accomplished in collaboration and close coordination with the Barcelona Super Computer Center.
The intention of this research was the integration of a TPC-H on Spark Scala benchmark into ALOJA, an open-source and public platform for automated and cost-efficient benchmarks and to perform an evaluation on the runtime of Spark Scala with or without Hive Metastore compared to Spark SQL. Various alternate file formats with different applied compressions on underlying data and its impact are evaluated. The conducted performance evaluation exposed diverse and captivating outcomes for both benchmarks. Further investigations attempt to detect possible bottlenecks and other irregularities. The aim is to provide an explanation to enhance knowledge of Spark’s engine based on examining the physical plans. Our experiments show, inter alia, that: (1) Spark Scala performs better in case of heavy expression calculation, (2) Spark SQL is the better choice in case of strong data access locality in combination with heavyweight parallel execution. In conclusion, diverse results were observed with the consequence that each API has its advantages and disadvantages.
Surprisingly, our findings are well spread between Spark SQL and Spark Scala and contrary to our expectations Spark Scala did not outperform Spark SQL in all aspects but support the idea that applied optimizations appear to be implemented in a different way by Spark for its core and its extension Spark SQL. The API on top of Spark provides extra information about the underlying structured data, which is probably used to perform additional optimizations.
In conclusion, our research demonstrates that there are differences in the generation of query execution plans that goes hand-in-hand with similar discoveries leading to inefficient joins, and it underlines the importance of our benchmark to identify disparities and bottlenecks.
Speaker
Raphael Radowitz, Quality Specialist, SAP Labs Korea
This presentation is an attempt do demystify the practice of building reliable data processing pipelines. We go through the necessary pieces needed to build a stable processing platform: data ingestion, processing engines, workflow management, schemas, and pipeline development processes. The presentation also includes component choice considerations and recommendations, as well as best practices and pitfalls to avoid, most learnt through expensive mistakes.
Architecting an Open Source AI Platform 2018 editionDavid Talby
How to build a scalable AI platform using open source software. The end-to-end architecture covers data integration, interactive queries & visualization, machine learning & deep learning, deploying models to production, and a full 24x7 operations toolset in a high-compliance environment.
At Data-centric Architecture Forum 2020 Thomas Cook, our Sales Director of AnzoGraph DB, gave his presentation "Knowledge Graph for Machine Learning and Data Science". These are his slides.
Developing Enterprise Consciousness: Building Modern Open Data PlatformsScyllaDB
ScyllaDB, along side some of the other major distributed real-time technologies gives businesses a unique opportunity to achieve enterprise consciousness - a business platform that delivers data to the people that need when they need it any time, anywhere.
This talk covers how modern tools in the open data platform can help companies synchronize data across their applications using open source tools and technologies and more modern low-code ETL/ReverseETL tools.
Topics:
- Business Platform Challenges
- What Enterprise Consciousness Solves
- How ScyllaDB Empowers Enterprise Consciousness
- What can ScyllaDB do for Big Companies
- What can ScyllaDB do for smaller companies.
Session 8 - Creating Data Processing Services | Train the Trainers ProgramFIWARE
This technical session for Local Experts in Data Sharing (LEBDs), this session will explain how to create data processing services that are key to i4Trust.
AnzoGraph DB: Driving AI and Machine Insights with Knowledge Graphs in a Conn...Cambridge Semantics
Thomas Cook, director of sales, Cambridge Semantics, offers a primer on graph database technology and the rapid growth of knowledge graphs at Data Summit 2020 in his presentation titled "AnzoGraph DB: Driving AI and Machine Insights with Knowledge Graphs in a Connected World".
This presentation focuses on the value proposition for Azure Databricks for Data Science. First, the talk includes an overview of the merits of Azure Databricks and Spark. Second, the talk includes demos of data science on Azure Databricks. Finally, the presentation includes some ideas for data science production.
ODSC East 2020 Accelerate ML Lifecycle with Kubernetes and Containerized Da...Abhinav Joshi
This deck provide an overview of containers and Kubernetes, and how these technologies can help solve the challenges faced by data scientists, ML engineers, and application developers. Next, it showcases the key capabilities required in a containers and kubernetes platform to help data scientists easily use technologies like Jupyter Notebooks, ML frameworks, programming languages to innovate faster. Finally it discusses the available platform options (e.g. KubeFlow, Open Data Hub, etc.), and some examples of how data scientists are accelerating their ML initiatives with containers and kubernetes platform.
Using Cloud Automation Technologies to Deliver an Enterprise Data FabricCambridge Semantics
The world of database management is changing. Cloud adoption is accelerating, offering a path for companies to increase their database capabilities while keeping costs in line. To help IT decision-makers survive and thrive in the cloud era, DBTA hosted this special roundtable webinar.
Day 13 - Creating Data Processing Services | Train the Trainers ProgramFIWARE
This technical session for Local Experts in Data Sharing (LEBDs), this session will explain how to create data processing services that are key to i4Trust.
Building a Next-gen Data Platform and Leveraging the OSS Ecosystem for Easy W...StampedeCon
This session will be a detailed recount of the design, implementation, and launch of the next-generation Shutterstock Data Platform, with strong emphasis on conveying clear, understandable learnings that can be transferred to your own organizations and projects. This platform was architected around the prevailing use of Kafka as a highly-scalable central data hub for shipping data across your organization in batch or streaming fashion. It also relies heavily on Avro as a serialization format and a global schema registry to provide structure that greatly improves quality and usability of our data sets, while also allowing the flexibility to evolve schemas and maintain backwards compatibility.
As a company, Shutterstock has always focused heavily on leveraging open source technologies in developing its products and infrastructure, and open source has been a driving force in big data more so than almost any other software sub-sector. With this plethora of constantly evolving data technologies, it can be a daunting task to select the right tool for your problem. We will discuss our approach for choosing specific existing technologies and when we made decisions to invest time in home-grown components and solutions.
We will cover advantages and the engineering process of developing language-agnostic APIs for publishing to and consuming from the data platform. These APIs can power some very interesting streaming analytics solutions that are easily accessible to teams across our engineering organization.
We will also discuss some of the massive advantages a global schema for your data provides for downstream ETL and data analytics. ETL into Hadoop and creation and maintenance of Hive databases and tables becomes much more reliable and easily automated with historically compatible schemas. To complement this schema-based approach, we will cover results of performance testing various file formats and compression schemes in Hadoop and Hive, the massive performance benefits you can gain in analytical workloads by leveraging highly optimized columnar file formats such as ORC and Parquet, and how you can use good old fashioned Hive as a tool for easily and efficiently converting exiting datasets into these formats.
Finally, we will cover lessons learned in launching this platform across our organization, future improvements and further design, and the need for data engineers to understand and speak the languages of data scientists and web, infrastructure, and network engineers.
Graph Analytics on Data from Meetup.comKarin Patenge
How to improve your Meetup experience by using Graph Analytics on data from Meetup.com. Slides from my session with "Women Who Code" group in Berlin on May 23, 2018.
Data Engineer's Lunch #81: Reverse ETL Tools for Modern Data PlatformsAnant Corporation
During this lunch, we’ll review open-source reverse ETL tools to uncover how to send data back to SaaS systems.
Sign Up For Our Newsletter: http://eepurl.com/grdMkn
Join Data Engineer’s Lunch Weekly at 12 PM EST Every Monday:
https://www.meetup.com/Data-Wranglers-DC/events/
Cassandra.Link:
https://cassandra.link/
Follow Us and Reach Us At:
Anant:
https://www.anant.us/
Awesome Cassandra:
https://github.com/Anant/awesome-cassandra
Email:
solutions@anant.us
LinkedIn:
https://www.linkedin.com/company/anant/
Twitter:
https://twitter.com/anantcorp
Eventbrite:
https://www.eventbrite.com/o/anant-1072927283
Facebook:
https://www.facebook.com/AnantCorp/
Join The Anant Team:
https://www.careers.anant.us
#data #dataengineering #datagovernance
Similar to Red hat infrastructure for analytics (20)
Epistemic Interaction - tuning interfaces to provide information for AI supportAlan Dix
Paper presented at SYNERGY workshop at AVI 2024, Genoa, Italy. 3rd June 2024
https://alandix.com/academic/papers/synergy2024-epistemic/
As machine learning integrates deeper into human-computer interactions, the concept of epistemic interaction emerges, aiming to refine these interactions to enhance system adaptability. This approach encourages minor, intentional adjustments in user behaviour to enrich the data available for system learning. This paper introduces epistemic interaction within the context of human-system communication, illustrating how deliberate interaction design can improve system understanding and adaptation. Through concrete examples, we demonstrate the potential of epistemic interaction to significantly advance human-computer interaction by leveraging intuitive human communication strategies to inform system design and functionality, offering a novel pathway for enriching user-system engagements.
Slack (or Teams) Automation for Bonterra Impact Management (fka Social Soluti...Jeffrey Haguewood
Sidekick Solutions uses Bonterra Impact Management (fka Social Solutions Apricot) and automation solutions to integrate data for business workflows.
We believe integration and automation are essential to user experience and the promise of efficient work through technology. Automation is the critical ingredient to realizing that full vision. We develop integration products and services for Bonterra Case Management software to support the deployment of automations for a variety of use cases.
This video focuses on the notifications, alerts, and approval requests using Slack for Bonterra Impact Management. The solutions covered in this webinar can also be deployed for Microsoft Teams.
Interested in deploying notification automations for Bonterra Impact Management? Contact us at sales@sidekicksolutionsllc.com to discuss next steps.
JMeter webinar - integration with InfluxDB and GrafanaRTTS
Watch this recorded webinar about real-time monitoring of application performance. See how to integrate Apache JMeter, the open-source leader in performance testing, with InfluxDB, the open-source time-series database, and Grafana, the open-source analytics and visualization application.
In this webinar, we will review the benefits of leveraging InfluxDB and Grafana when executing load tests and demonstrate how these tools are used to visualize performance metrics.
Length: 30 minutes
Session Overview
-------------------------------------------
During this webinar, we will cover the following topics while demonstrating the integrations of JMeter, InfluxDB and Grafana:
- What out-of-the-box solutions are available for real-time monitoring JMeter tests?
- What are the benefits of integrating InfluxDB and Grafana into the load testing stack?
- Which features are provided by Grafana?
- Demonstration of InfluxDB and Grafana using a practice web application
To view the webinar recording, go to:
https://www.rttsweb.com/jmeter-integration-webinar
Kubernetes & AI - Beauty and the Beast !?! @KCD Istanbul 2024Tobias Schneck
As AI technology is pushing into IT I was wondering myself, as an “infrastructure container kubernetes guy”, how get this fancy AI technology get managed from an infrastructure operational view? Is it possible to apply our lovely cloud native principals as well? What benefit’s both technologies could bring to each other?
Let me take this questions and provide you a short journey through existing deployment models and use cases for AI software. On practical examples, we discuss what cloud/on-premise strategy we may need for applying it to our own infrastructure to get it to work from an enterprise perspective. I want to give an overview about infrastructure requirements and technologies, what could be beneficial or limiting your AI use cases in an enterprise environment. An interactive Demo will give you some insides, what approaches I got already working for real.
Software Delivery At the Speed of AI: Inflectra Invests In AI-Powered QualityInflectra
In this insightful webinar, Inflectra explores how artificial intelligence (AI) is transforming software development and testing. Discover how AI-powered tools are revolutionizing every stage of the software development lifecycle (SDLC), from design and prototyping to testing, deployment, and monitoring.
Learn about:
• The Future of Testing: How AI is shifting testing towards verification, analysis, and higher-level skills, while reducing repetitive tasks.
• Test Automation: How AI-powered test case generation, optimization, and self-healing tests are making testing more efficient and effective.
• Visual Testing: Explore the emerging capabilities of AI in visual testing and how it's set to revolutionize UI verification.
• Inflectra's AI Solutions: See demonstrations of Inflectra's cutting-edge AI tools like the ChatGPT plugin and Azure Open AI platform, designed to streamline your testing process.
Whether you're a developer, tester, or QA professional, this webinar will give you valuable insights into how AI is shaping the future of software delivery.
UiPath Test Automation using UiPath Test Suite series, part 4DianaGray10
Welcome to UiPath Test Automation using UiPath Test Suite series part 4. In this session, we will cover Test Manager overview along with SAP heatmap.
The UiPath Test Manager overview with SAP heatmap webinar offers a concise yet comprehensive exploration of the role of a Test Manager within SAP environments, coupled with the utilization of heatmaps for effective testing strategies.
Participants will gain insights into the responsibilities, challenges, and best practices associated with test management in SAP projects. Additionally, the webinar delves into the significance of heatmaps as a visual aid for identifying testing priorities, areas of risk, and resource allocation within SAP landscapes. Through this session, attendees can expect to enhance their understanding of test management principles while learning practical approaches to optimize testing processes in SAP environments using heatmap visualization techniques
What will you get from this session?
1. Insights into SAP testing best practices
2. Heatmap utilization for testing
3. Optimization of testing processes
4. Demo
Topics covered:
Execution from the test manager
Orchestrator execution result
Defect reporting
SAP heatmap example with demo
Speaker:
Deepak Rai, Automation Practice Lead, Boundaryless Group and UiPath MVP
Elevating Tactical DDD Patterns Through Object CalisthenicsDorra BARTAGUIZ
After immersing yourself in the blue book and its red counterpart, attending DDD-focused conferences, and applying tactical patterns, you're left with a crucial question: How do I ensure my design is effective? Tactical patterns within Domain-Driven Design (DDD) serve as guiding principles for creating clear and manageable domain models. However, achieving success with these patterns requires additional guidance. Interestingly, we've observed that a set of constraints initially designed for training purposes remarkably aligns with effective pattern implementation, offering a more ‘mechanical’ approach. Let's explore together how Object Calisthenics can elevate the design of your tactical DDD patterns, offering concrete help for those venturing into DDD for the first time!
The Art of the Pitch: WordPress Relationships and SalesLaura Byrne
Clients don’t know what they don’t know. What web solutions are right for them? How does WordPress come into the picture? How do you make sure you understand scope and timeline? What do you do if sometime changes?
All these questions and more will be explored as we talk about matching clients’ needs with what your agency offers without pulling teeth or pulling your hair out. Practical tips, and strategies for successful relationship building that leads to closing the deal.
Encryption in Microsoft 365 - ExpertsLive Netherlands 2024Albert Hoitingh
In this session I delve into the encryption technology used in Microsoft 365 and Microsoft Purview. Including the concepts of Customer Key and Double Key Encryption.
Builder.ai Founder Sachin Dev Duggal's Strategic Approach to Create an Innova...Ramesh Iyer
In today's fast-changing business world, Companies that adapt and embrace new ideas often need help to keep up with the competition. However, fostering a culture of innovation takes much work. It takes vision, leadership and willingness to take risks in the right proportion. Sachin Dev Duggal, co-founder of Builder.ai, has perfected the art of this balance, creating a company culture where creativity and growth are nurtured at each stage.
1. Analytics and Machine Learning with
Red Hat Infrastructure
Kyle Bader, Senior Architect
Sean Pryor, AI Developer
Sherard Griffin, Senior Manager, Open Data Hub
BOSTON, 2019
2. ● PROBLEM STATEMENT
○ Multi-tenant data analytics and machine learning
○ Shared data context
○ Sensitive data can’t leave the country, data governance restrictions
● DATA STRUCTURES
○ Shared data context with Ceph
○ Preparing your data
■ Structured data with Hive Metastore*
■ Semi-structured data
■ Data processing jobs
■ Spark
○ AI/ML
■ Features/Labels/other important terms
■ Background on AI and how it works
■ TensorFlow
● DATA PLATFORM ARCHITECTURE
○ Open Data Hub (Spark, Ceph, JupyterHub, TensorFlow)
○ Follow-up slides for them to learn more
■ ISVs
■ ODH
■ Frameworks
■ Other talks, etc.
4. ANALYTICS AND ML CHALLENGES
EXPLOSIVE GROWTH
in analytics teams and analytic tools
MULTIPLE TEAMS COMPETING
for use of the same big data resources
CONGESTION
in busy analytic clusters causing frustration
and missed SLAs
HADOOP
SPARK
HIVE
PRESTO
IMPALA
KAFKA
NIFI
TENSORFLOW
PYTORCH
5. OPTIONS TO ADDRESS CHALLENGES
Get a bigger cluster
for many teams to share
Give each team
own dedicated cluster,
each with copies of
PBs of data
#1 #2
Give teams ability to
spin-up/spin-down
clusters which can
share common data store
#3
6. MULTI-WORKLOAD TENANCY
SHARED DATA CONTEXT
HIT SERVICE-LEVEL AGREEMENTS
Give teams their own compute clusters.
ELIMINATE IDLE RESOURCES
By right-sizing de-coupled compute and storage.
BUY 10’s OF PBS INSTEAD OF 100’s
Share data sets across clusters instead of duplicating them.
INCREASE AGILITY
With spin-up/spin-down clusters.
7. HYBRID CLOUD ANALYTICS AND ML
OPERATOR FRAMEWORK
Provides a managed service like experience
STATEFUL STORAGE SERVICES
Object, block, and file interfaces
DEVICE PLUGIN
GPU acceleration
LOCAL PVS
High performance scratch storage
20. OPEN DATA HUB
Collaborate on a Data & AI platform for the Hybrid Cloud
● Open source community for AI-as-a-service platform
● Cloud-agnostic - AI for the Hybrid Cloud
● No cloud vendor lock-in
● OpenDataHub.io
21. Sentiment analysis and entity detection
on customer engagements, support
tickets, marketing surveys and more.
Trained on the specific Red Hat product
terminology.
AWS Microsoft AzureOpenStackDatacenterLaptop
CONTAINERIZER APPS
AT RED HAT’S CORE PROCESSES
Internal Use Cases
22. AWS Microsoft AzureOpenStackDatacenterLaptop
CONTAINERIZER APPS
AT RED HAT’S CORE PROCESSES
Internal Use Cases
Improve Red Hat’s core Engineering and
Operations processes by applying
analytics, machine learning, and AI.
AWS Microsoft AzureOpenStackDatacenterLaptop
CONTAINERIZER APPS
- rules
- heuristics
- ML
23. CORE DEPLOYMENT
● Container platform
● Certified Kubernetes
● Hybrid cloud
● Unified, distributed
storage
● RESTful gateway
● S3 and Swift compatible
● Radanalytics.io
community
● Unified analytics
engine
● Large-scale data
● Runs on Kubernetes
● Multi-user Jupyter
● Used for data science
and research
Available Now at OpenDataHub.io
24. Add-Ons
● Part of Open Data Hub
● Set of deployed
pre-defined AI models
available to use
● Monitoring and alerting
toolkit
● Records numeric time
series data
● Used to diagnose
problems
● Analytics platform for
all metrics
● Query, visualize and
alert on metrics
● Deploying machine
learning models on
Kubernetes
● Expose models via
REST and gRPC
● Full model lifecycle
management
Available Now at OpenDataHub.io
Open Data Hub
AI Library
26. PLANNED RELEASES
Highlights
July
2019
Data Engineering Additions
- Cloudera Hue deployment
- Spark SQL Thrift Server deployment
- Argo deployment
- MLFlow deployment
- Kubeflow integration
- Kafka (Strimzi) deployment
- Seldon-core deployment
October
2019
To be determined
January
2019
Version 0.1 - Initial ODH Release
- OCP 3.10 and 3.11 support
- JupyterHub + Spark + Ceph-nano
deployment
April
2019
Operator Support + Monitoring
- OCP 4.0+ support
- Open Data Hub operator
- AI Library
- Rook for Ceph deployment
- TwoSigma BeakerX integration
- JupyterHub with GPU support
- Prometheus deployment with Spark
monitoring
29. WHAT NEXT?
● Try Open Data Hub yourself!
○ https://try.openshift.com
○ https://gitlab.com/opendatahub/opendatahub-operator
● Building the Next Generation of Innovation Together
○ Thursday at 8:30 AM
● Kaleidoscope of Innovation: AI and Machine Learning on
OpenShift
○ Part 1: Thursday at 2:00 PM
○ Part 2: Thursday at 3:15 PM
Red Hat data analytics infrastructure solution
red.ht/videos-RHDAIS