Characterizing MoS2-Si Heterojunction Using Terahertz Emission Spectroscopy
•
1 like•229 views

Recommended

Recommended
More Related Content
What's hot
What's hot (19)
Viewers also liked
Viewers also liked (20)
Similar to Characterizing MoS2-Si Heterojunction Using Terahertz Emission Spectroscopy
Similar to Characterizing MoS2-Si Heterojunction Using Terahertz Emission Spectroscopy (20)
Characterizing MoS2-Si Heterojunction Using Terahertz Emission Spectroscopy
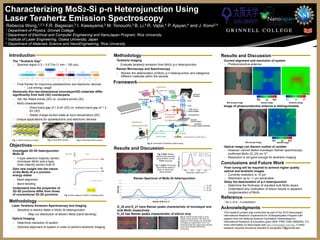
- 1. Characterizing MoS2-Si p-n Heterojunction Using Laser Terahertz Emission Spectroscopy Rebecca Wong,1,2,3 F.R. Bagsican,3 I. Kawayama,3 M. Tonouchi,3 B. Li,4 R. Vajtai,4 P. Ajayan,4 and J. Kono2,4 1 Department of Physics, Grinnell College 2 Department of Electrical and Computer Engineering and NanoJapan Program, Rice University 3 Institute of Laser Engineering, Osaka University, Japan 4 Department of Materials Science and NanoEngineering, Rice University Introduction Results and Discussion Acknowledgments Results and Discussion This research project was conducted as part of the 2015 NanoJapan: International Research Experience for Undergraduates Program with support from a National Science Foundation Partnerships for International Research & Education grant (NSF-PIRE OISE-0968405). For more information on NanoJapan see http://nanojapan.rice.edu. Further inquiries can be directed to wongrebe17@grinnell.edu Conclusions and Future Work Atomically thin two-dimensional (monolayer/2D) materials differ significantly from bulk (3D) counterparts o Van der Waals bonds (2D) vs. covalent bonds (3D) o MoS2 characteristics • Direct band gap of 1.8 eV (2D) vs. indirect band gap of 1.3 eV (3D) • Stable charge exciton state at room temperature (2D) o Unique applications for optoelectronic and electronic devices References Fig. 1: Atomic structure of MoS2 Fig. 2: Bulk MoS2 Sample Fig. 3: Monolayer MoS2 Sample Objectives Investigate 2D-3D heterojunction MoS2-Si o n-type (electron majority carrier) monolayer MoS2 and p-type (hole majority carrier) bulk Si Gain new insight into the nature of the MoS2-Si p-n junction energy states o Band alignment o Band bending Understand how the properties of 2D-3D junctions differ from those of conventional 3D-3D junctions Fig. 4: Band diagram of MoS2-Si heterojunction.1 Terahertz Emission Spectroscopy and Imaging o Sensitive to electric fields in MoS2-Si heterojunction • Map out distribution of electric fields (band bending) Optical Imaging o Confirm reflective imaging capabilities Methodology Framework Fig. 5: Schematic of terahertz system setup. 1 Bo Li et al., in preparation Fig. 7 (left): Sample areas of MoS2-Si with PMMA removed. Fig. 8 (right): Previously found Raman peaks of MoS2 on silicon and silicon dioxide. 1 0 100 200 300 400 500 600 375 380 385 390 395 400 405 410 415 420 Intensity Raman Shift (cm-1) Raman Spectrum of MoS2-Si Heterojunction D_20 D_21 D_22 Finer tuning will be required to achieve higher quality optical images and terahertz images o Currently resolution up to 5 µm o Resolution up to 1 µm achievable Delay the deterioration of p-n junction o Determine the thickness of resultant bulk MoS2 layers o Understand why oxidization of silicon results in conglomeration of MoS2 Acknowledgments Results and Discussion This research project was conducted as part of the 2015 NanoJapan: International Research Experience for Undergraduates Program with support from the National Science Foundation Partnerships for International Research & Education grant (NSF-PIRE OISE-0968405). For more information on NanoJapan see http://nanojapan.rice.edu. Further research inquiries should be directed to wongrebe17@grinnell.edu Reference Objectives Investigate 2D-3D heterojunction MoS2-Si o n-type (electron majority carrier) monolayer MoS2 and p-type (hole majority carrier) bulk Si Gain new insight into the nature of the MoS2-Si p-n junction energy states o Band alignment o Band bending Understand how the properties of 2D-3D junctions differ from those of conventional 3D-3D junctions Fig. 4: Band diagram of MoS2-Si heterojunction1 Terahertz Imaging o Evaluate terahertz emission from MoS2 p-n heterojunction Raman Microscopy and Spectroscopy o Monitor the deterioration of MoS2 p-n heterojunction and categorize different materials within the sample Methodology Framework Fig. 5: Schematic of terahertz system setup 1 Bo Li et al., in preparation Current alignment and resolution of system o Photoconductive antenna Finer tuning will be required to achieve higher quality optical and terahertz images o Currently resolution is ~5 µm o Resolution up to ~1 µm achievable Delay the deterioration of p-n heterojunction o Determine the thickness of resultant bulk MoS2 layers o Understand why oxidization of silicon results in apparent conglomeration of MoS2 Fig. 8: Furthermost left image is of the sample freshly prepared. The other two images are of the sample one month later. All images are magnification X100. The furthermost right two images were acquired using Horiba XploRA ONE Raman microscope. Introduction Atomically thin two-dimensional (monolayer/2D) materials differ significantly from bulk (3D) counterparts o Van der Waals bonds (2D) vs. covalent bonds (3D) o MoS2 characteristics • Direct band gap of 1.8 eV (2D) vs. indirect band gap of 1.3 eV (3D) • Stable charge exciton state at room temperature (2D) o Unique applications for optoelectronic and electronic devices Fig. 1: Atomic structure of MoS2 Fig. 2: Bulk MoS2 sample Fig. 3: Monolayer MoS2 sample o Final frontier for improving optoelectronic and electronic devices • Low energy usage The “Terahertz Gap” o Spectral region 0.3 – 3.0 THz (1 mm - 100 µm) Laser Terahertz Emission Spectroscopy and Imaging o Sensitive to electric fields in MoS2-Si heterojunction • Map out distribution of electric fields (band bending) Optical Imaging o Determine resolution of system o Optimize alignment of system in order to perform terahertz imaging Methodology Results and Discussion Fig. 6 (left): Raman spectroscopy sampling areas of MoS2-Si with PMMA removed Fig. 7 (right): Previously found Raman peaks of MoS2 on silicon and silicon dioxide1 D_20 and D_21 have Raman peaks characteristic of monolayer and bulk MoS2 respectively D_22 has Raman peaks characteristic of silicon only Image of photoconductive antenna is distinguishable Optical ImageMicroscope Image Optical image can discern outline of number o However, cannot detect monolayer Raman spectroscopy- confirmed MoS2 (D_20) on “9” o Resolution is not good enough for terahertz imaging Microscope Image Terahertz ImageOptical Image 0 100 200 300 400 500 600 375 380 385 390 395 400 405 410 415 420 Intensity Raman Shift (cm-1) Raman Spectrum of MoS2-Si Heterojunction Conclusions and Future Work D_20 D_21 D_22 o 20 µm