Download as PDF, PPTX
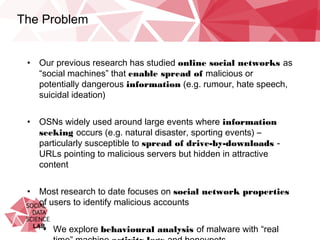
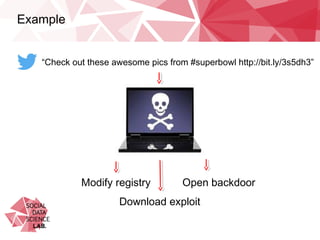
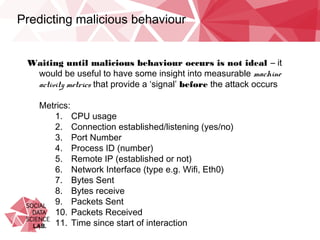
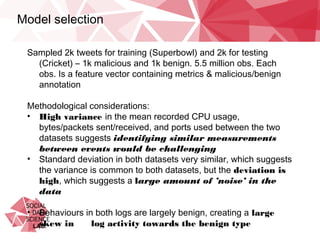
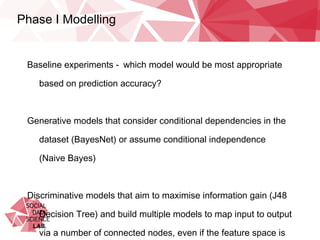
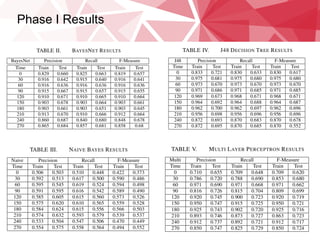
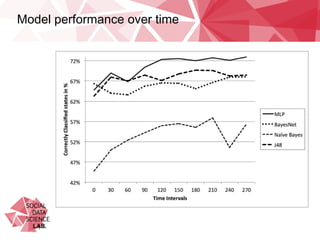
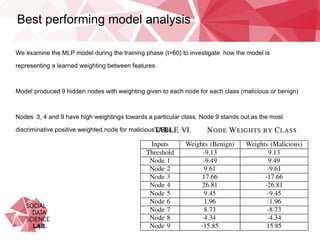
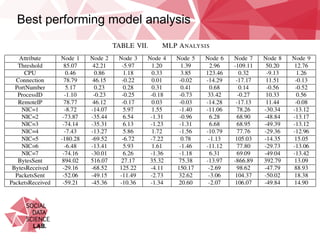
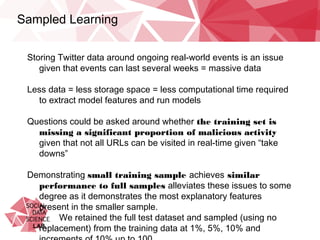
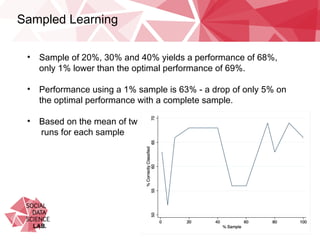
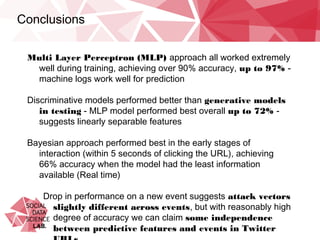
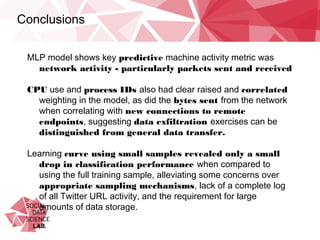


This document summarizes research on classifying malicious URLs on Twitter in real-time using machine activity data. The researchers collected data on URLs shared on Twitter during sporting events and used a honeypot to identify malicious ones. They built machine learning models to predict maliciousness based on metrics like CPU usage, network traffic, and processes when a URL was clicked. The best model was a multi-layer perceptron that achieved up to 72% accuracy. It showed network activity, CPU usage, and processes were predictive. Testing on a new dataset showed some independence between events. Using only 1% of training data caused a small 5% drop in performance, alleviating concerns over data requirements.


![How Big Brands are Taking Your Traffic in Alberta [Data Inside].pptx](https://cdn.slidesharecdn.com/ss_thumbnails/howbigbrandsaretakingyourtrafficinalbertadatainside-260123180142-42d276f3-thumbnail.jpg?width=640&height=640&fit=bounds)


