Download to read offline


![33
The Evolution of Ownership Structure...
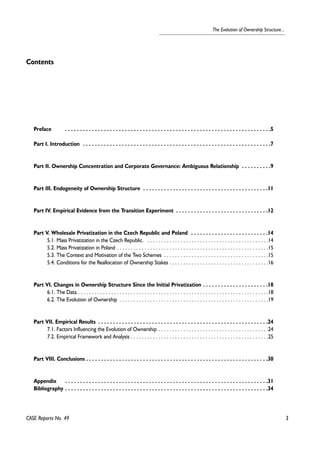
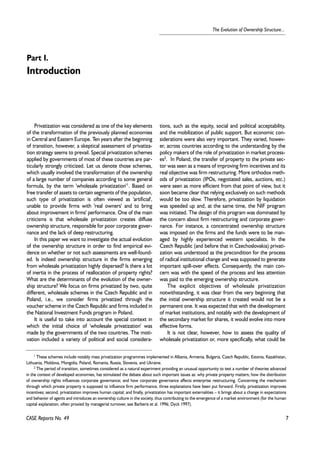
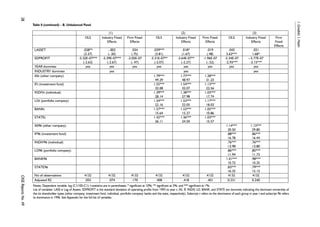
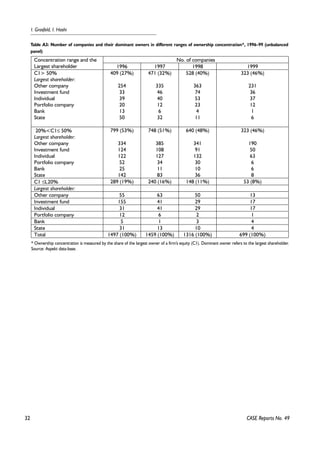
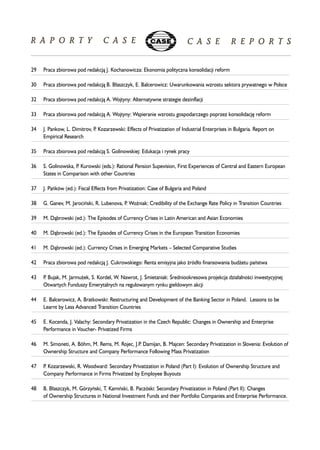
Table A4: List of variables
Variable Description
C1 The share of largest single shareholder of a company’s equity (%)
LC1 Logistic transformation of C1 (i.e., Ln[C1/(100-C1)]
LASSET Natural logarithm of assets (in constant 1994 prices)
SDPROFIT Standard deviation of annual ‘operating profit’ of each company (in constant 1994 prices)
CASE Reports No. 49
measured between 1993 and year t
DOMOWNt Six dummies indicating the dominant shareholder in year t. They are:
ASt 1 if ‘other company’ is the dominant shareholder of a firm in year t, 0 otherwise
IFt 1 if ‘investment fund’ is the dominant shareholder of a firm in year t, 0 otherwise
INDIVt 1 if ‘individual’ is the dominant shareholder of a firm in year t, 0 otherwise
LOt 1 if ‘portfolio company’ is the dominant shareholder of a firm in year t, 0 otherwise
BANKt 1 if ‘banks’ is the dominant shareholder of a firm in year t, 0 otherwise
STATEt 1 if ‘the state’ is the dominant shareholder of a firm in year t, 0 otherwise
DOMOWN96 Six dummies indicating the dominant shareholder in 1996. They are:
AS96 1 if ‘other company’ is the dominant shareholder of a firm in 1996, 0 otherwise
IF96 1 if ‘investment fund’ is the dominant shareholder of a firm in 1996, 0 otherwise
INDIV96 1 if ‘individual’ is the dominant shareholder of a firm in 1996, 0 otherwise
LOt 1 if ‘portfolio company’ is the dominant shareholder of a firm in 1996, 0 otherwise
BANK96 1 if ‘banks’ is the dominant shareholder of a firm in 1996, 0 otherwise
STATE96 1 if ‘the state’ is the dominant shareholder of a firm in 1996, 0 otherwise
INDUSTRY 19 dummies indicating the industry to which the firm belongs (industries are classified
according to the system used by Prague Stock Exchange)
YEAR 3 Dummies, indicating years of data
ProbDOMOWN99 Probability of a particular shareholder type being dominant in 1999 (dependent variable in
Probit models)
SDSALES Standard deviation of annual sales (in 1994 prices) of each company from 1993 to year t
CAPINTENS Capital intensity measured by the ratio of assets to sales (both in 1994 prices)
ALLDOMOWN96 A set of variables showing the total percentage shareholding of each of the main
shareholder types in 1996. They are:
ALLAS96 The total shareholding of all ‘other companies’ in each firm in 1996 (%)
ALLIF96 The total shareholding of all ‘investment funds’ in a firm in 1996 (%)
ALLINDIV96 The total shareholding of all ‘individuals’ in a firm in 1996 (%)
ALLLO96 The total shareholding of all ‘portfolio companies’ in a firm in 1996 (%)
ALLBANKS96 The total shareholding of all ‘banks’ in a firm in 1996 (%)
ALLSTATE96 The total shareholding of ‘the state’ in a firm in 1996 (%)](https://image.slidesharecdn.com/rc49-141023041331-conversion-gate02/85/CASE-Network-Report-49-The-Evolution-of-Ownership-Structure-in-Firms-Privatized-through-Wholesale-Schemes-in-the-Czech-Republic-and-Poland-34-320.jpg)

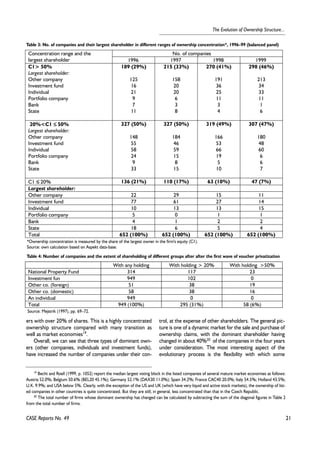
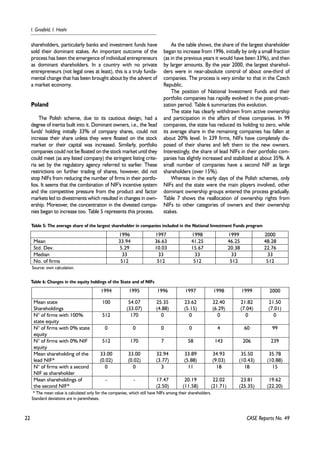
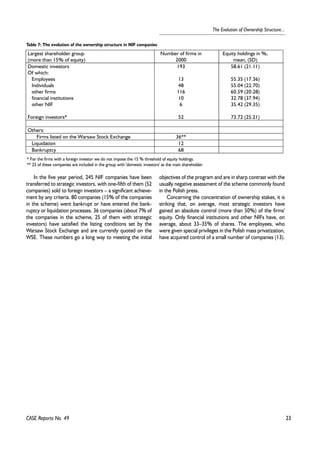
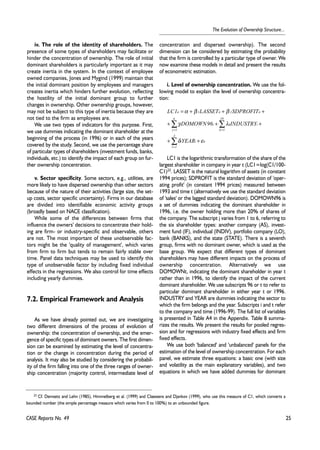
The document discusses the evolution of ownership structures in firms privatized through wholesale schemes in the Czech Republic and Poland, supported by research funded by the EU's Phare ACE program. It investigates the effects of privatization on corporate governance, ownership concentration, and the factors influencing changes in ownership since privatization. The findings highlight that ownership structures initially created by wholesale privatization have evolved, becoming more concentrated and identifying dominant owners in the privatized firms.


