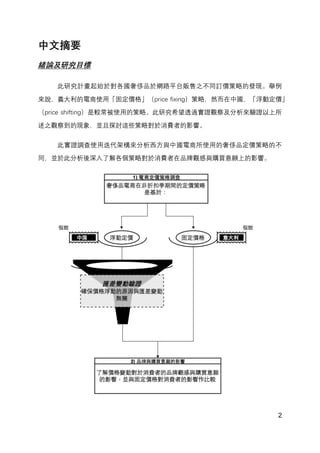
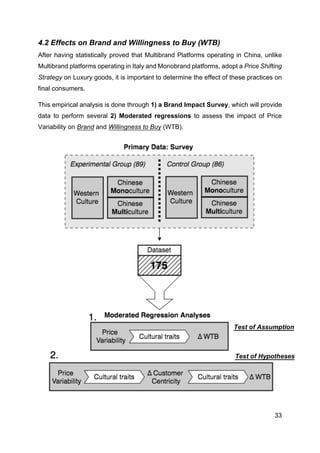
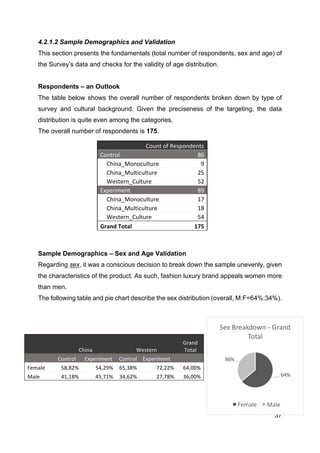
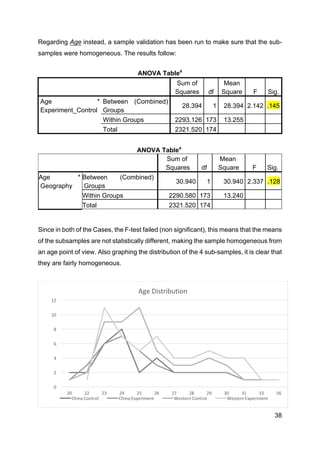
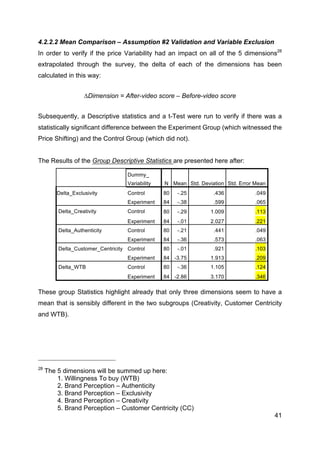
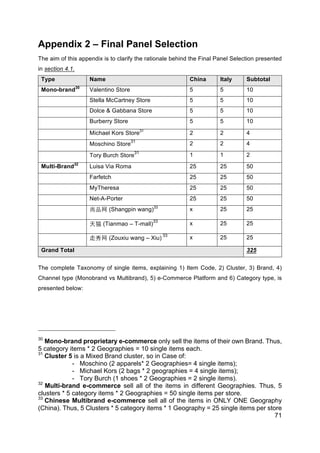
This study examines luxury e-pricing strategies across different e-commerce platforms in China and Italy. It analyzes price fluctuations over 55 days and finds that:
1) Italian multi-brand platforms employ a "fixed pricing" strategy while Chinese platforms use a "shifting pricing" strategy with daily price changes.
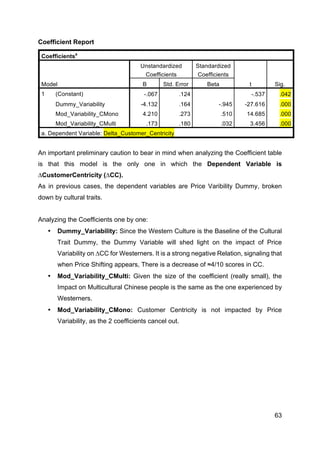
2) Shifting prices negatively impact Chinese consumers' brand perceptions and willingness to buy by lowering their "customer centricity".
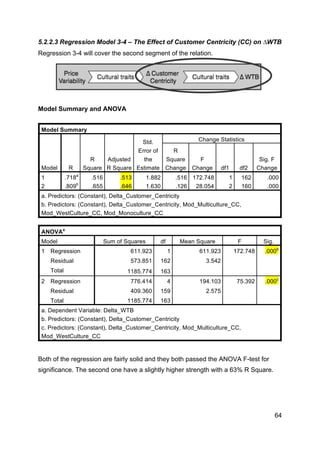
3) Cultural characteristics moderate the effect of shifting prices on willingness to buy, with less impact on multicultural Chinese consumers.
The study concludes shifting prices should be avoided as they undermine brands while fixed pricing maintains integrity and positively influences consumers.


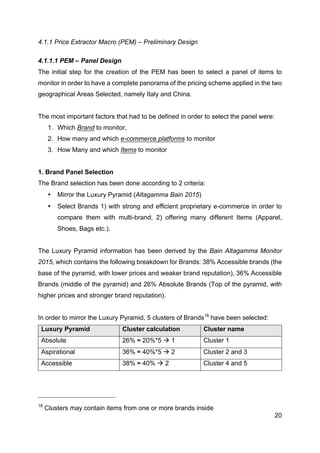
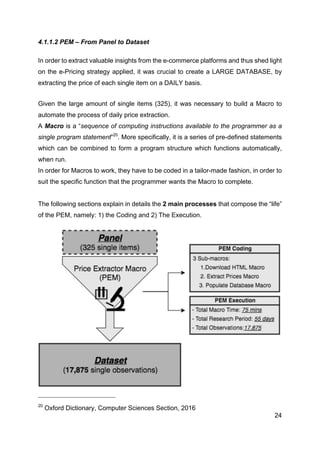
![11
should be replaced with more conversational approaches, where brands “talk WITH
consumers” 3
. The author emphasizes the importance of customer centricity, price
harmonization and transparency, underlining that “advertising dressed as something
else [trying to make customers believe something not factually verified] can only result
in backlash”3
.
Regarding this issues, the aim of this paper is to bring to the surface a price tactic
applied by Multibrand Platforms4
in one region (Price shifting in China) that might
become a threat to the brand perception of consumers everywhere.
Exane Paribas and Contactlab have published in October 2015 their annual
Digital Luxury: Online Pricing Landscape5
. The report analyzes in depth the item
selection and price range of the ENTIRE collection presented online by many Luxury
brands. The report underlines many of strategies and decisions embarked by Luxury
companies online but does not take into account the possible Inter-period price
variability which is the main research objective of this paper.
Regarding the second area, the existing literature mainly focuses on Generational
Researches that try to explain consumption decisions of luxury consumers towards
luxury goods.
Xu, Y. and Giovannini, S. in Luxury fashion consumption and Generation Y
consumers6
investigates the consumption dynamics of American Generation Yers with
a strong focus on Luxury consumption.
Liu, Q. in An Empirical Research On Online Luxury Goods Buying intention of
Generation Y in China 7
evaluates the same fundamentals, focusing on Chinese
Generation Yers.
This research paper starts from the Generational Research made by existing literature,
namely the distinction between Generation X and Y. Later on, it tries to understand the
impact of pricing on the Brand perception of consumers introducing Cultural Traits and,
more specifically, Cultural Homogeneity and Heterogeneity. Cultural traits are
additional with respect to Generational Traits.
4
For more info about “Multibrand”, check the Section 3.1.1 below.
5
Exane Paribas - ContactLab, (2015). Digital Luxury: Online Pricing Landscape SS15.
Luxury Goods. Milano: Exane Paribas, ContactLab.
6
Journal of Fashion Marketing and Management, 19(1), pp.22-40.
7
Master of Science Dissertation. Bocconi University.](https://image.slidesharecdn.com/ccf1275c-4d09-4280-b8ed-1d0f9ea59b25-161017150552/85/TS1566306_Finale_Titolo-16-320.jpg)
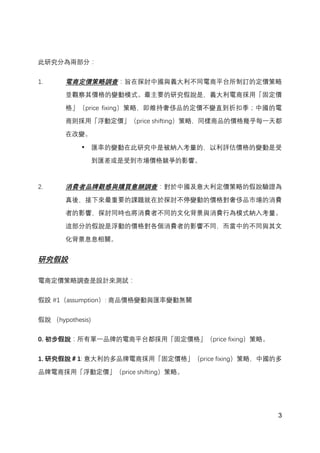
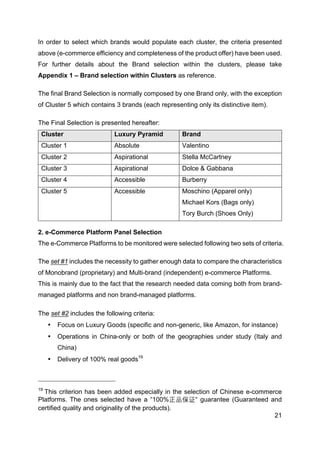
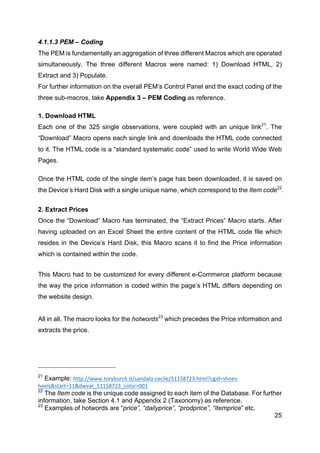
![14
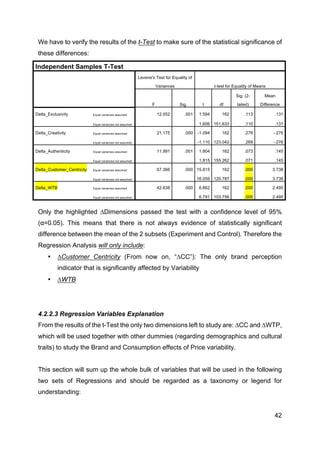
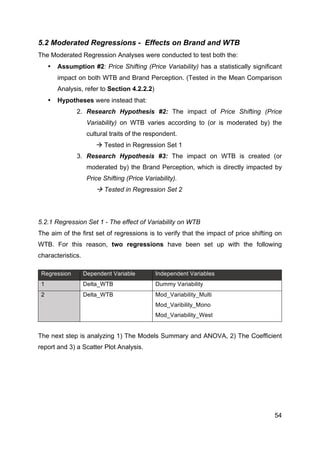
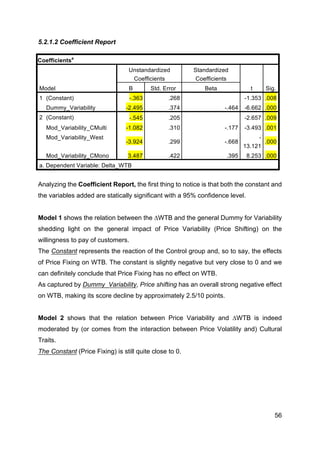
3.1.2 e-Pricing strategies in the Luxury Market: differentials, variability and
harmonization
As mentioned by Bain & Company, 2015 and 2016 will be the years in which “The main
challenge facing most luxury brands [will be] establishing the right pricing model”11
.
This because of two different elements of the market which are emerging and lately
coming into collision:
• Cross-country price differentials
• Digital and e-commerce transparency
Cross-country Price Differential is an element that has strongly possessed the luxury
strategy only in the latest decades. These differentials, which could be as high as
40%12
higher prices exclude tax effect, have become popular when Brands started
adapting their pricing model to emerging countries, especially China. The initial aim of
these differentials was to extract the highest possible Willingness To Pay (WTP) from
consumers assuming the high demand of new riches for Luxury products. This system
was sustainable since the regions where differentials were applied were also
characterized by a high degree of information asymmetry. As time went by, China (and
other emerging markets were differentials were applied) underwent a digital revolution
and a progressive development of the middle class, together with a higher and higher
openness to trade and travel. All these elements gave to the market an unprecedented
level of Transparency which made possible for shoppers to compare before and after-
tax prices worldwide and make consumption decisions differently. Phenomena like
“Shopping Travelling” in European Capitals and 代购 (“Daigou”, Chinese shopping
agents purchasing luxury items in Europe and reselling them in China making a profit
out of the price differential) quickly started to spread.
In order to invert this trend, major Brands are fine-tuning their price models with the
aim of harmonizing world-wide price lists13
. This approach is definitely good in the
long run to avoid value confusion in consumers coming from different regions; however,
11
Bain & Company. (2016). LUXURY GOODS WORLDWIDE MARKET STUDY - FW 2015.
12
Dilen Schneider. (2016). Luxury Consumer Trends Report Q12015
13
Luxury Daily (2016). Chanel aligns prices to prepare for future.](https://image.slidesharecdn.com/ccf1275c-4d09-4280-b8ed-1d0f9ea59b25-161017150552/85/TS1566306_Finale_Titolo-19-320.jpg)
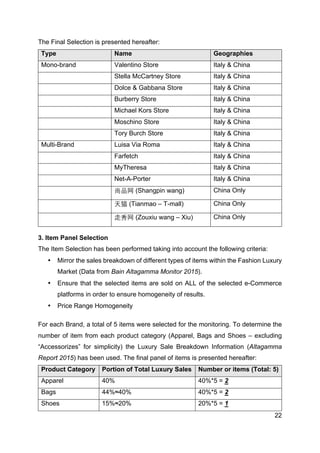
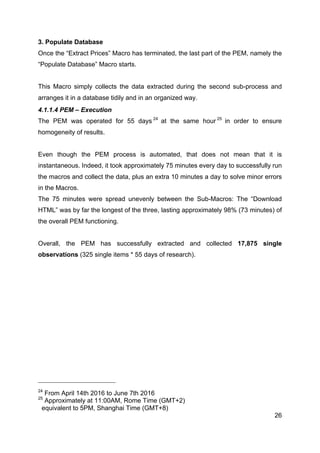


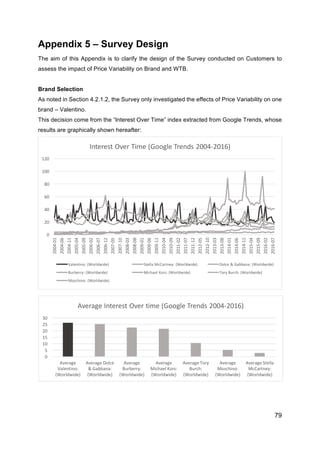
![80
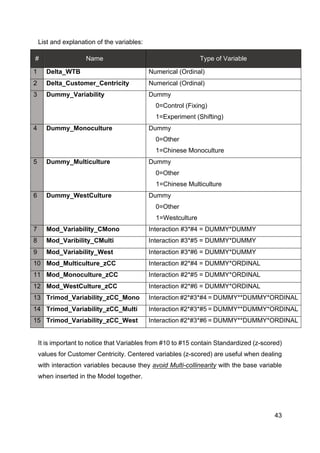
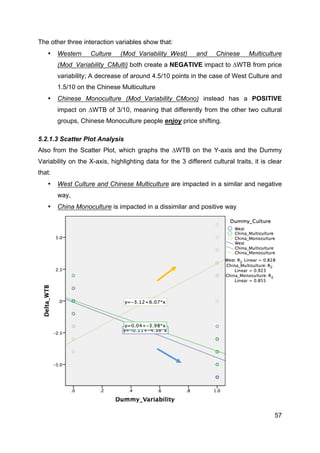
As explained on Google Trends, [the index] “represents search interest relative to the highest
point on the chart for the given region and time. A value of 100 is the peak popularity for the
term”, so the index is done in a comparative way.
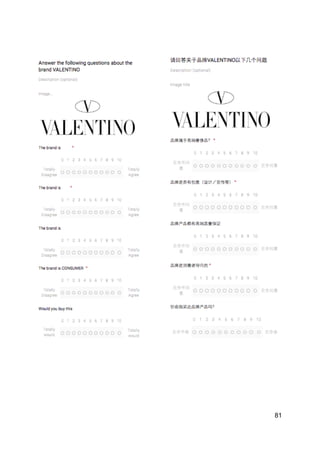
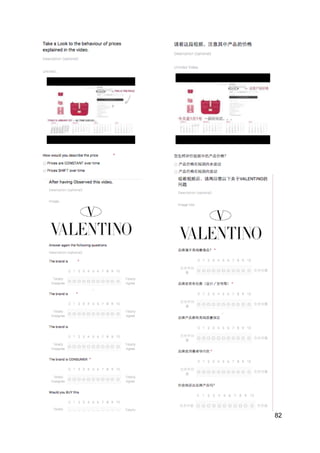
Survey Questions
Hereafter are presented the Texts of the surveys, which are totally identical in their “Control”
and “Experiment” versions. The links to the different videos are contained in this endnote35
35
English Experiment: https://www.youtube.com/watch?v=YHzydfN0pqg
English Control: https://www.youtube.com/watch?v=N8hl14bBtVM
Chinese Experiment: https://www.youtube.com/watch?v=RK1Bbo7VyVc
Chinese Control:](https://image.slidesharecdn.com/ccf1275c-4d09-4280-b8ed-1d0f9ea59b25-161017150552/85/TS1566306_Finale_Titolo-85-320.jpg)
![83
References
Bain & Company Italy. (2015). Altagamma 2015 Worldwide Market Monitor
Bain & Company. (2016). LUXURY GOODS WORLDWIDE MARKET STUDY
Fall−Winter 2015. [online] Available at:
http://www.bain.com/Images/BAIN_REPORT_Global_Luxury_2015.pdf [Accessed 30
Aug. 2016].
Dilen Schneider. (2016). Luxury Consumer Trends Report Q12015. [online]
Available at:
http://www.dilenschneider.com/files/march_2015/Luxury_Consumer_Trend_Report_1
st_Quarter_2015.pdf [Accessed 30 Aug. 2016].
Exane Paribas - ContactLab, (2015). Digital Luxury: Online Pricing Landscape
SS15. Luxury Goods. Milano: Exane Paribas, ContactLab.
Erica Corbellini, Stefania Saviolo. (2009). Managing Fashion and Luxury
Companies, ETAS
Google Trends, Available at: https://www.google.it/trends (Accessed: June 2016)
Heine, Klaus: (2011) The Concept of Luxury Brands. Luxury Brand Management,
No. 1, ISSN 2193-1208
Isaac, T. (2009). Online Luxury Rx: Power To The People. WWD: Women's Wear
Daily, 198(100).
Liu, Q. (2009). An Empirical Research On Online Luxury Goods Buying intention of
Generation Y in China. Master of Science Dissertation. Bocconi University.
Luxury Daily (2016). Chanel aligns prices to prepare for future. [online] Available at:
https://www.luxurydaily.com/chanel-aligns-prices-to-prepare-for-future/ [Accessed 30
Aug. 2016].
Luxury Daily (2016). Chanel’s handbag pricing outpaces rising inflation rates.
[online] Available at: https://www.luxurydaily.com/chanel-aligns-prices-to-prepare-for-
future/ [Accessed 30 Aug. 2016].
McKinsey & Company. (2016). Is luxury e-commerce nearing its tipping point?.
[online] Available at: http://www.mckinsey.com/industries/consumer-packaged-
goods/our-insights/is-luxury-ecommerce-nearing-its-tipping-point [Accessed 30 Aug.
2016].](https://image.slidesharecdn.com/ccf1275c-4d09-4280-b8ed-1d0f9ea59b25-161017150552/85/TS1566306_Finale_Titolo-88-320.jpg)
![84
OANDA Historical currency converter - solutions for business (no date) Available
at: https://www.oanda.com/solutions-for-business/historical-rates/main.html
(Accessed: April 2016).
Okonkwo, U. (2009). Sustaining the luxury brand on the Internet. Brand
Management, 16(5/6,), pp.302–310.
Okonkwo, U. (2010). Luxury online. Basingstoke: Palgrave Macmillan.
Oxford Dictionary. (2016). Computer Science Section
The Business of Fashion. (2016). Italian Industry Debates Luxury Equation in
Crisis. [online] Available at: https://www.businessoffashion.com/articles/news-
analysis/italy-fashion-industry-camera-nazionale-della-moda [Accessed 29 Aug.
2016].
UK Business Insider. (2016). Burberry just laid bare how awful the luxury market is
right now [online] Available at: http://uk.businessinsider.com/burberry-2016-results-
cost-cutting-missing-targets-china-2016-5?r=DE&IR=T [Accessed 30 Aug. 2016].
Wei R., Su J. (2012), The statistics of English in China, English Today (28/03), pp 10
-14
Xu, Y. and Giovannini, S. (2015). Luxury fashion consumption and Generation Y
consumers. Journal of Fashion Marketing and Management, 19(1), pp.22-40.
卢泰宏. (2005). 中国消费者行为报告,中国社会科学出版社出版,2005 年 2 月, p.7-10](https://image.slidesharecdn.com/ccf1275c-4d09-4280-b8ed-1d0f9ea59b25-161017150552/85/TS1566306_Finale_Titolo-89-320.jpg)


