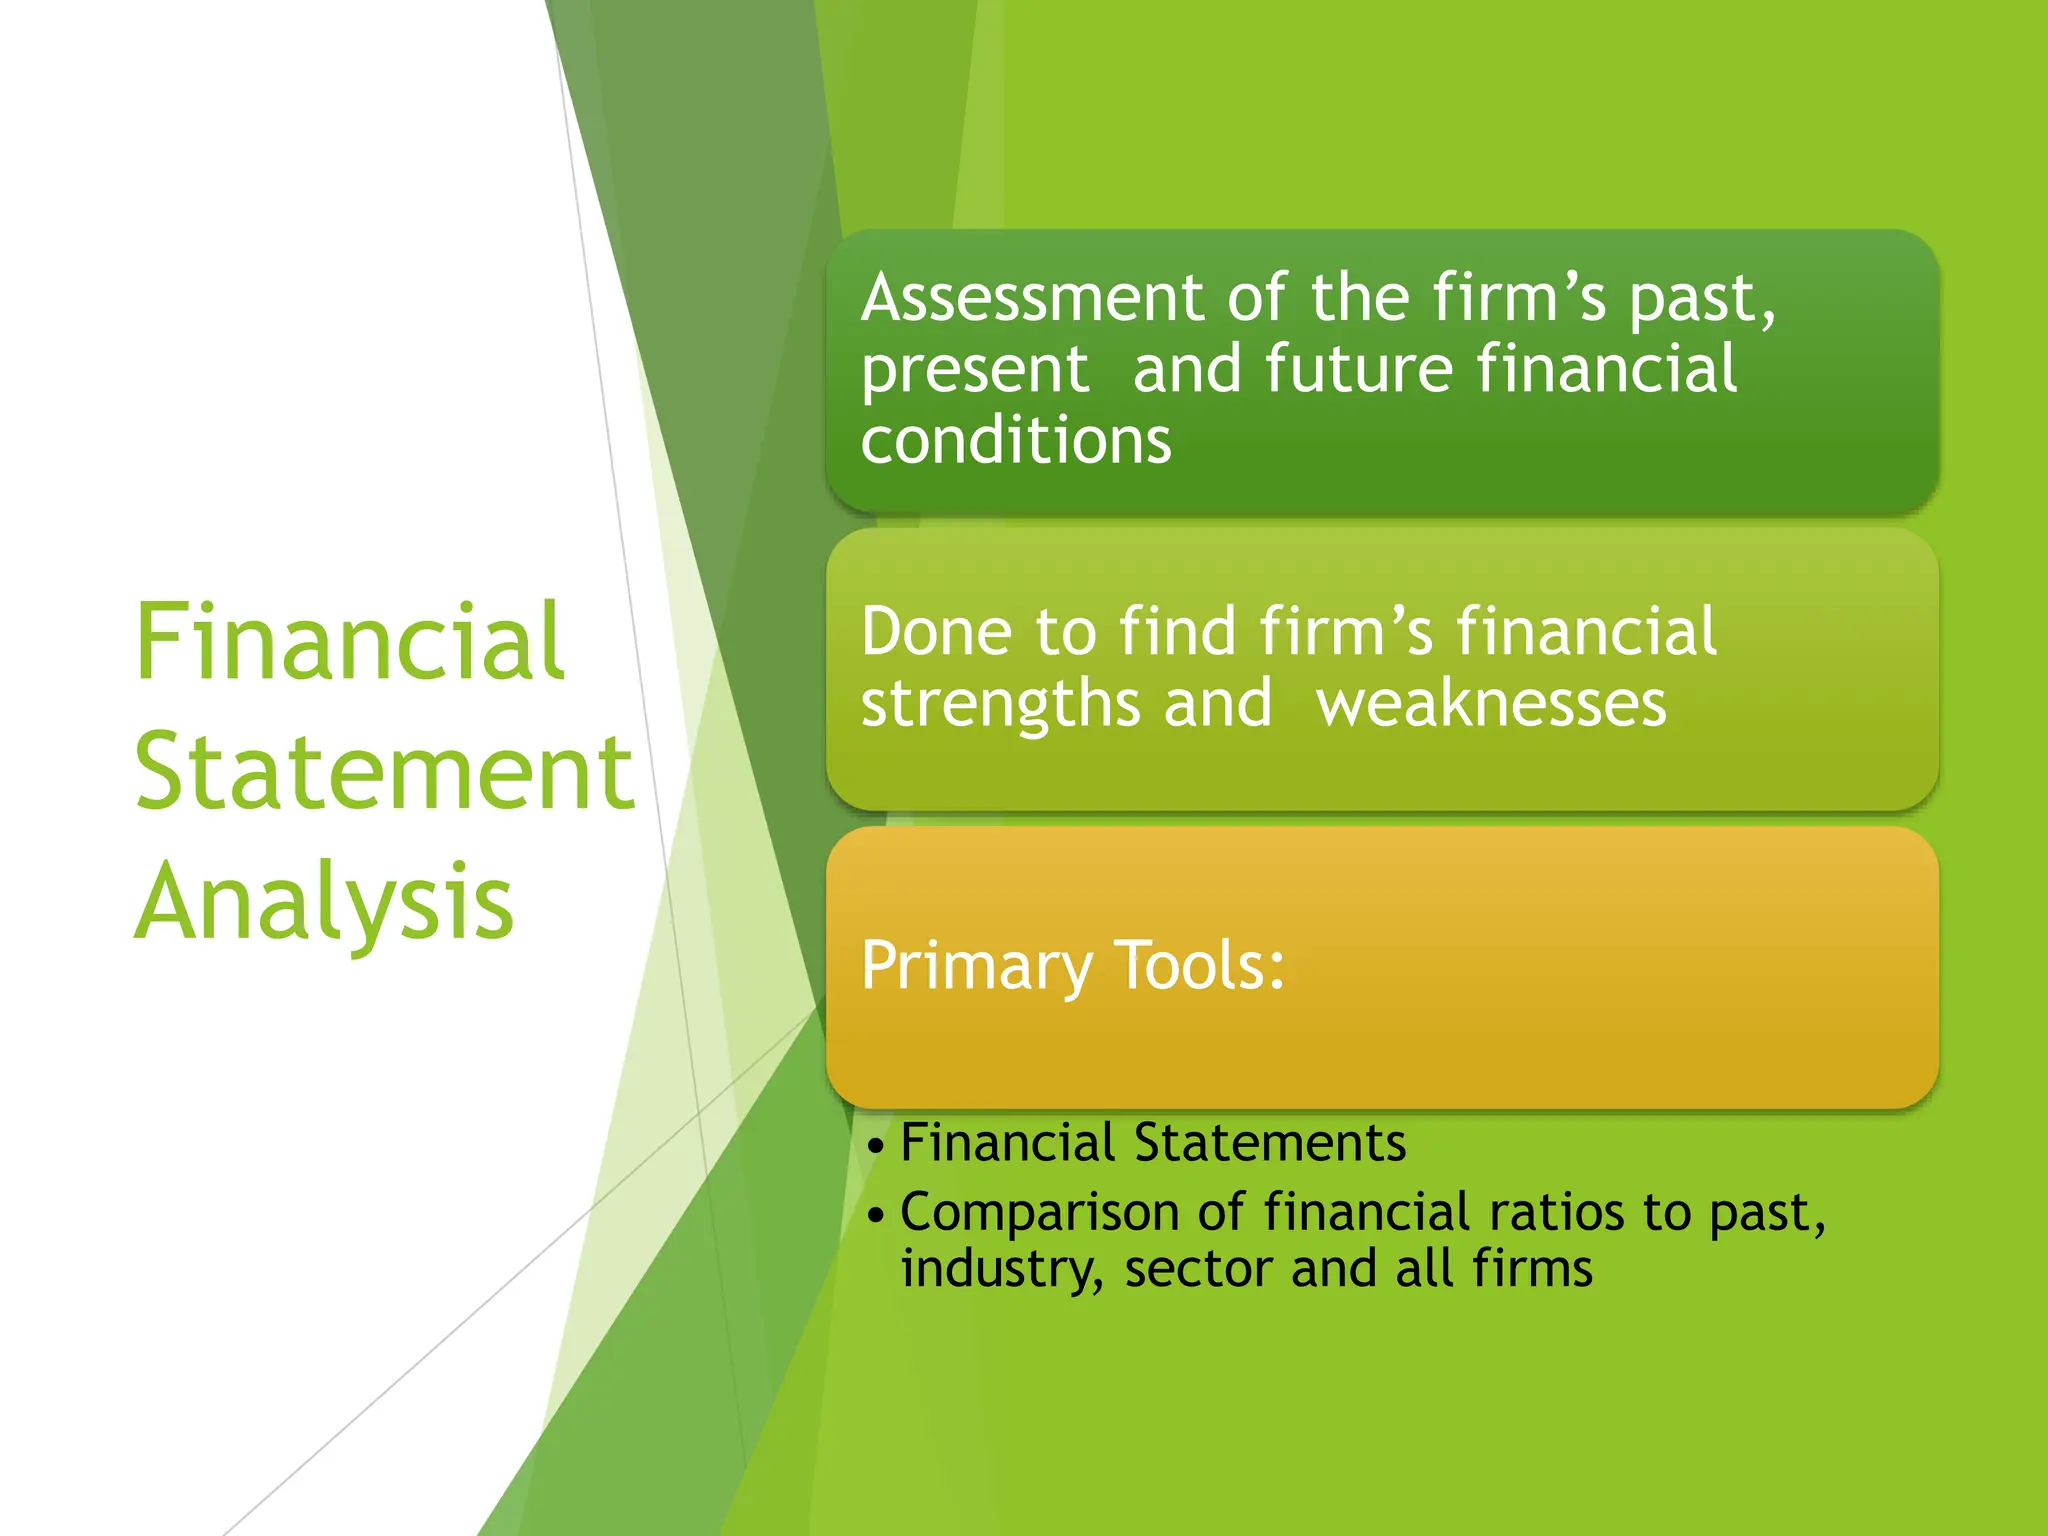
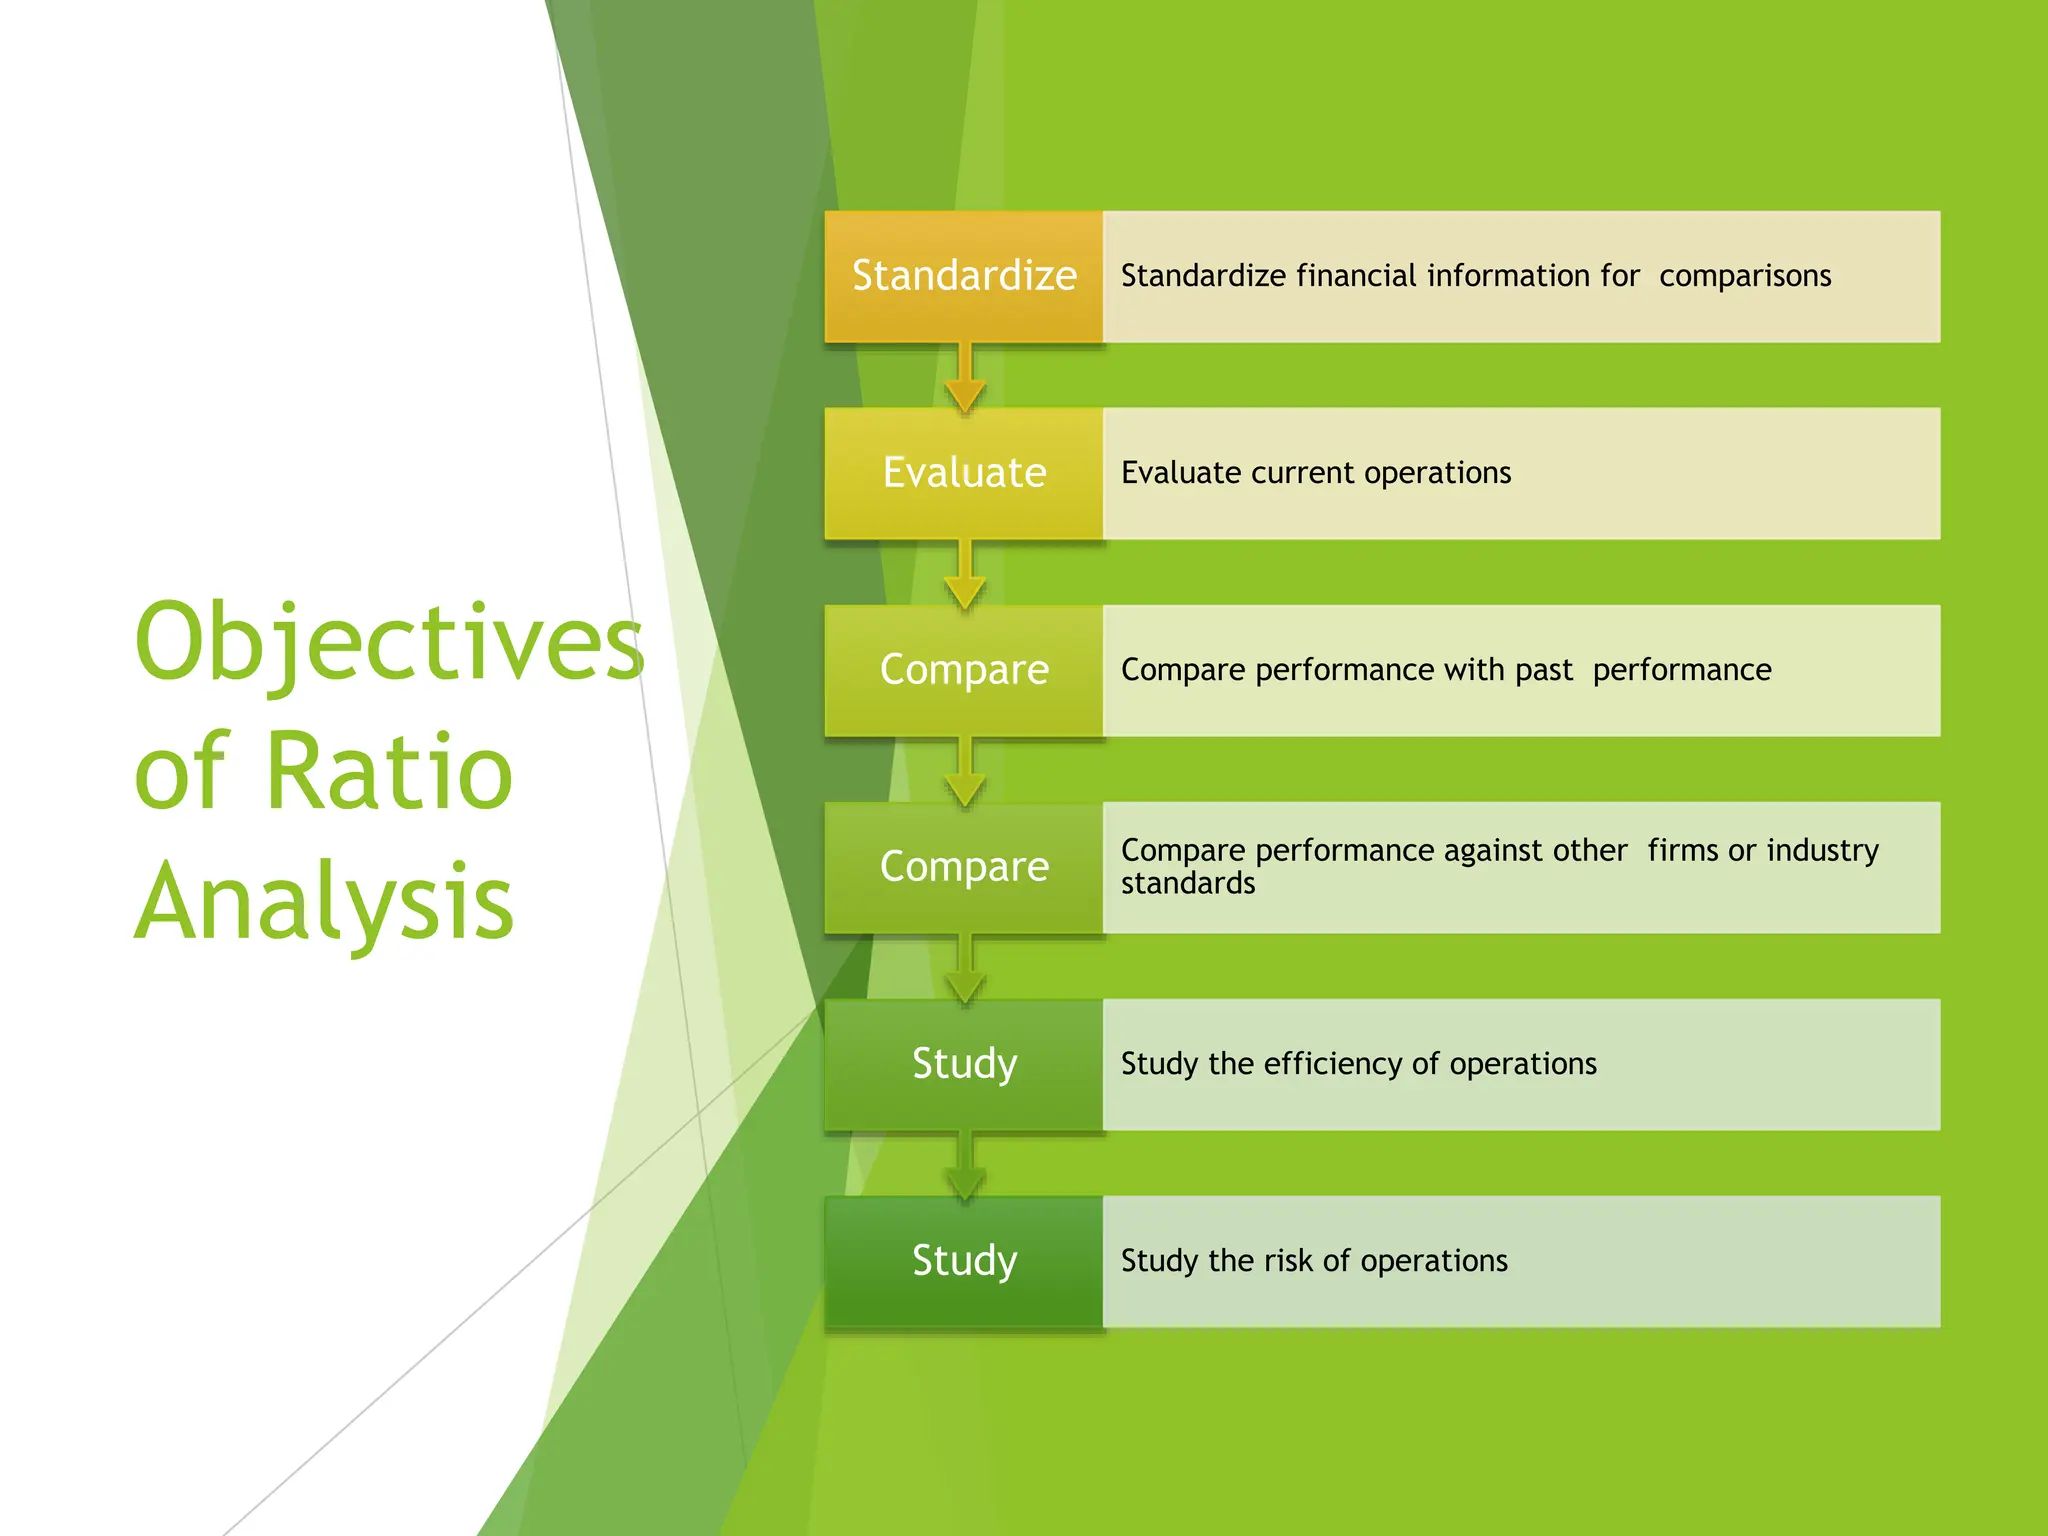
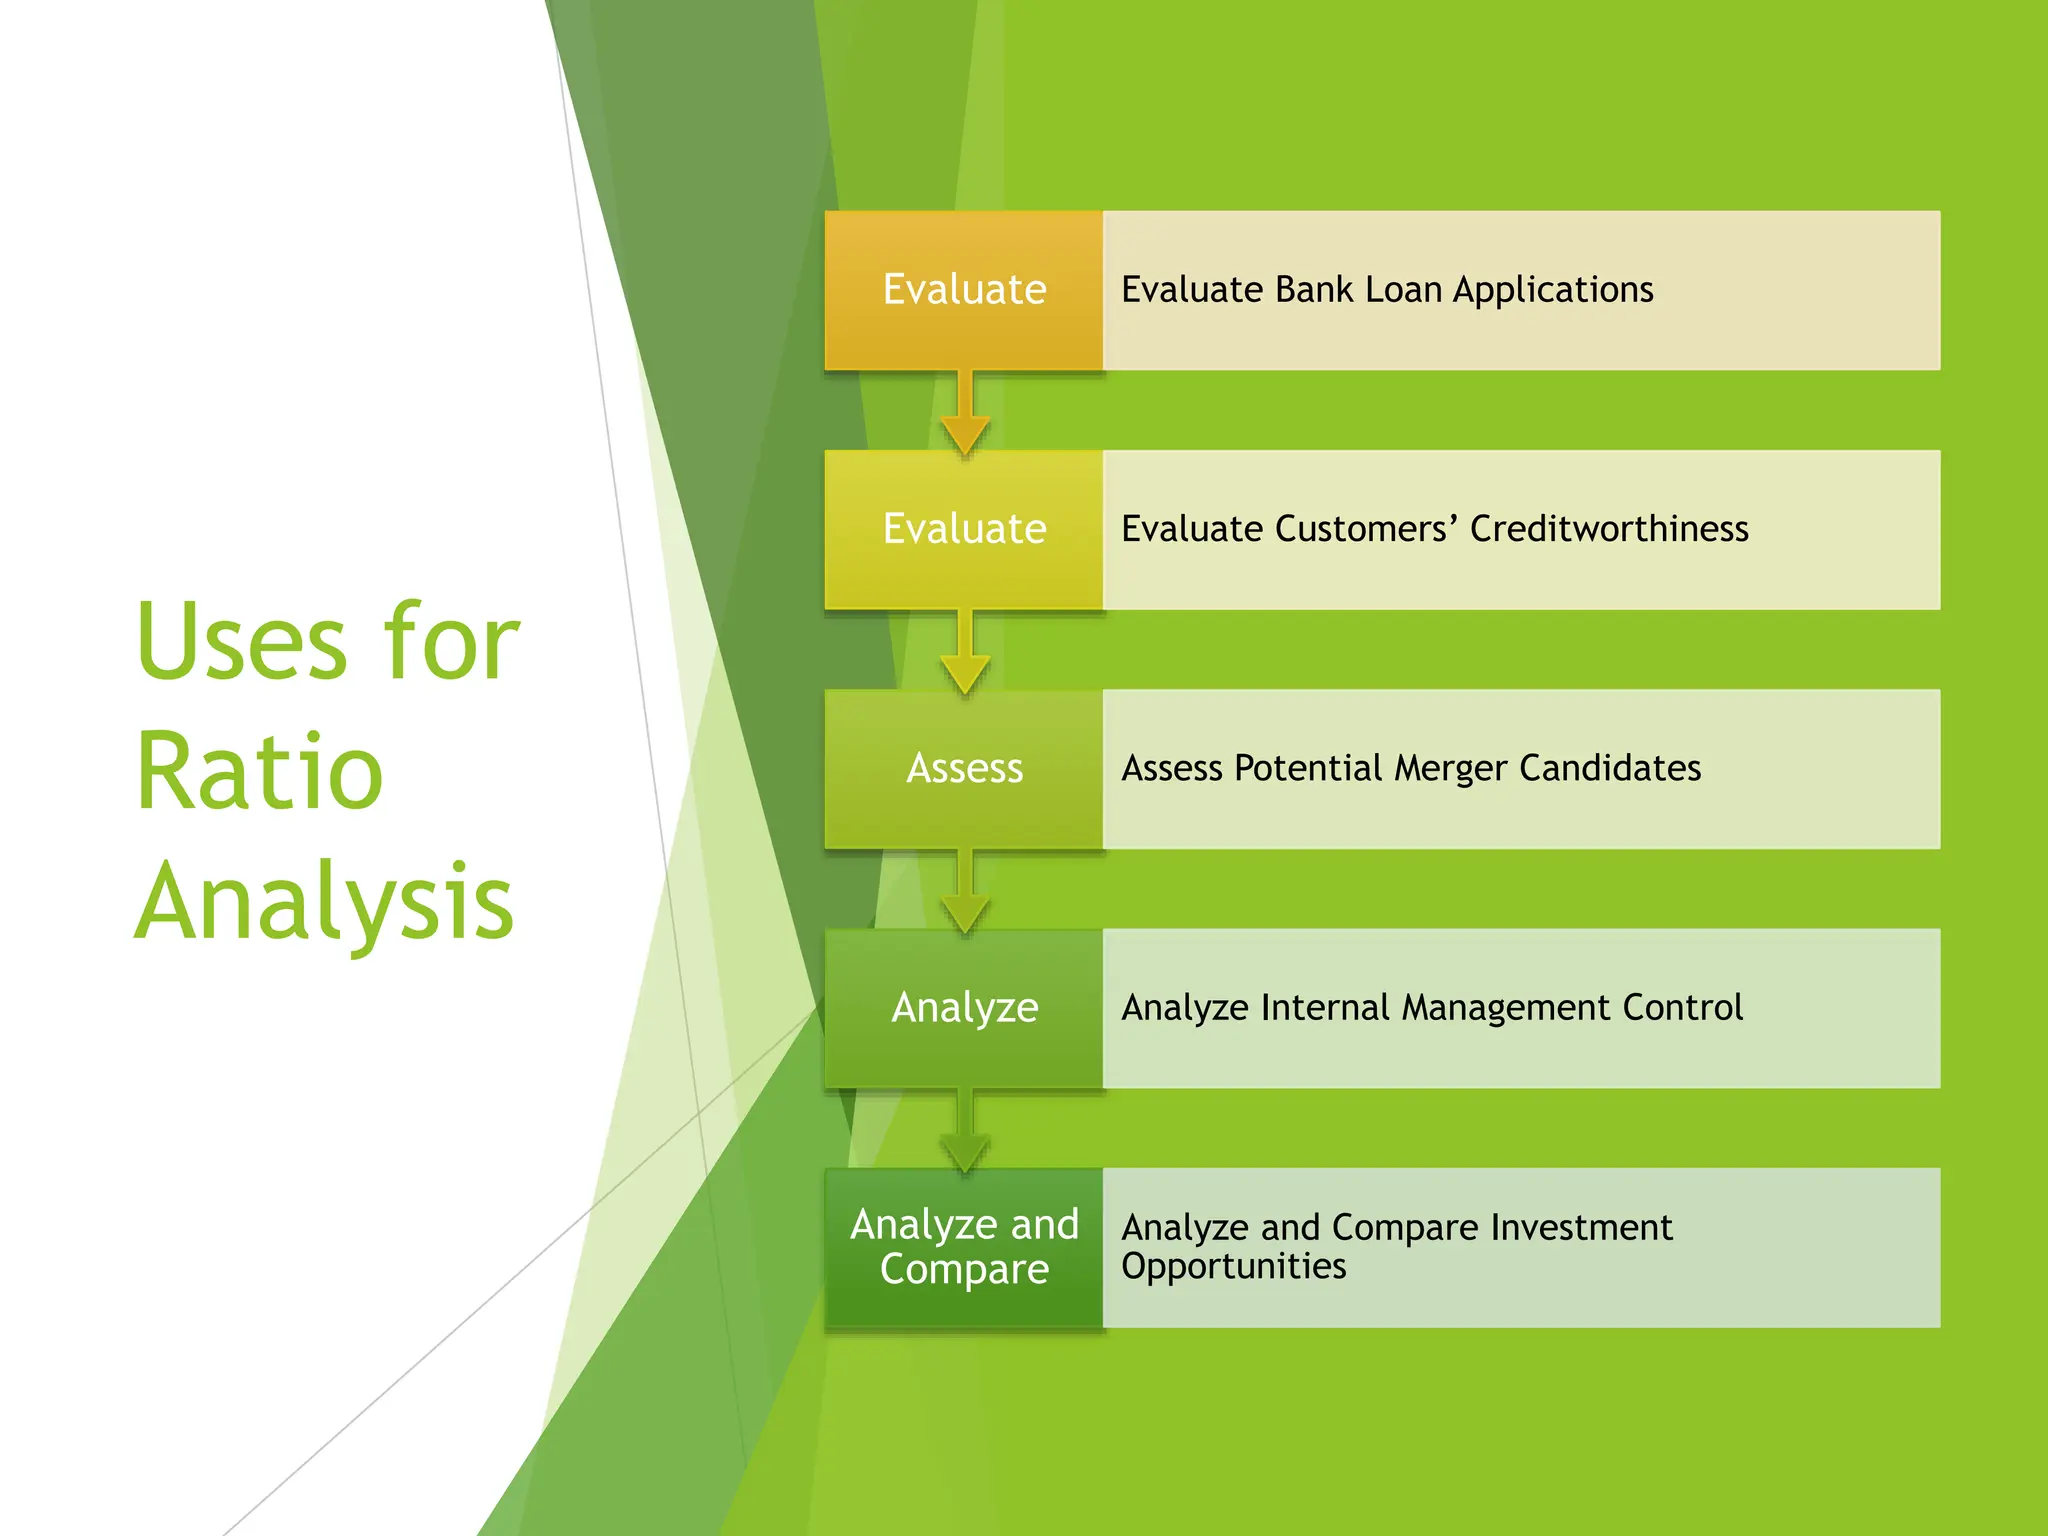
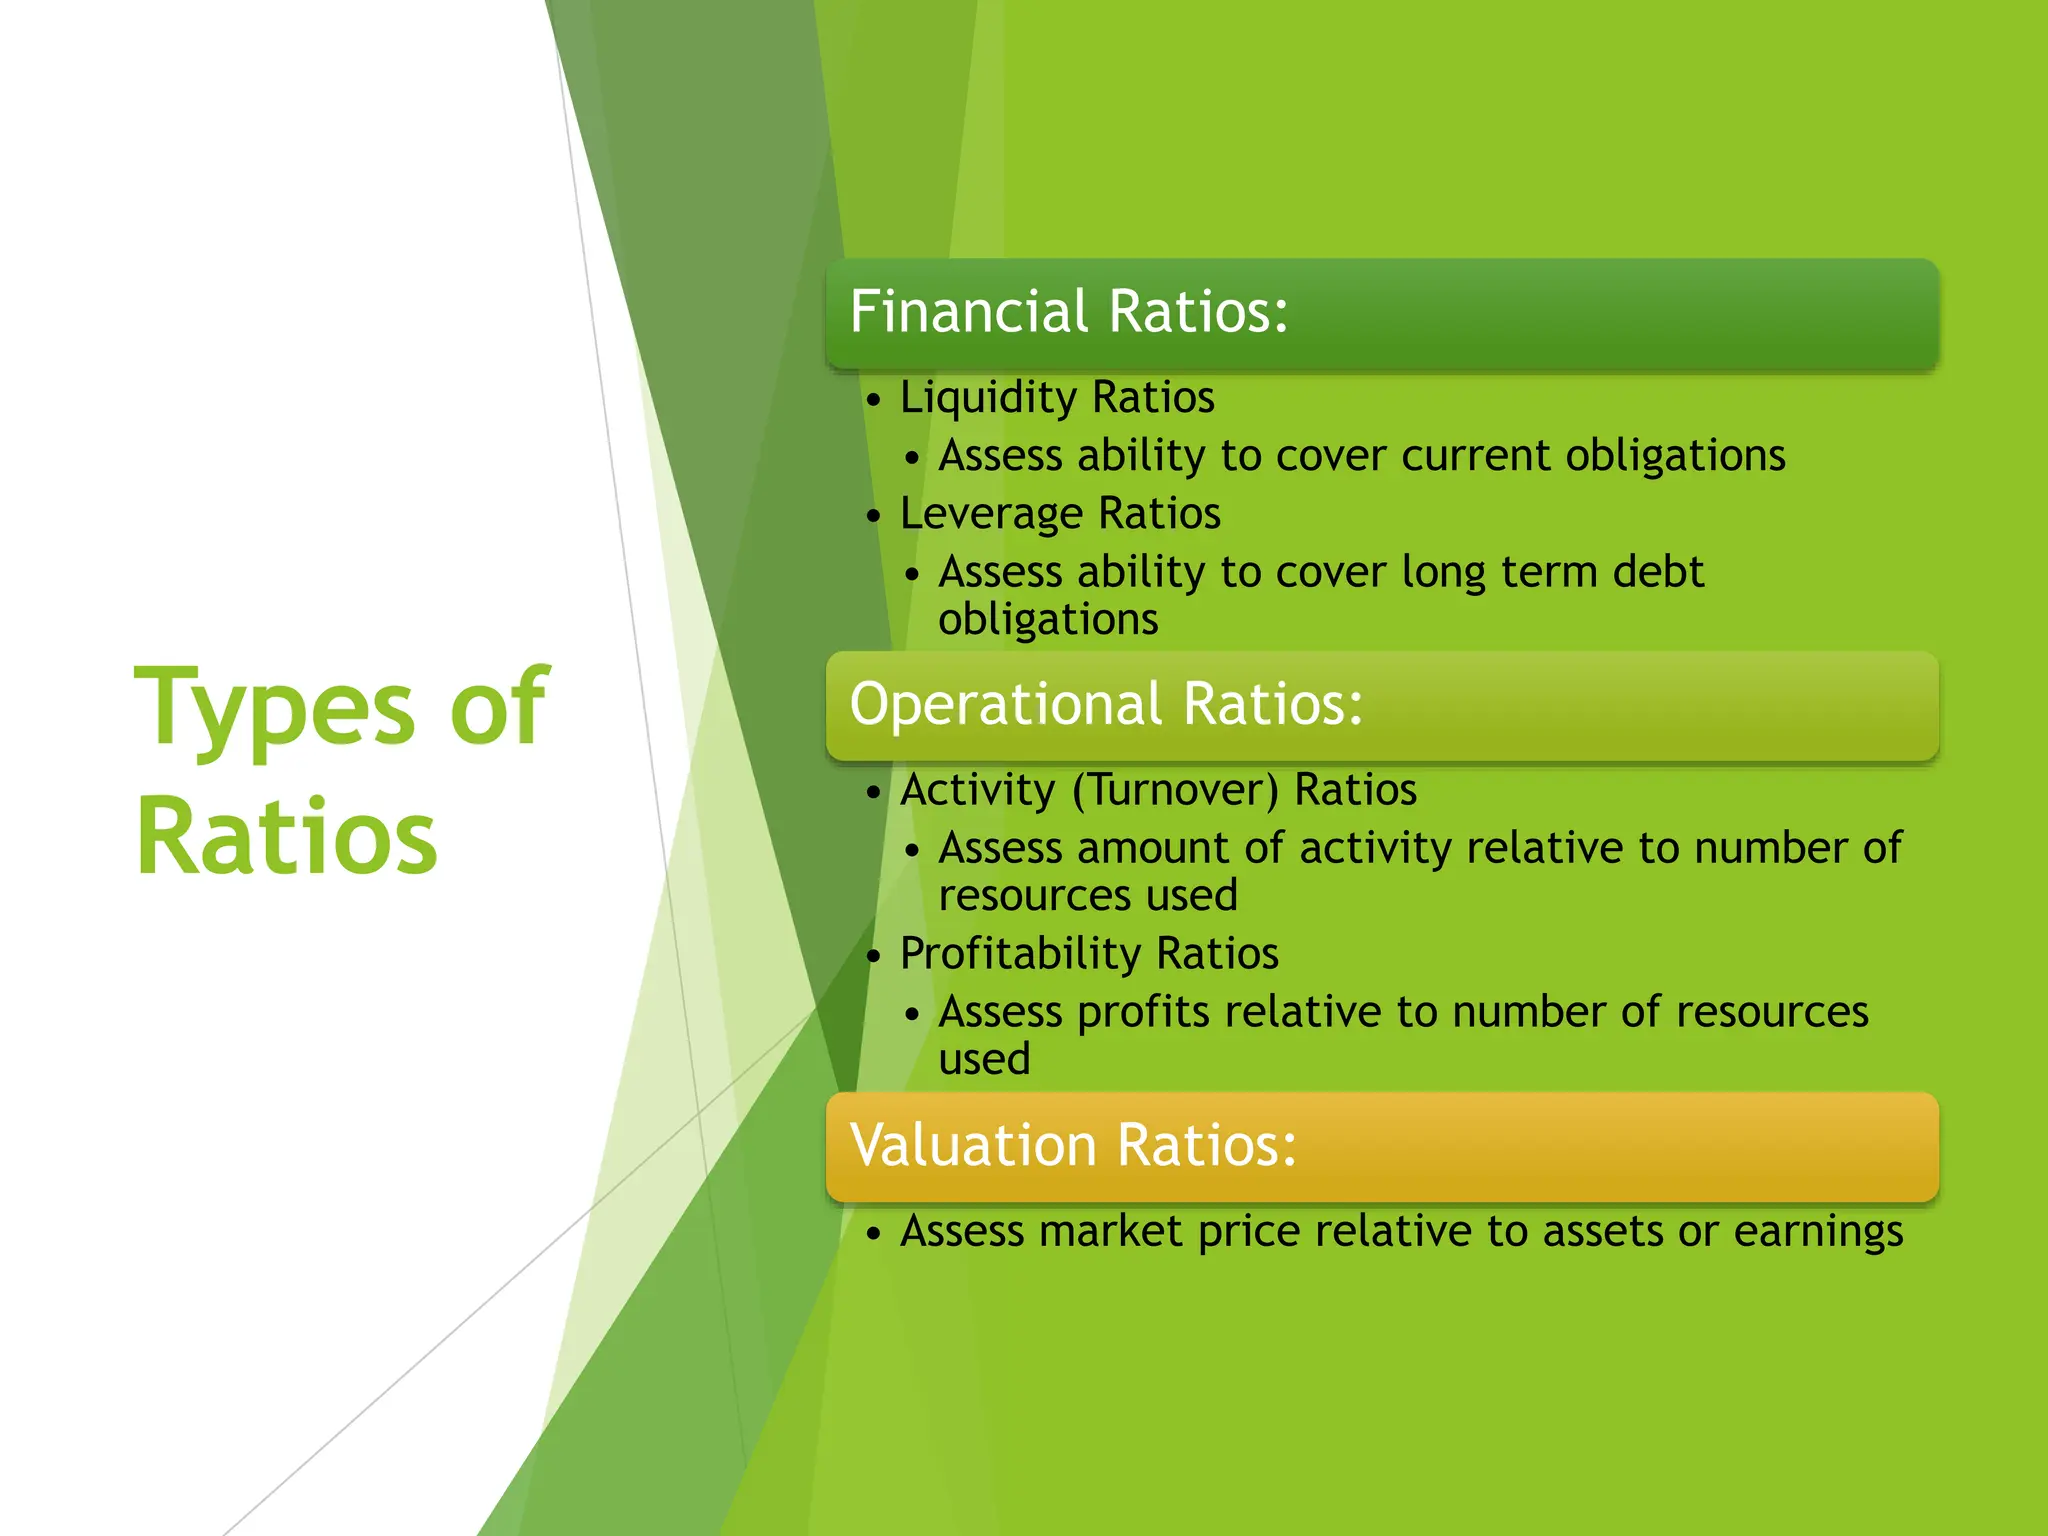
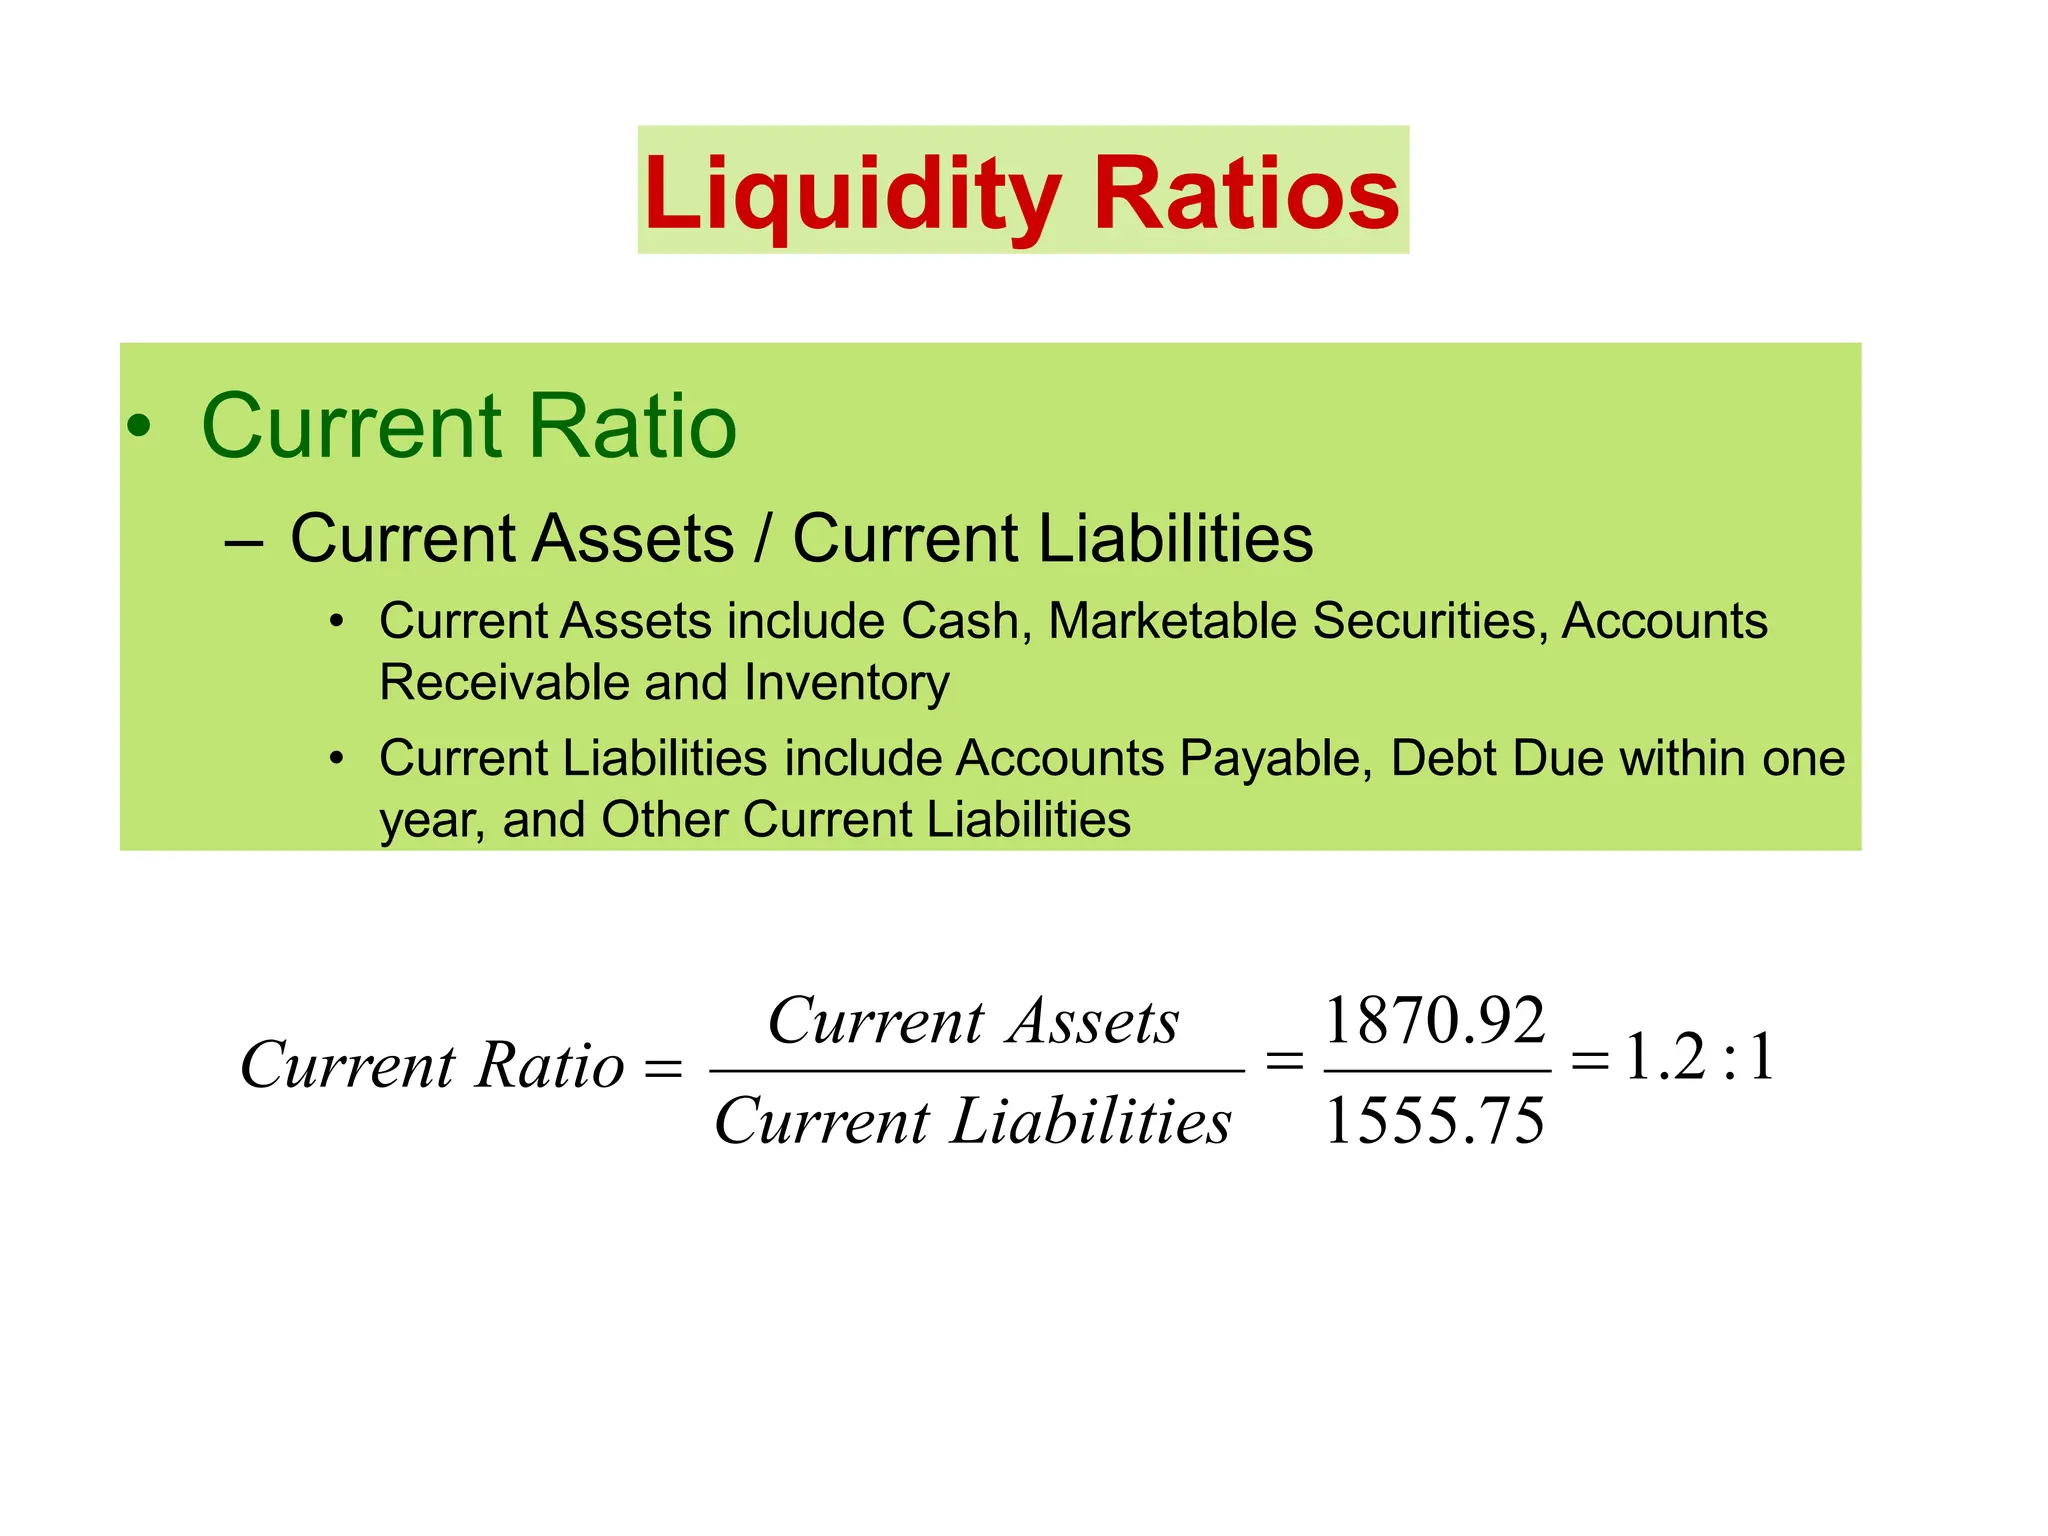
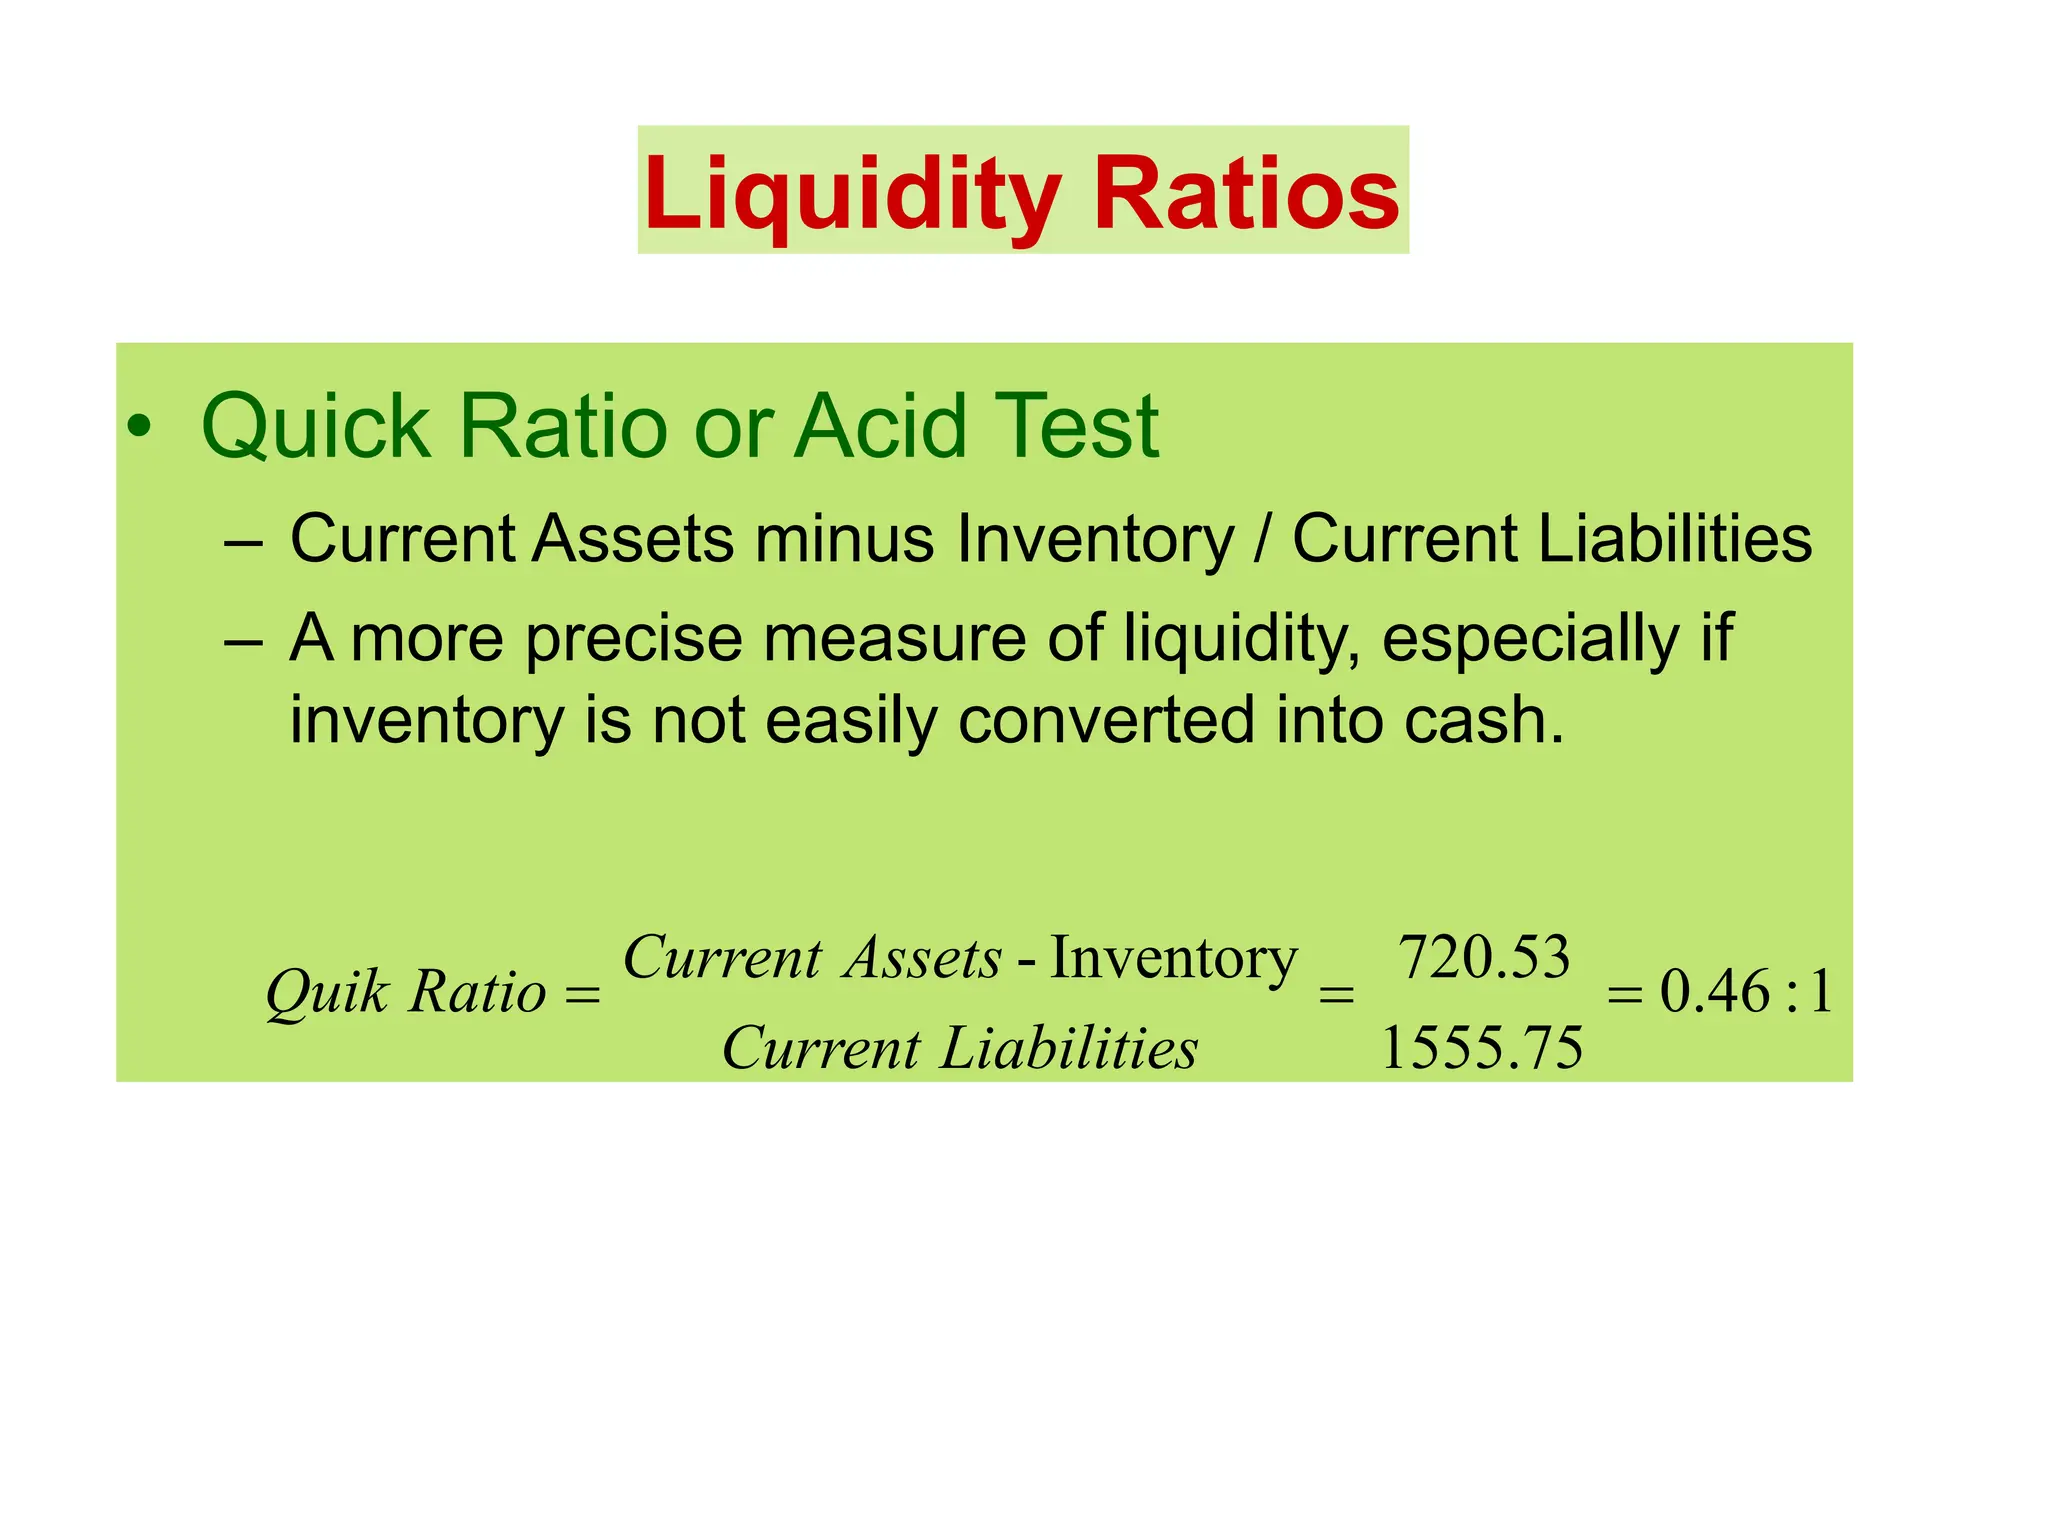
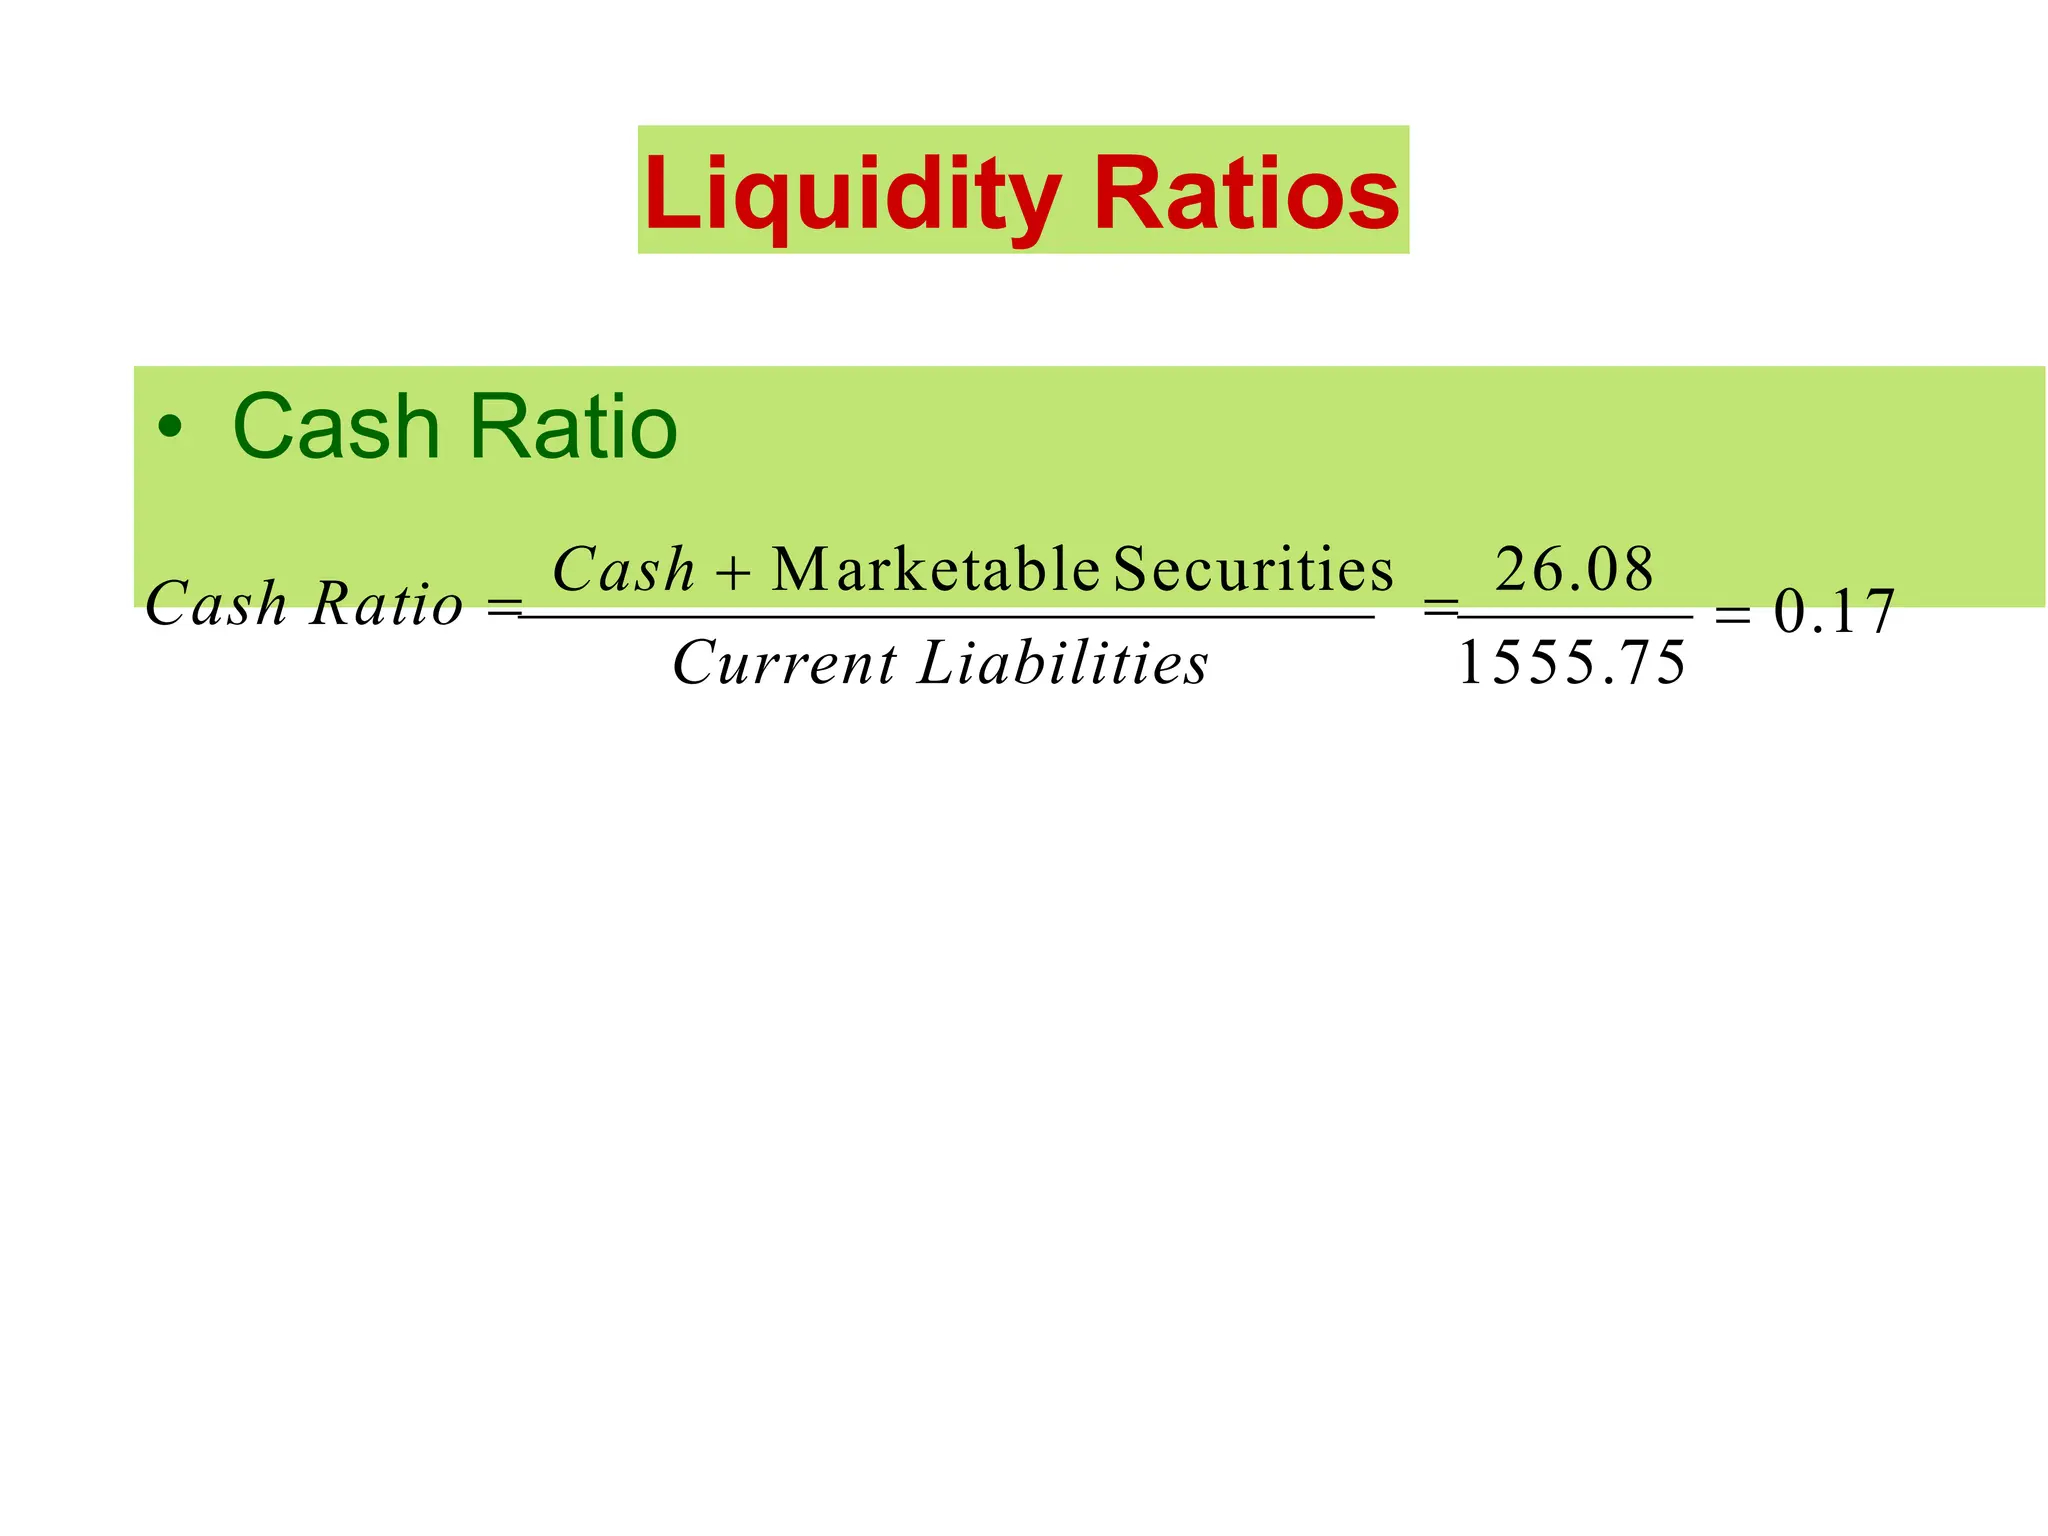
3. Financial
Statement
Analysis
Assessment of the firm’s past,
present and future financial
conditions
Done to find firm’s financial
strengths and weaknesses
Primary Tools:
• Financial Statements
• Comparison of financial ratios to past,
industry, sector and all firms
4. Objectives
of Ratio
Analysis
Study Study the risk of operations
Study Study the efficiency of operations
Compare Compare performance against other firms or industry
standards
Compare Compare performance with past performance
Evaluate Evaluate current operations
Standardize Standardize financial information for comparisons
5. Uses for
Ratio
Analysis
Analyze and
Compare
Analyze and Compare Investment
Opportunities
Analyze Analyze Internal Management Control
Assess Assess Potential Merger Candidates
Evaluate Evaluate Customers’ Creditworthiness
Evaluate Evaluate Bank Loan Applications
6. Horizontal, Vertical, & Trend Analysis
Horizontal Analysis = calculating
the Rupee change and % change
in financial statement amounts
across time
Vertical Analysis (Common Size
Analysis) = changing all Rupee
values for accounts to % values.
Trend Analysis = Using the
“first” year as a base year,
calculate future year Rupee
values as a ratio.
7. Types of
Ratios
Financial Ratios:
• Liquidity Ratios
• Assess ability to cover current obligations
• Leverage Ratios
• Assess ability to cover long term debt
obligations
Operational Ratios:
• Activity (Turnover) Ratios
• Assess amount of activity relative to number of
resources used
• Profitability Ratios
• Assess profits relative to number of resources
used
Valuation Ratios:
• Assess market price relative to assets or earnings
8. Liquidity Ratios
• Current Ratio
– Current Assets / Current Liabilities
• Current Assets include Cash, Marketable Securities, Accounts
Receivable and Inventory
• Current Liabilities include Accounts Payable, Debt Due within one
year, and Other Current Liabilities
Current Assets
1870.92
1.2 :1
Current Liabilities 1555.75
Current Ratio
9. Liquidity Ratios
• Quick Ratio or Acid Test
– Current Assets minus Inventory / Current Liabilities
– A more precise measure of liquidity, especially if
inventory is not easily converted into cash.
Quik Ratio
Current Assets - Inventory
720.53
0.46 :1
Current Liabilities 1555.75
10. Liquidity Ratios
• Cash Ratio
Cash Ratio
Cash Marketable Securities
0.17
1555.75
26.08
Current Liabilities
11. Liquidity Ratios
1,870.92 1,150.39
77 Days
3,369.94/ 360
Average Daily operating expenses
Current Assets Inventory
Interval Measure
•Interval Measure
•Calculated to asses a firms ability to meet its regular
cash outgoings