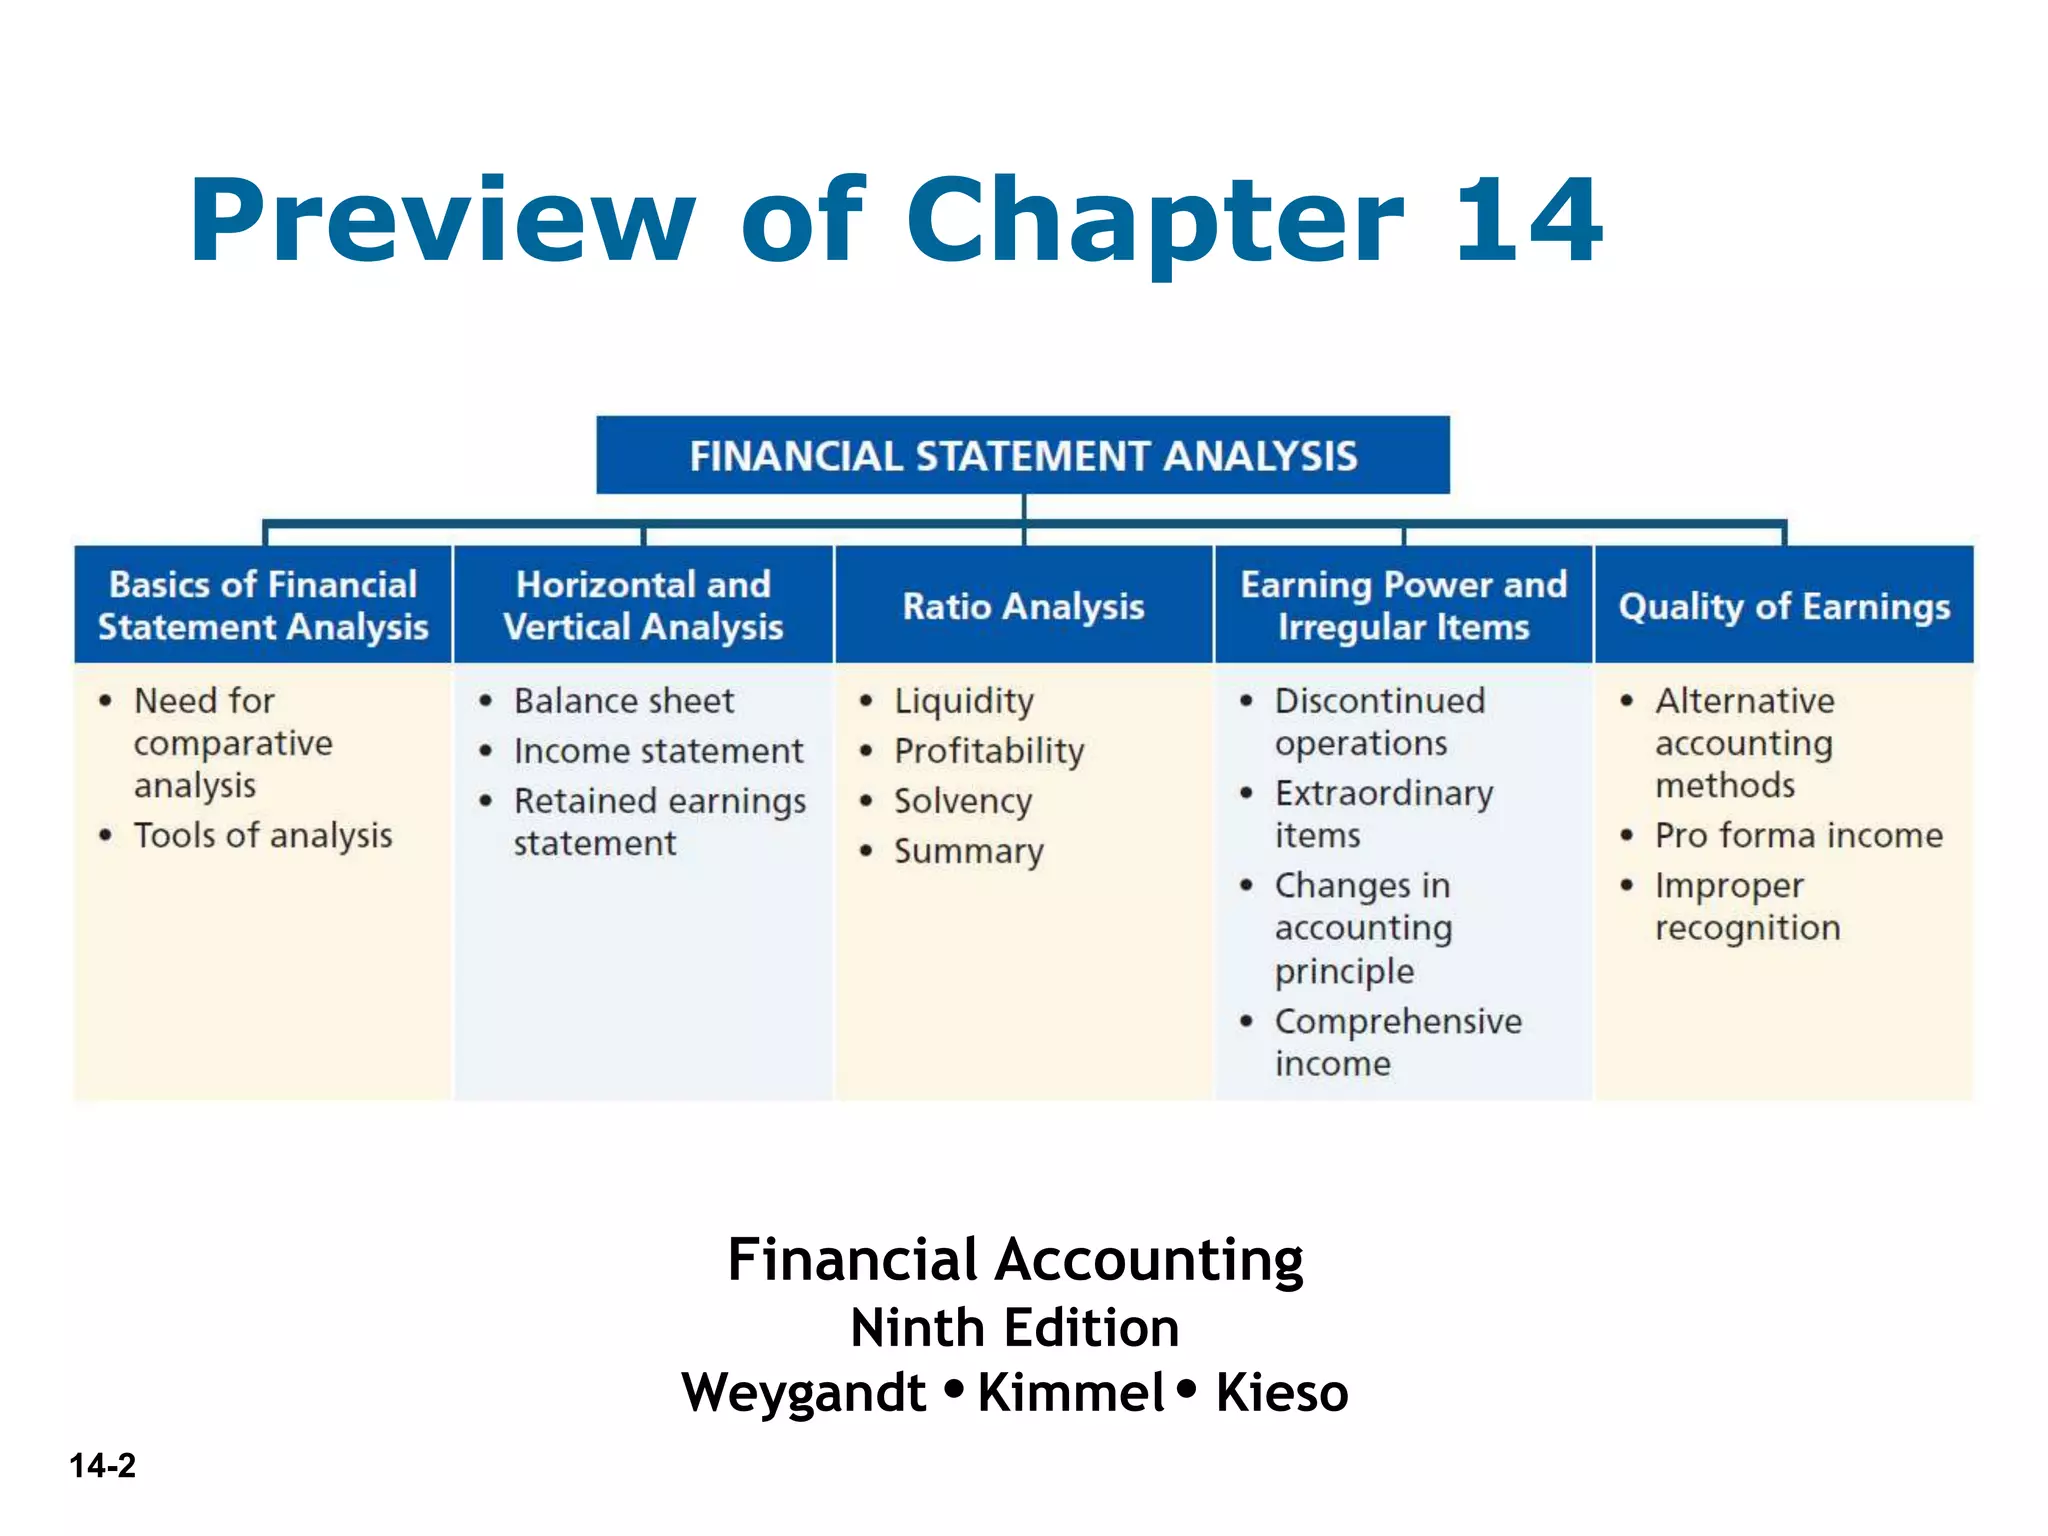
This document provides an overview of Chapter 14 from the textbook "Financial Accounting" on financial statement analysis. It covers the learning objectives of the chapter, which include discussing comparative analysis tools like horizontal and vertical analysis. It also covers computing ratios to analyze a firm's liquidity, profitability, and solvency. Examples are provided to demonstrate horizontal analysis of income statements and balance sheets. Vertical analysis examples also illustrate its use for income statements and balance sheets. Specific liquidity ratios like current ratio, acid-test ratio, accounts receivable turnover and inventory turnover are defined and computed using a sample company's financial statements.

![14-3
14 Financial Statement Analysis
Learning Objectives
After studying this chapter, you should be able to:
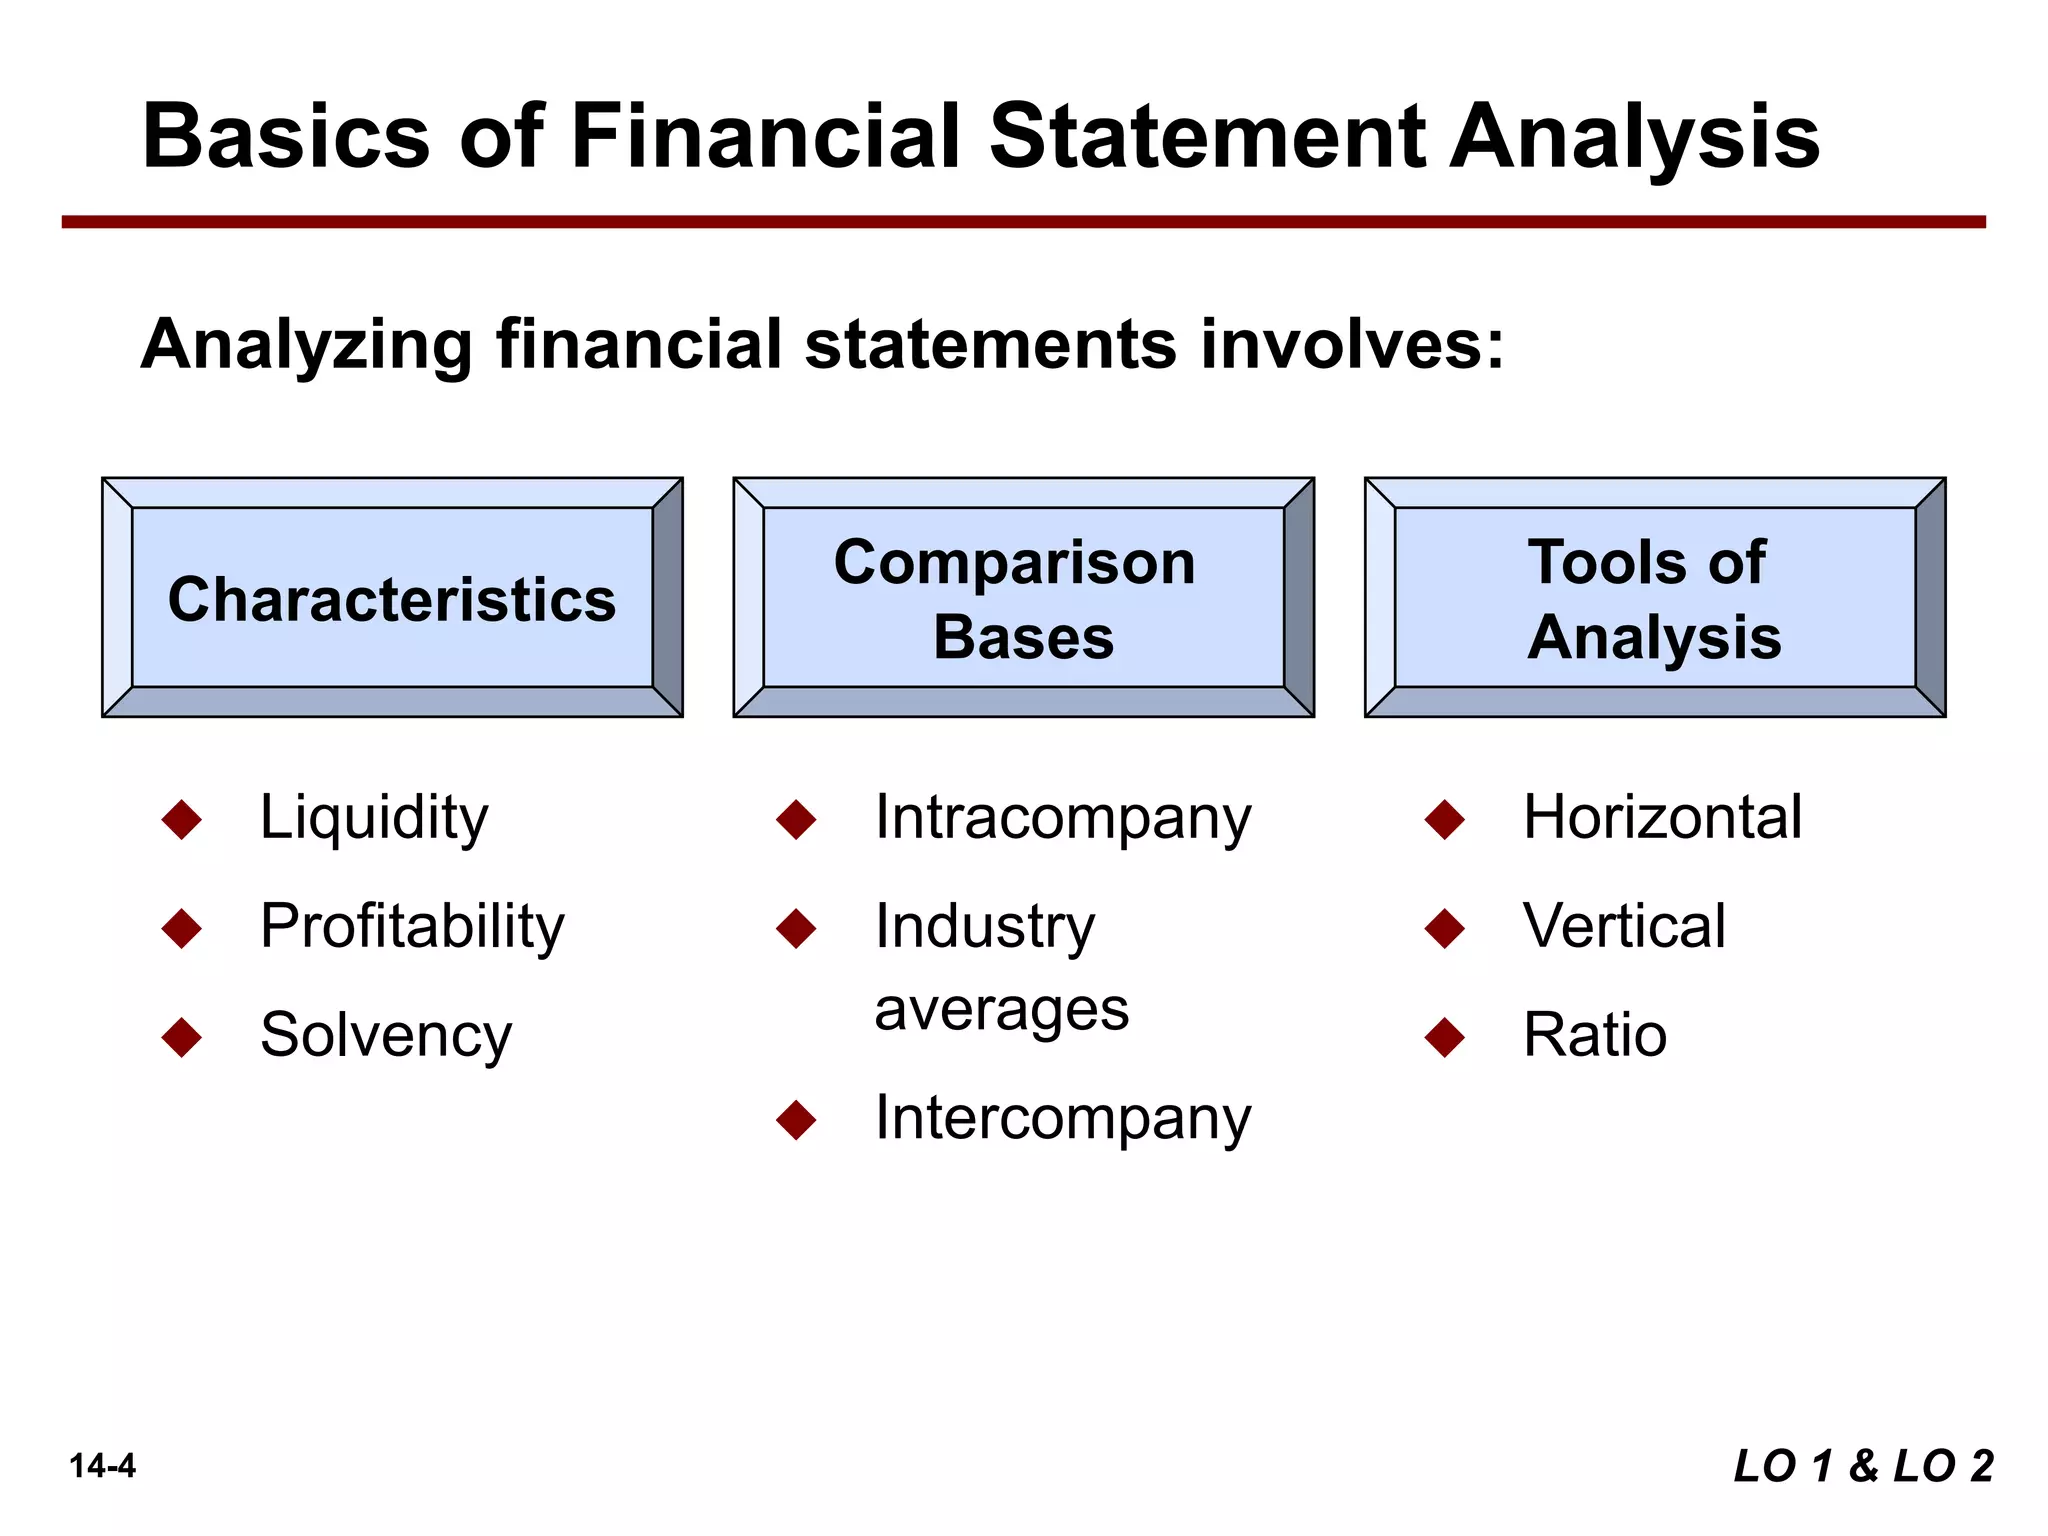
[1] Discuss the need for comparative analysis.
[2] Identify the tools of financial statement analysis.
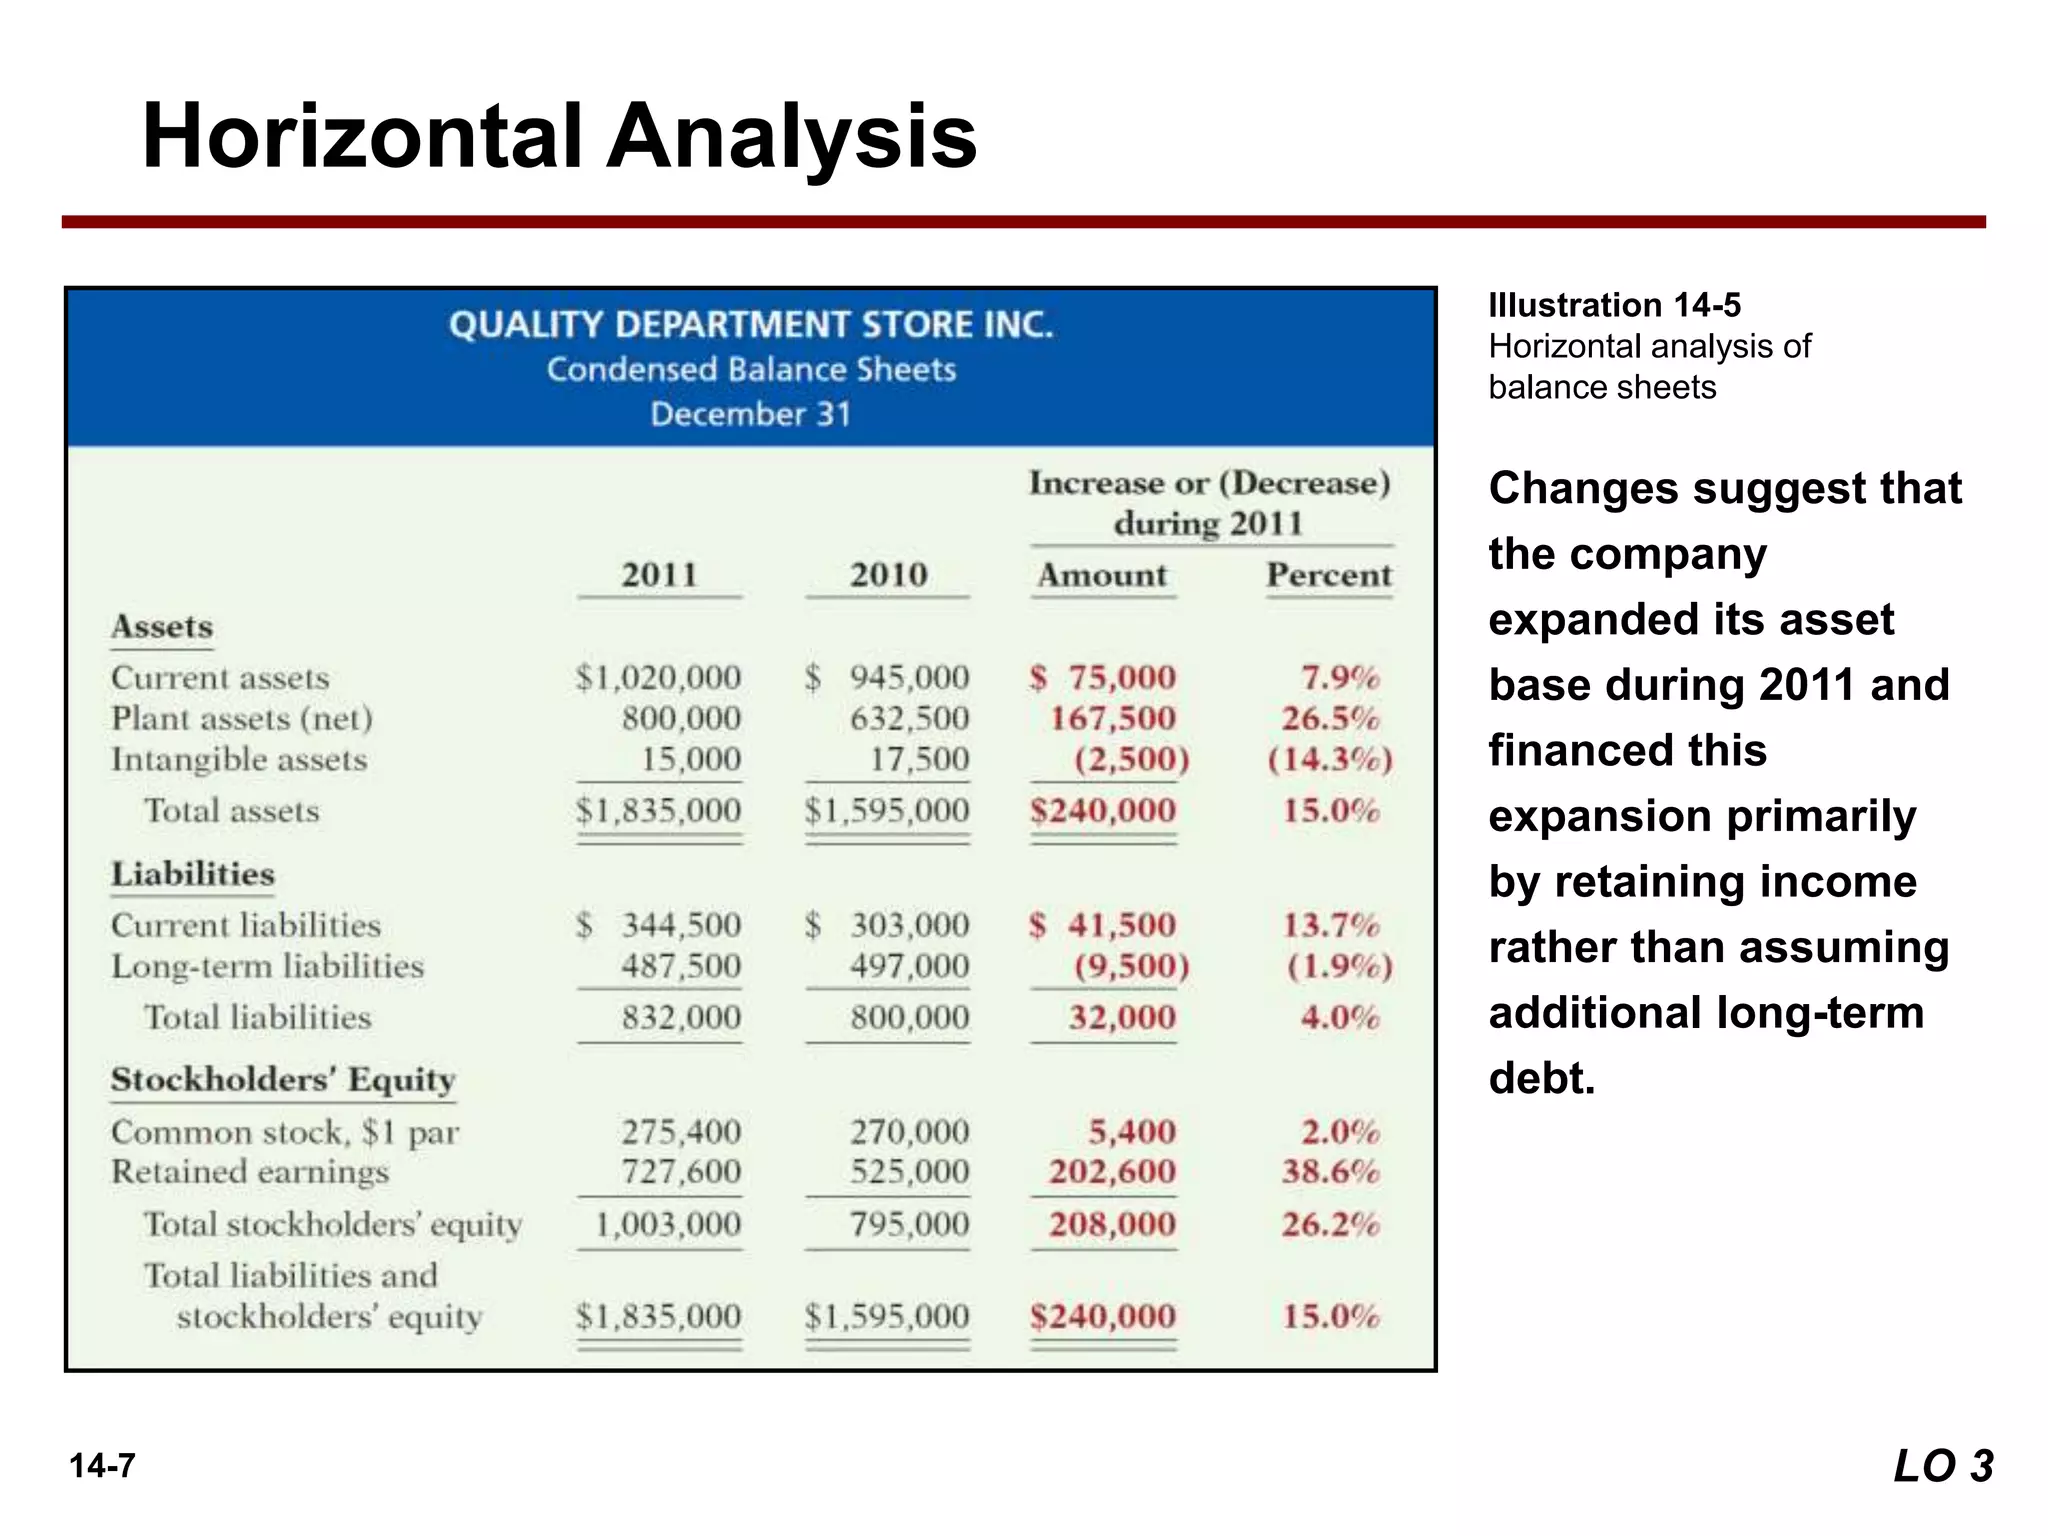
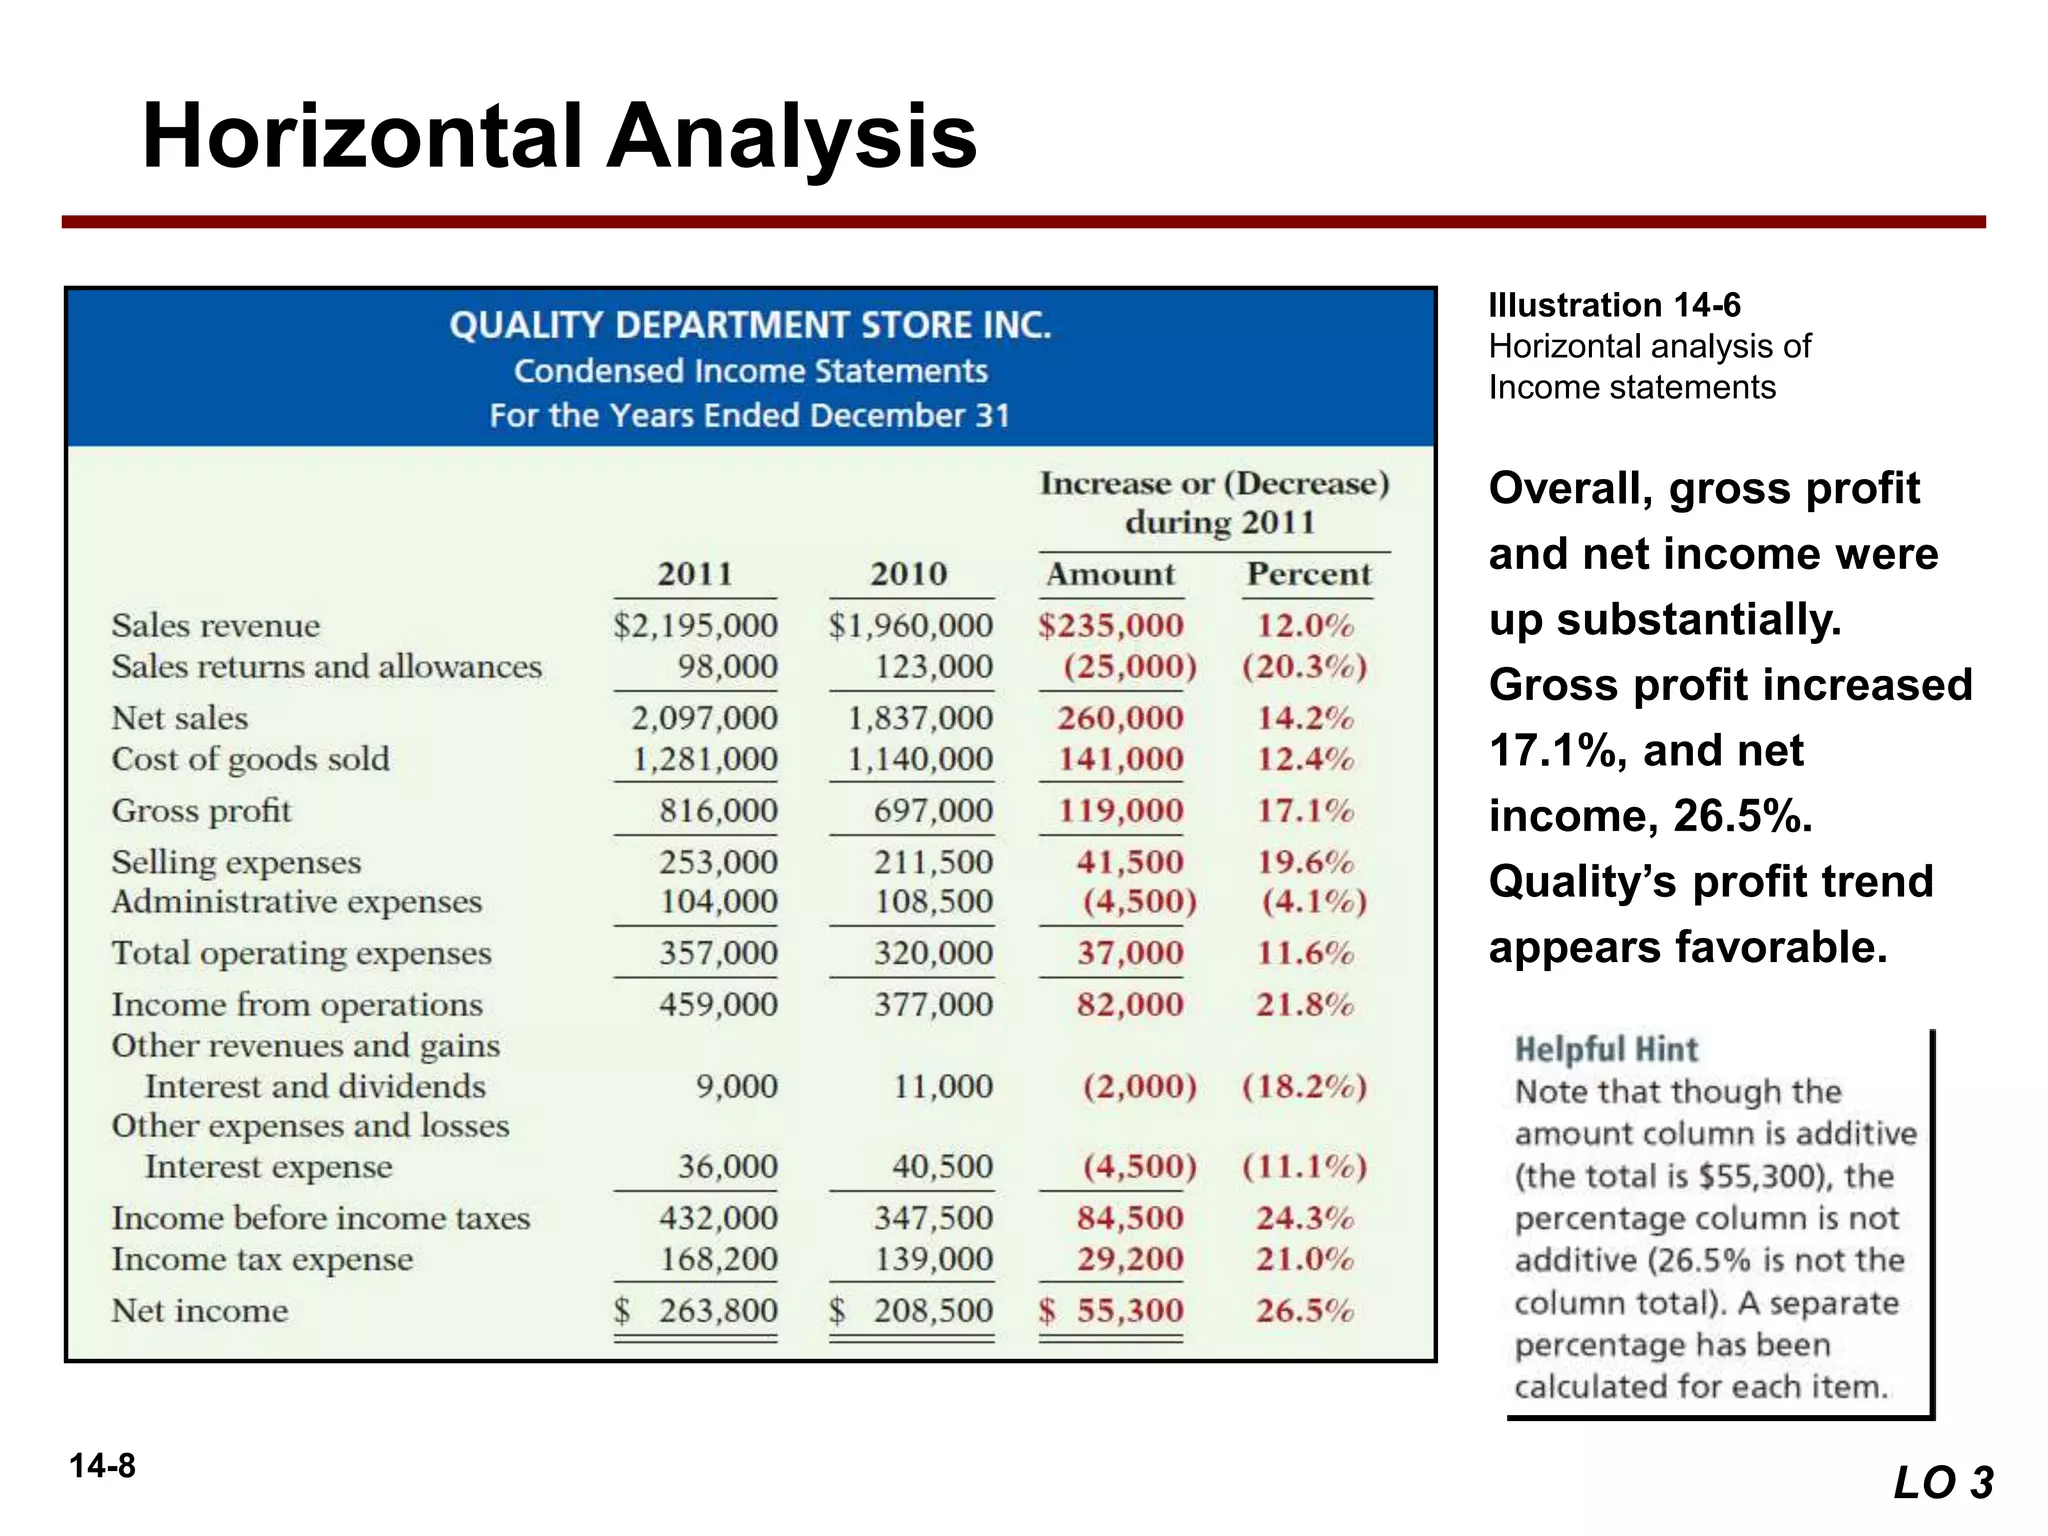
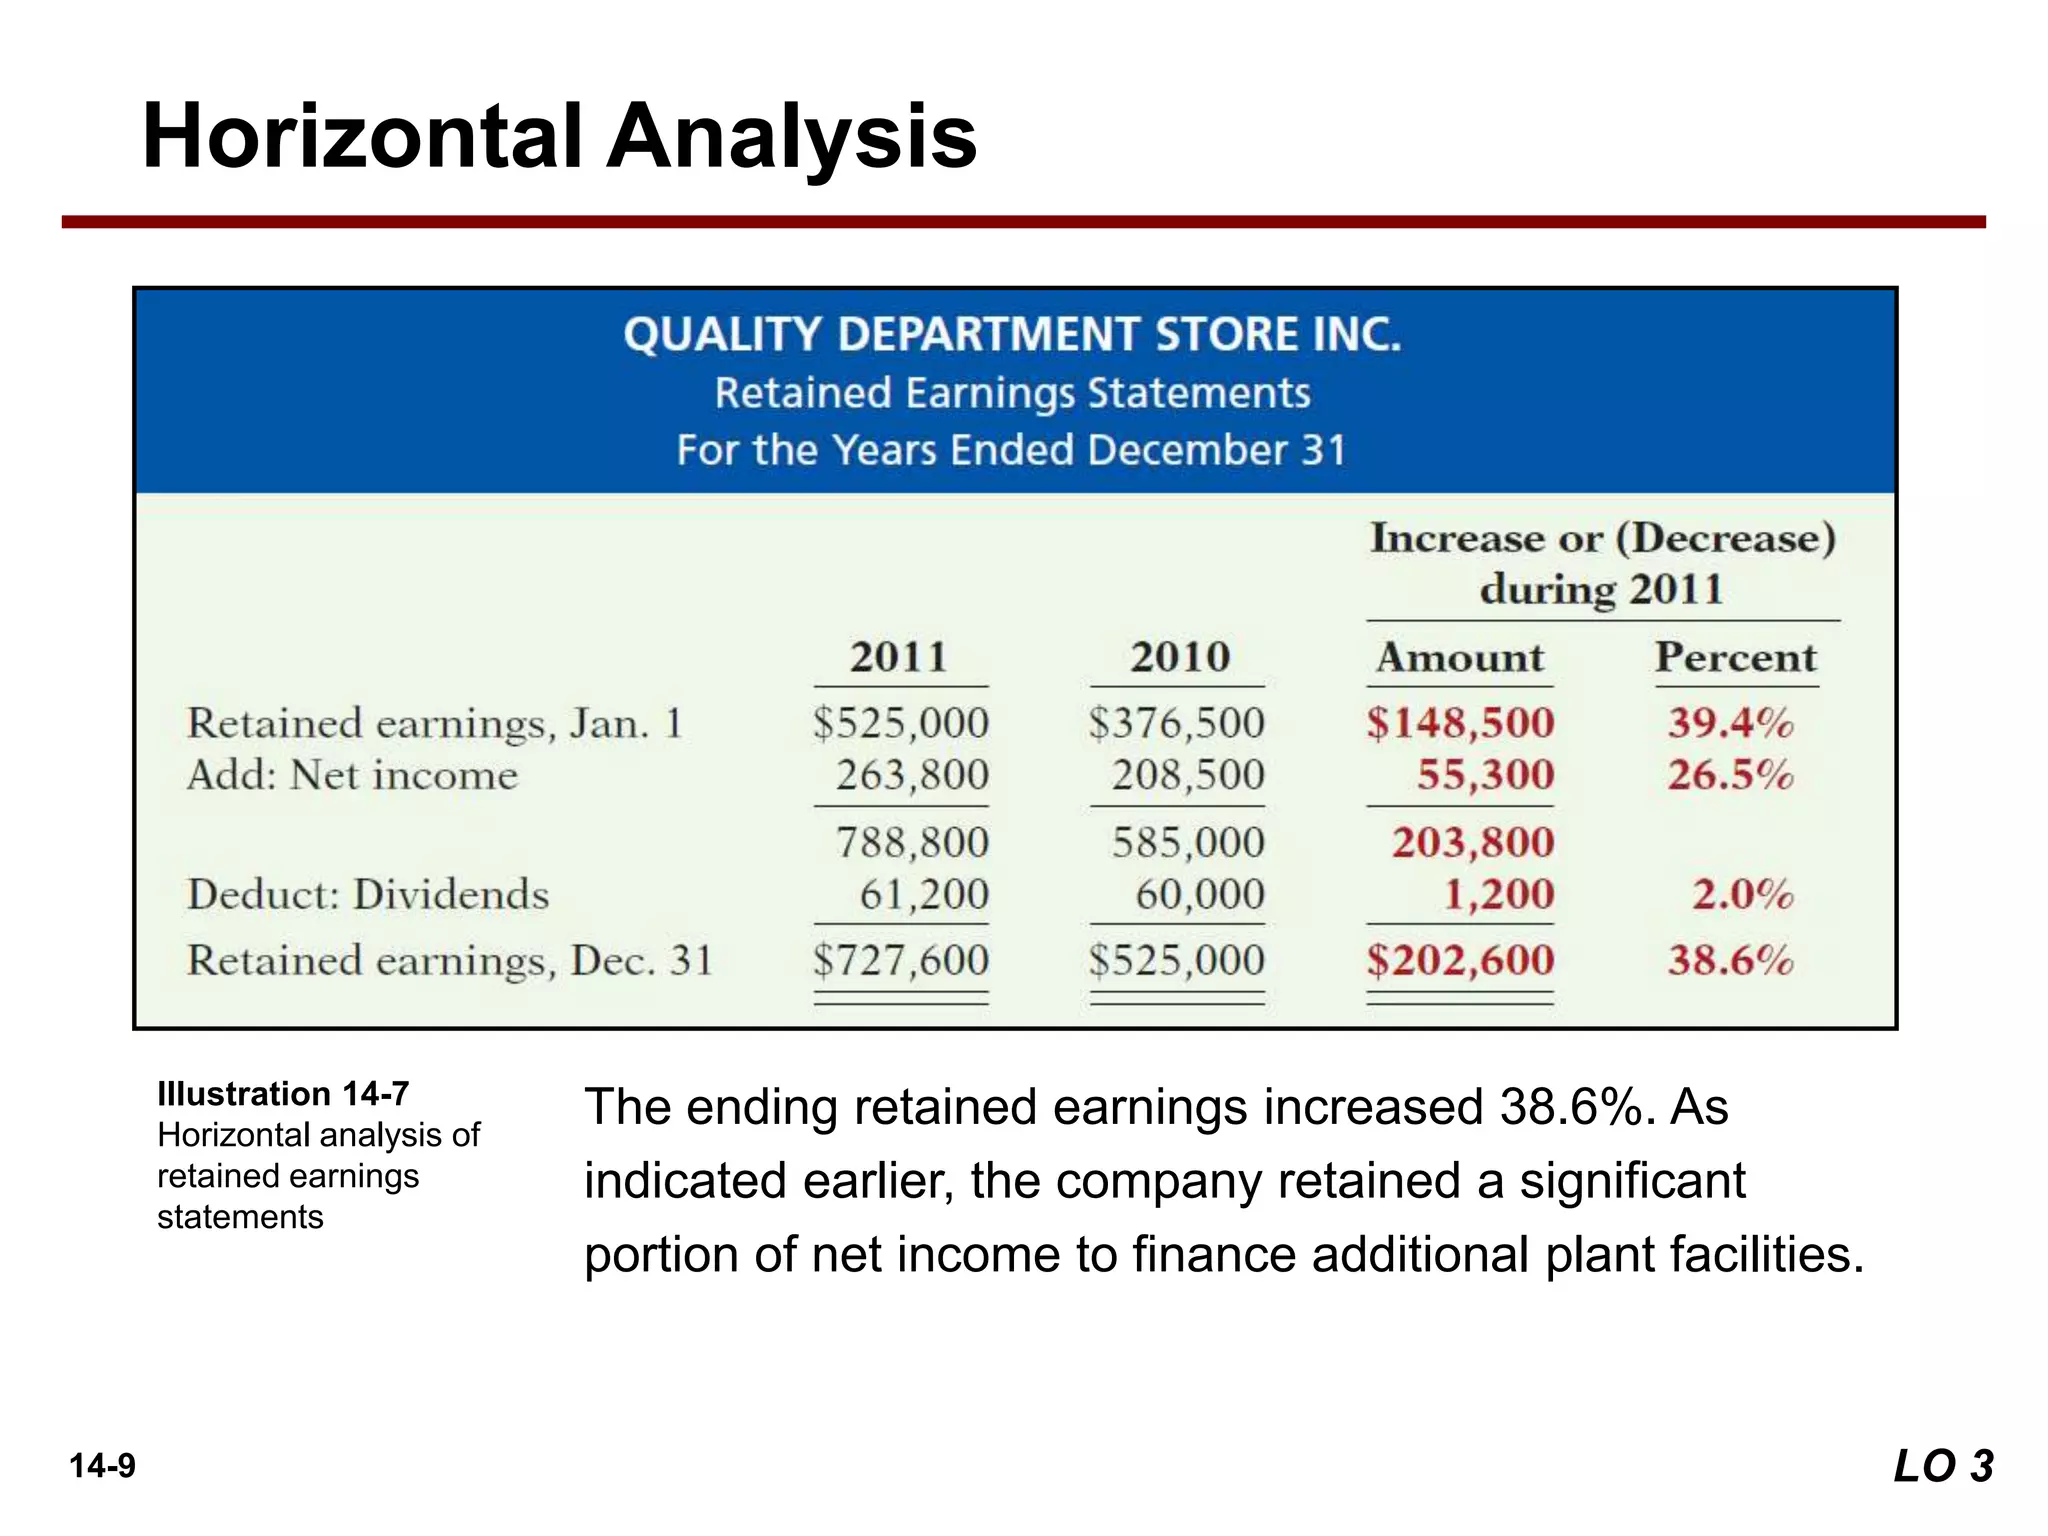
[3] Explain and apply horizontal analysis.
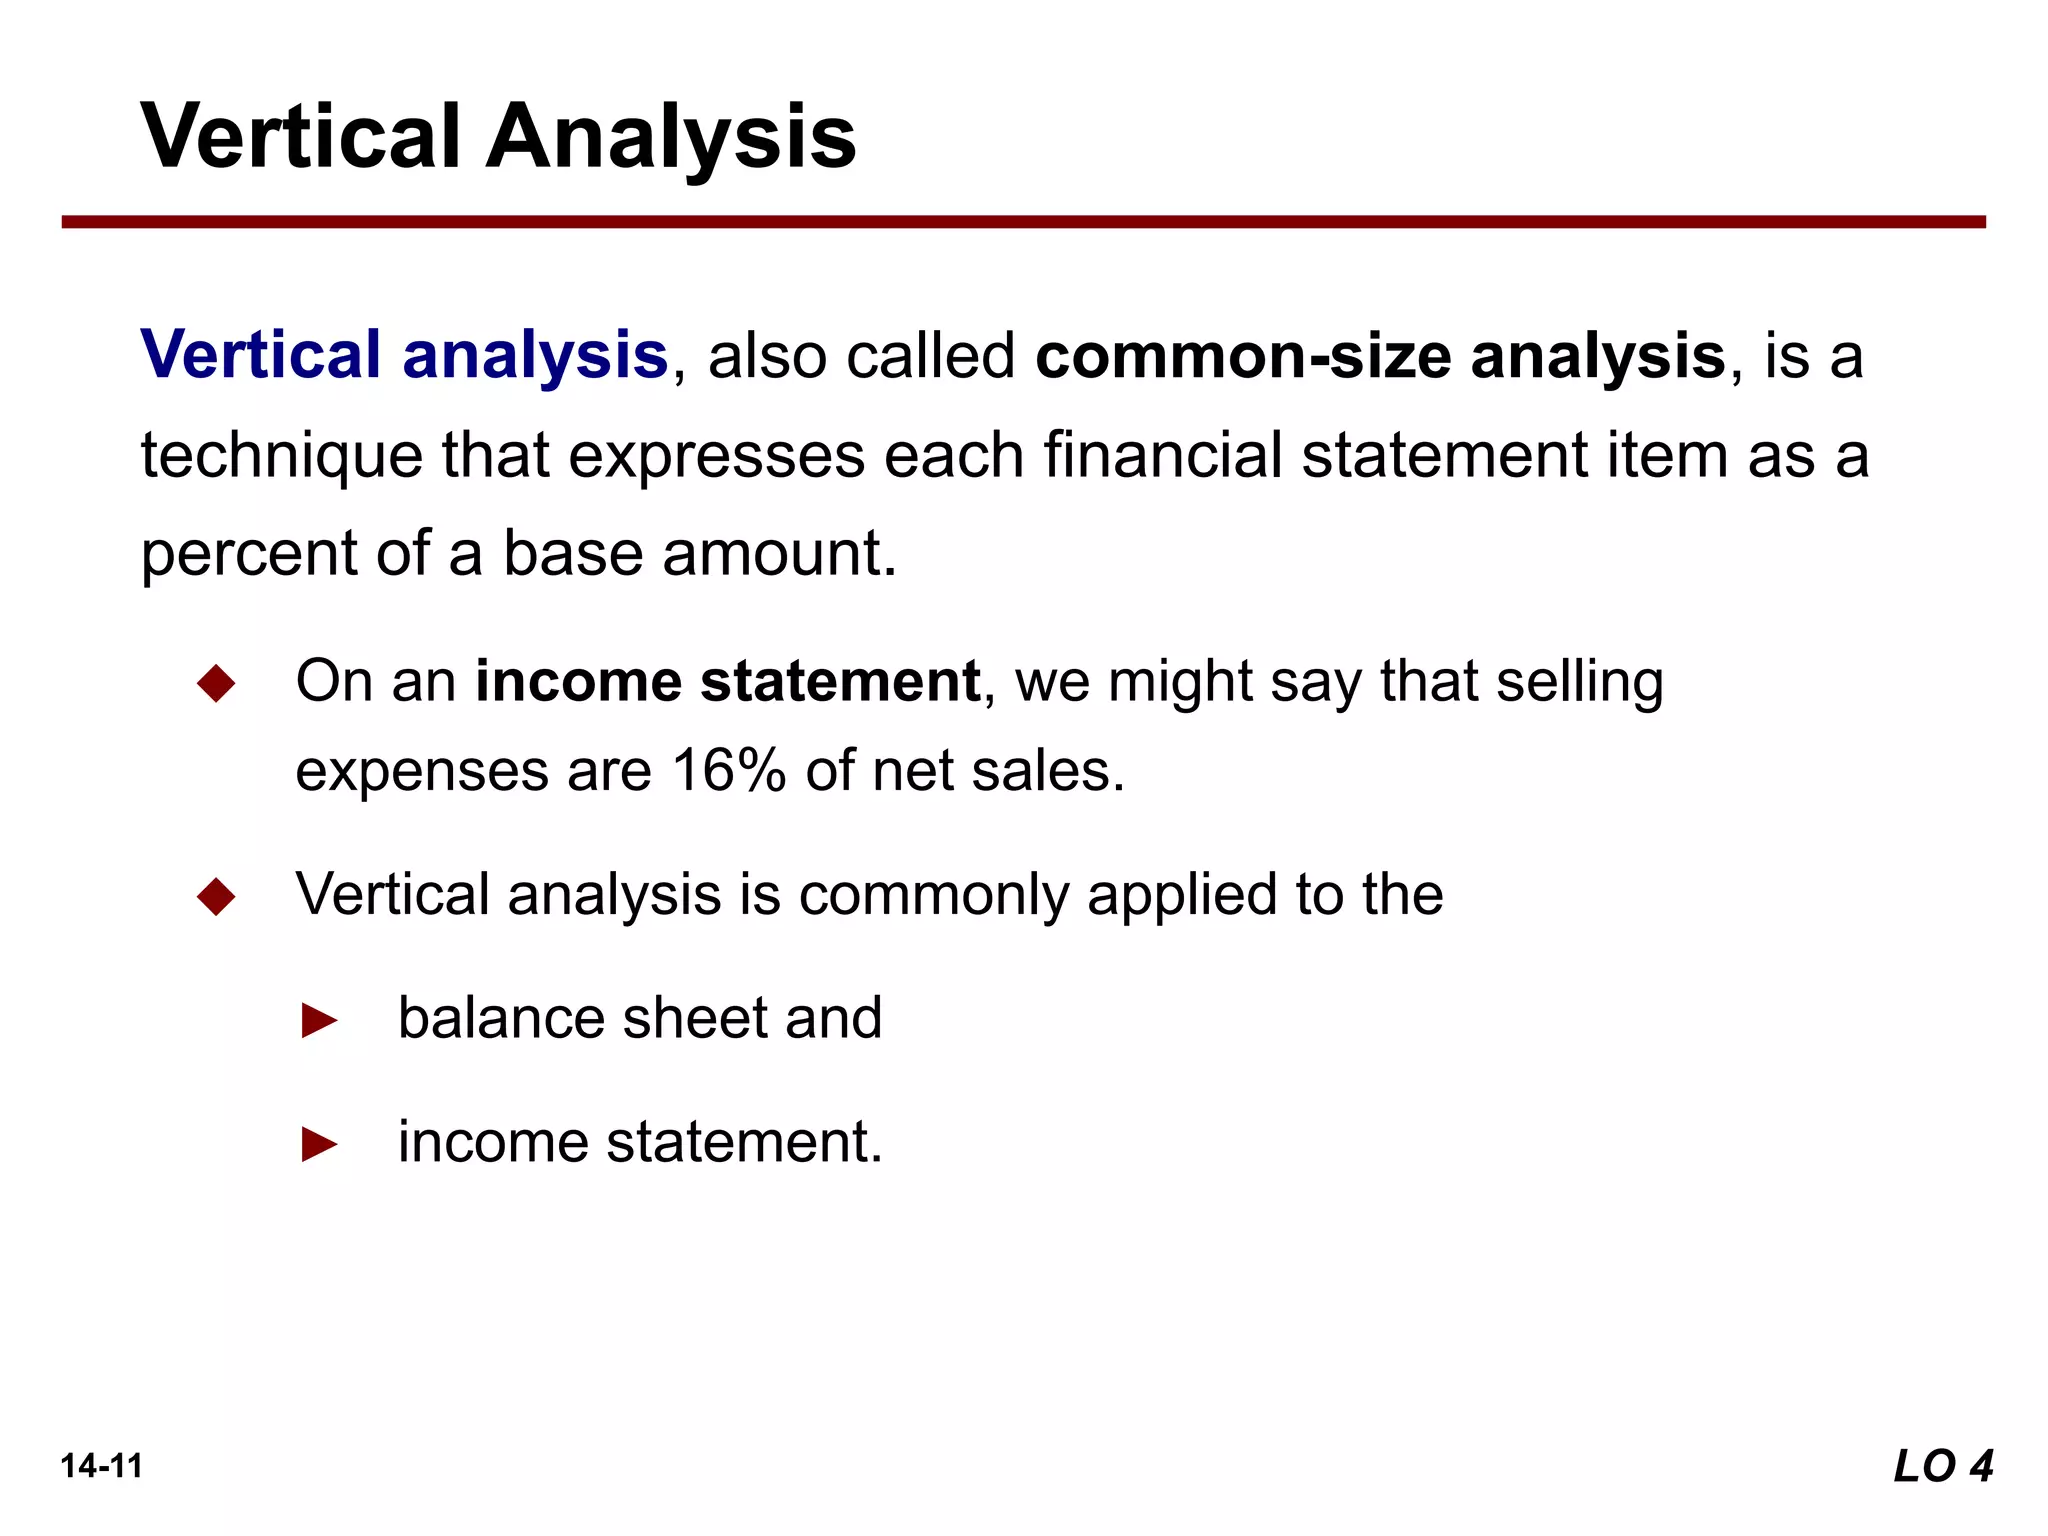
[4] Describe and apply vertical analysis.
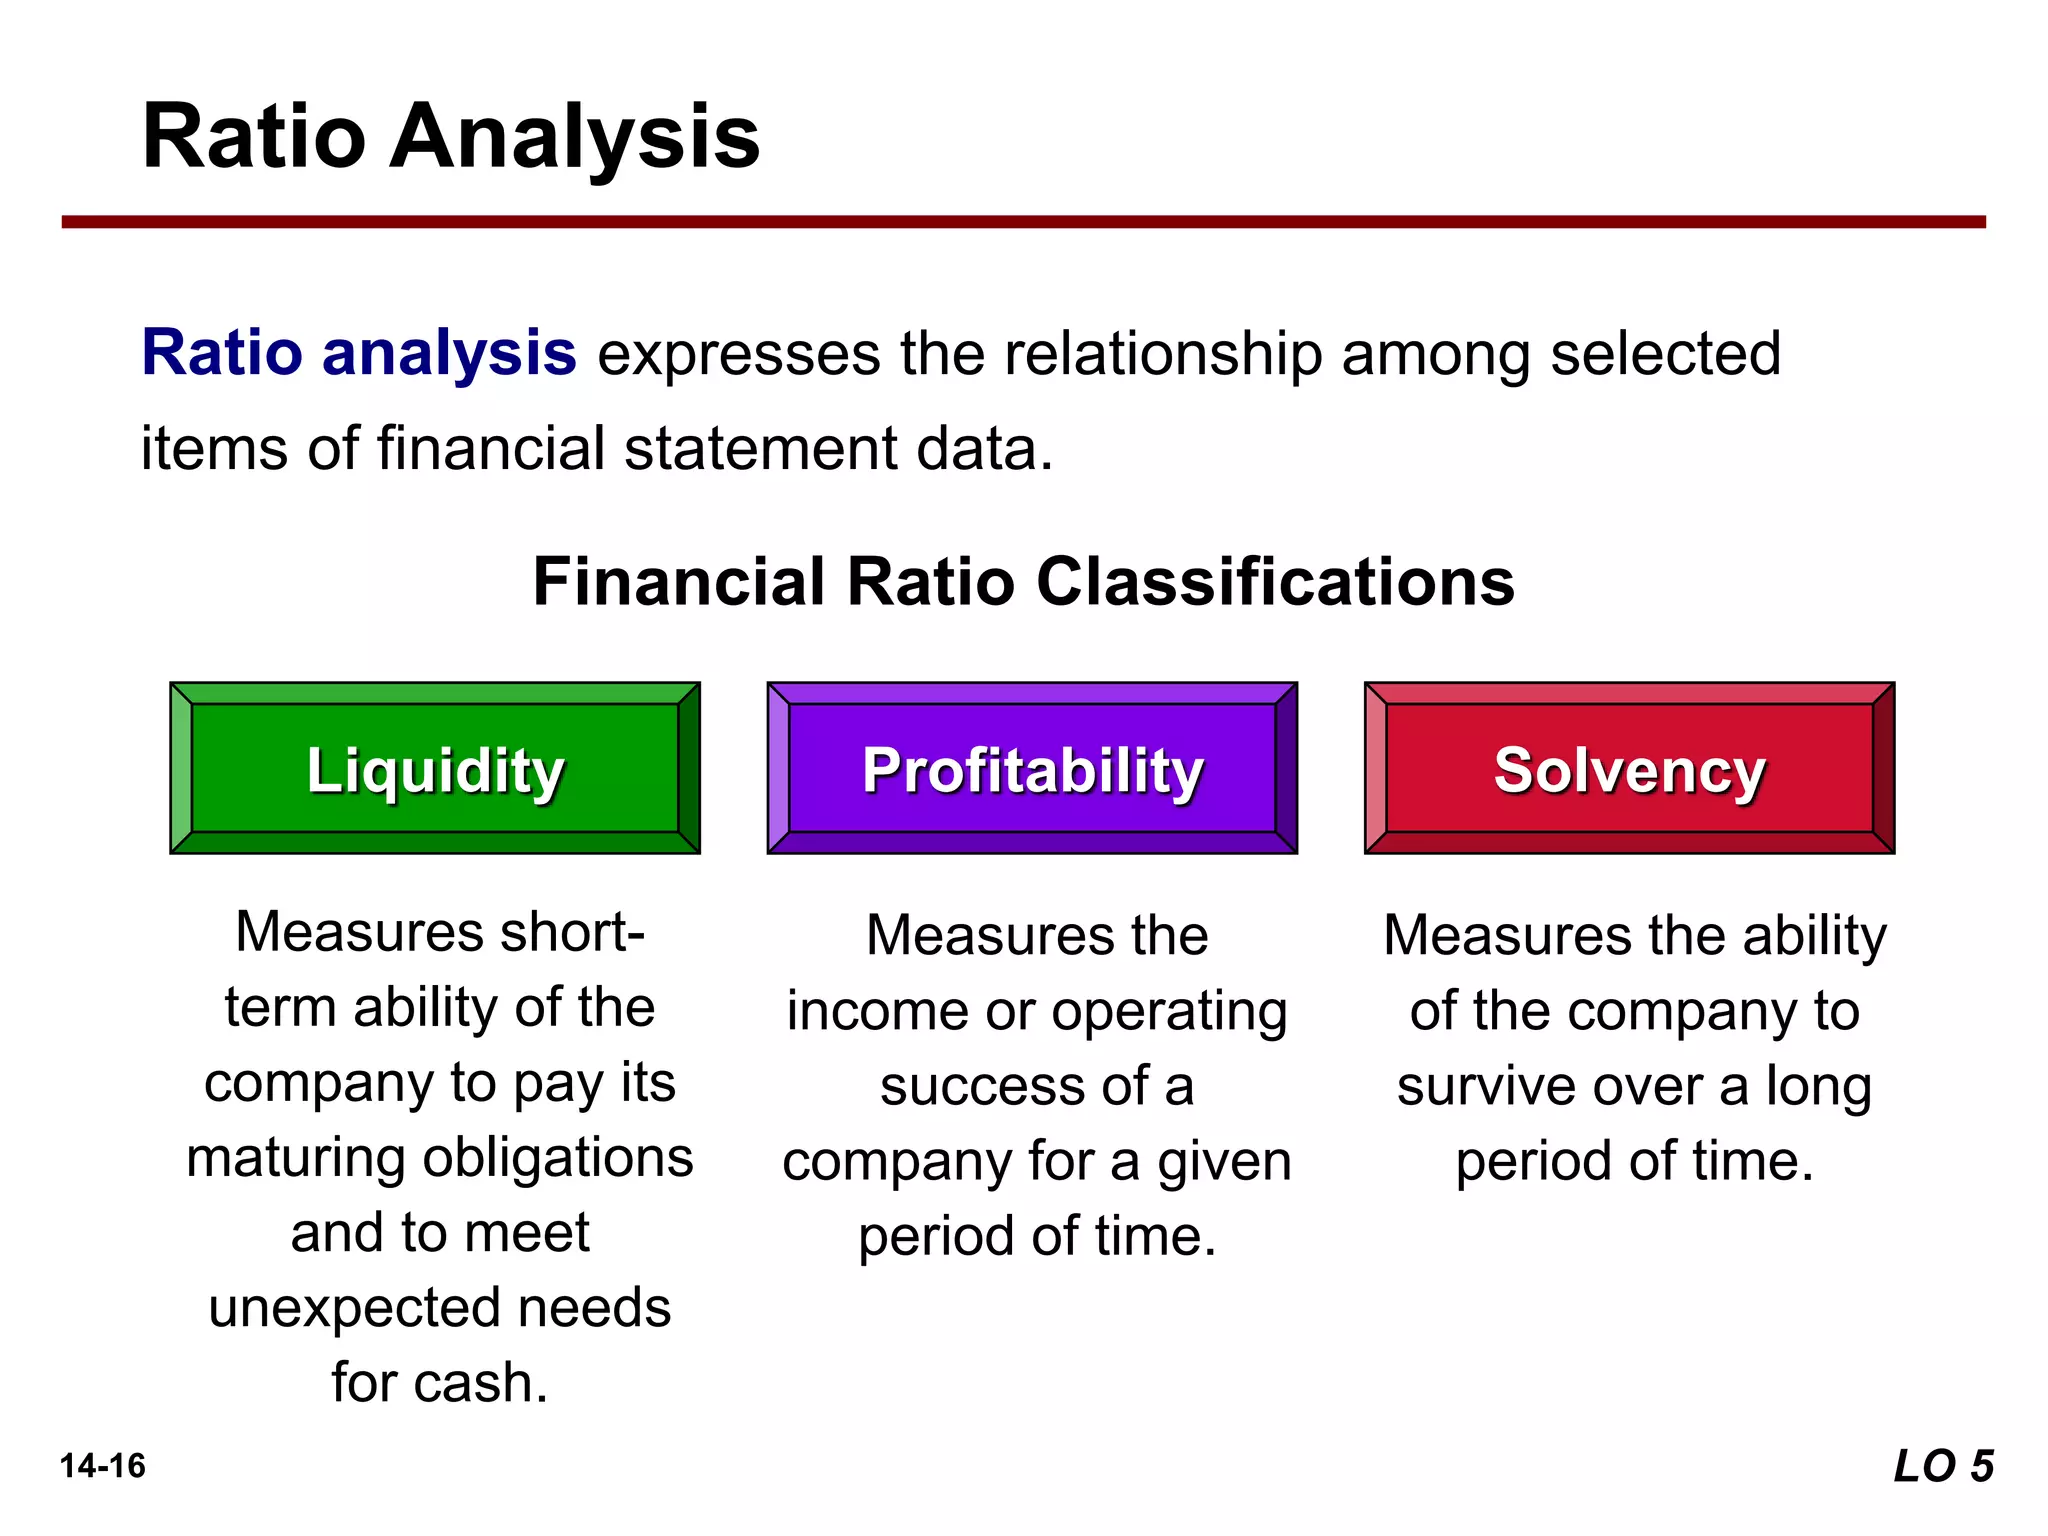
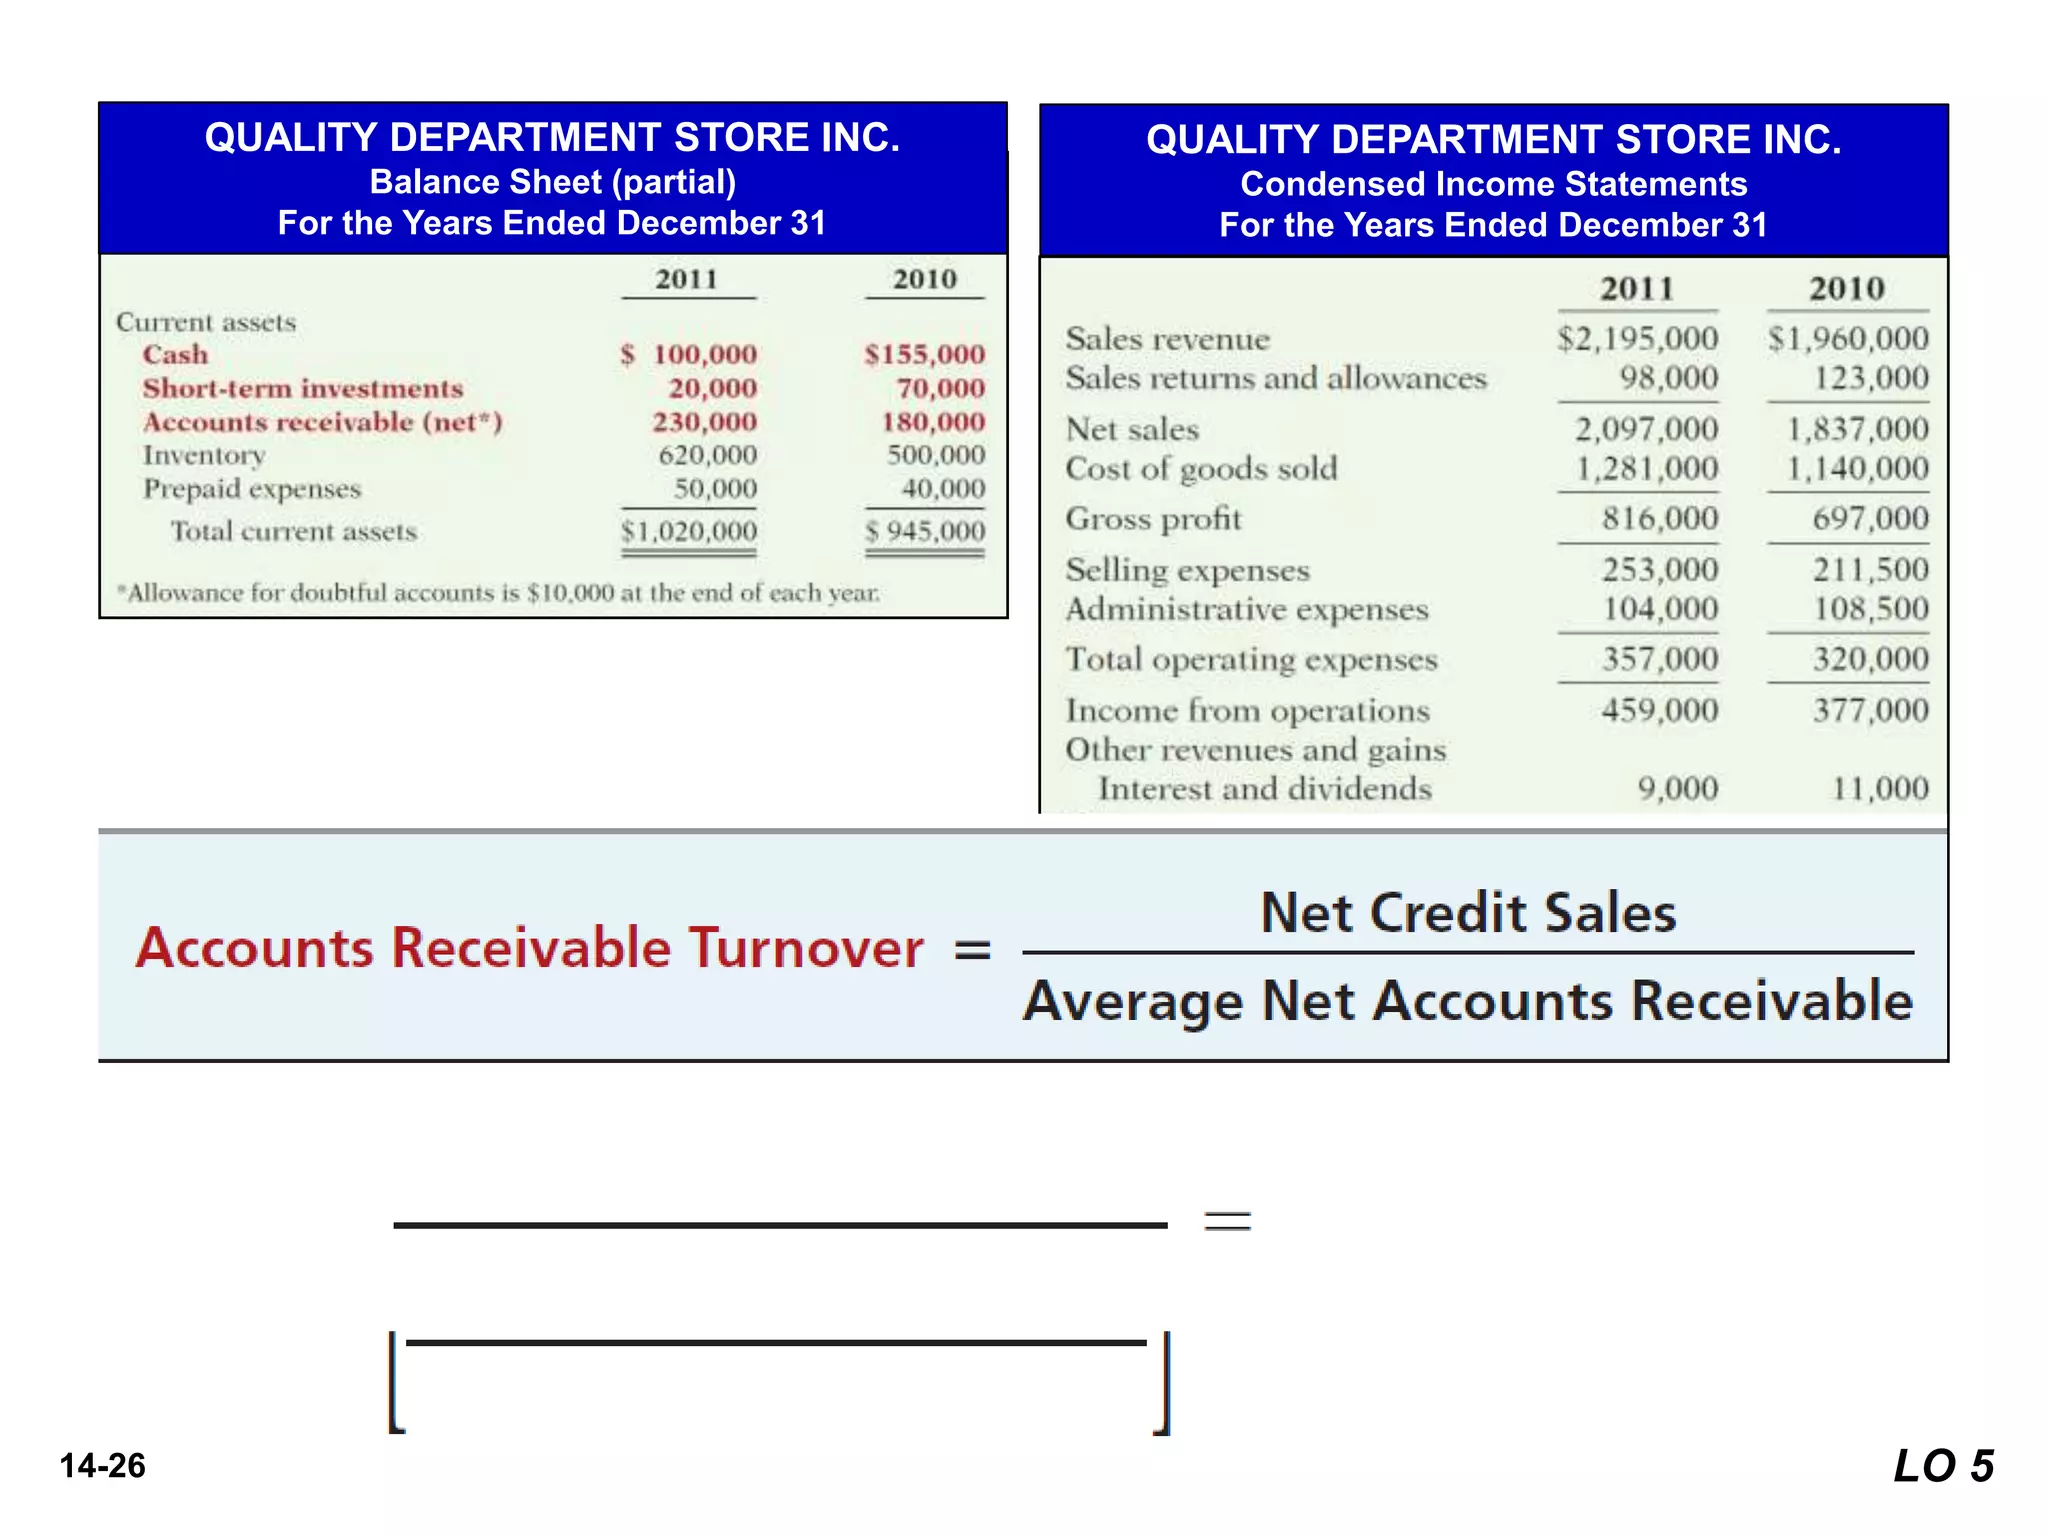
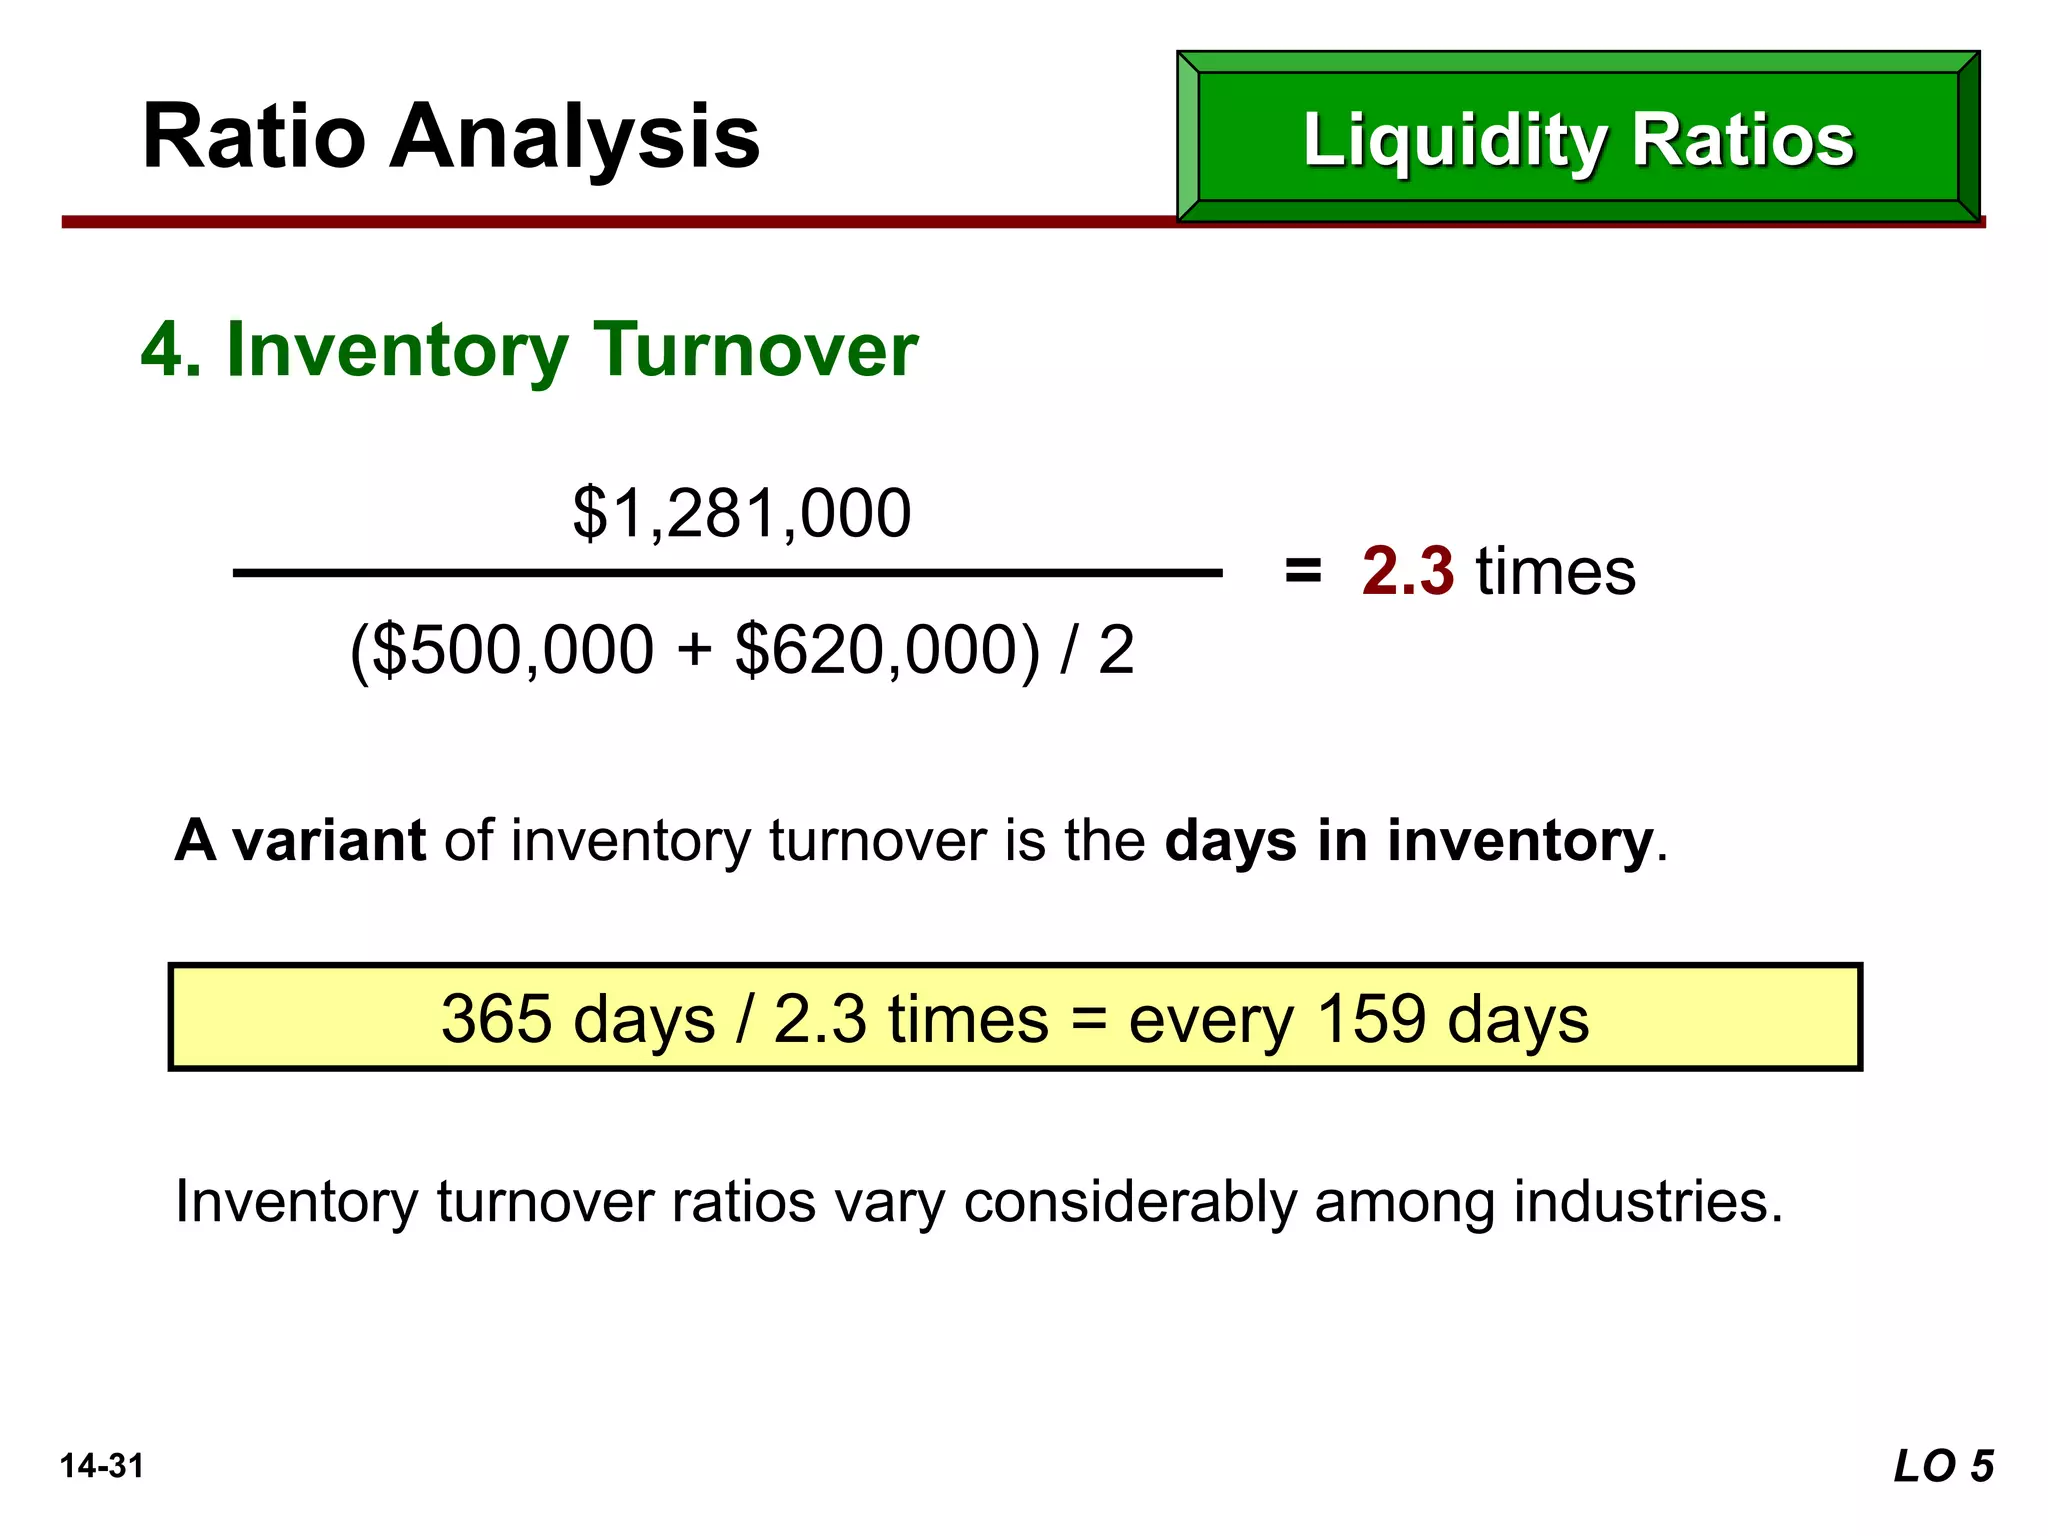
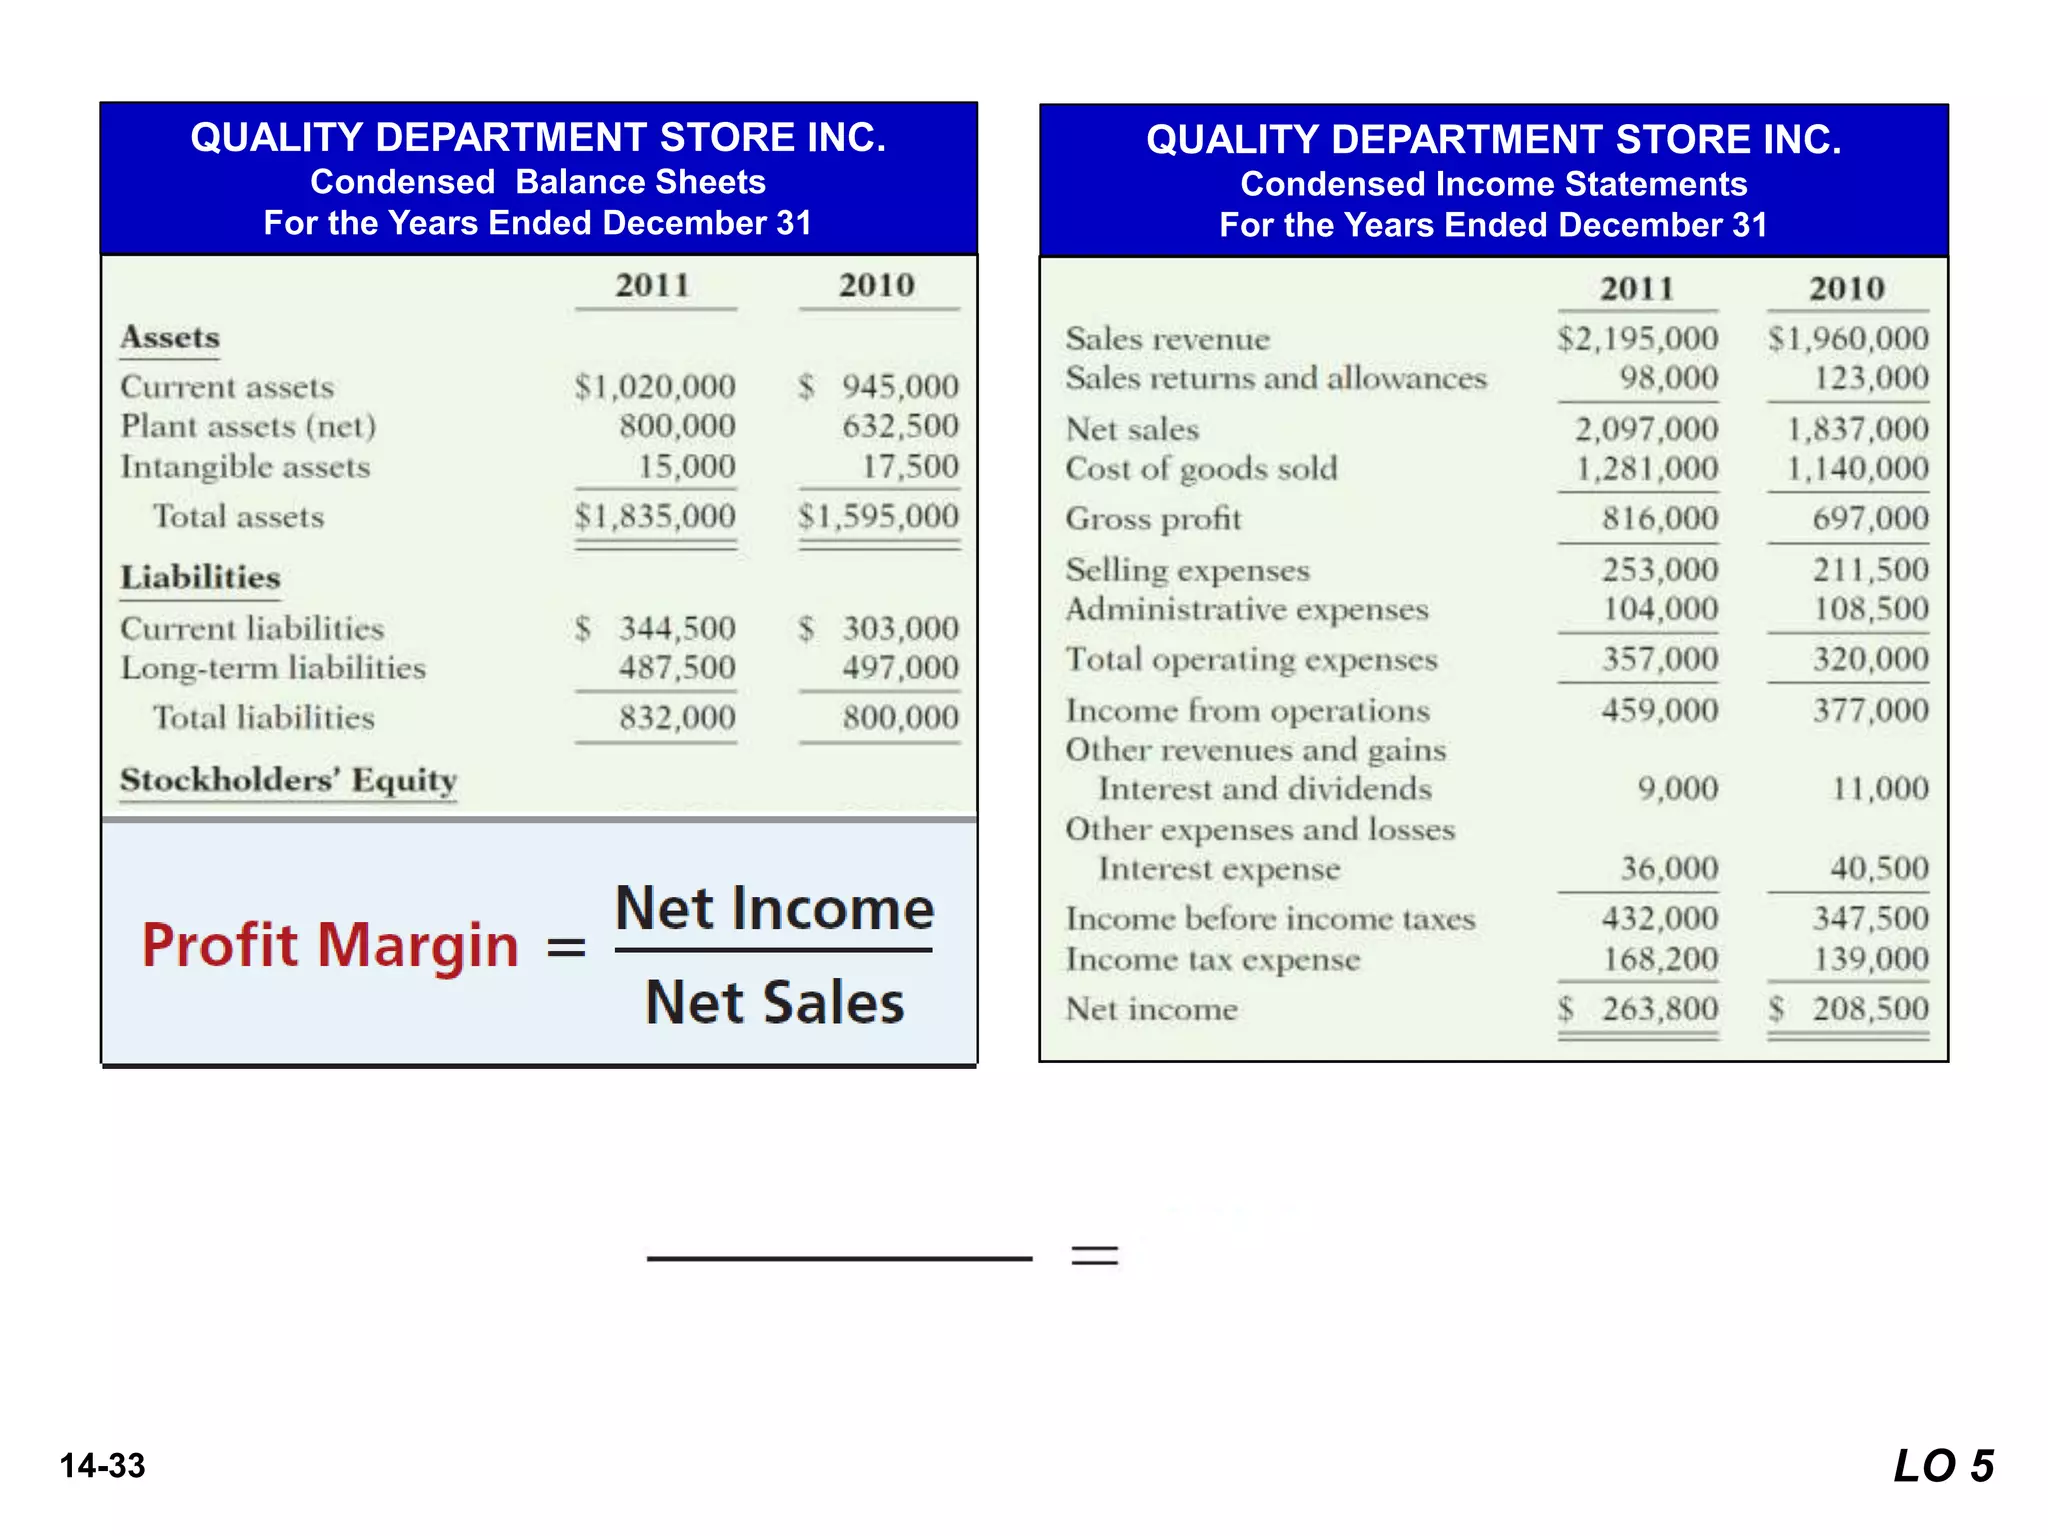
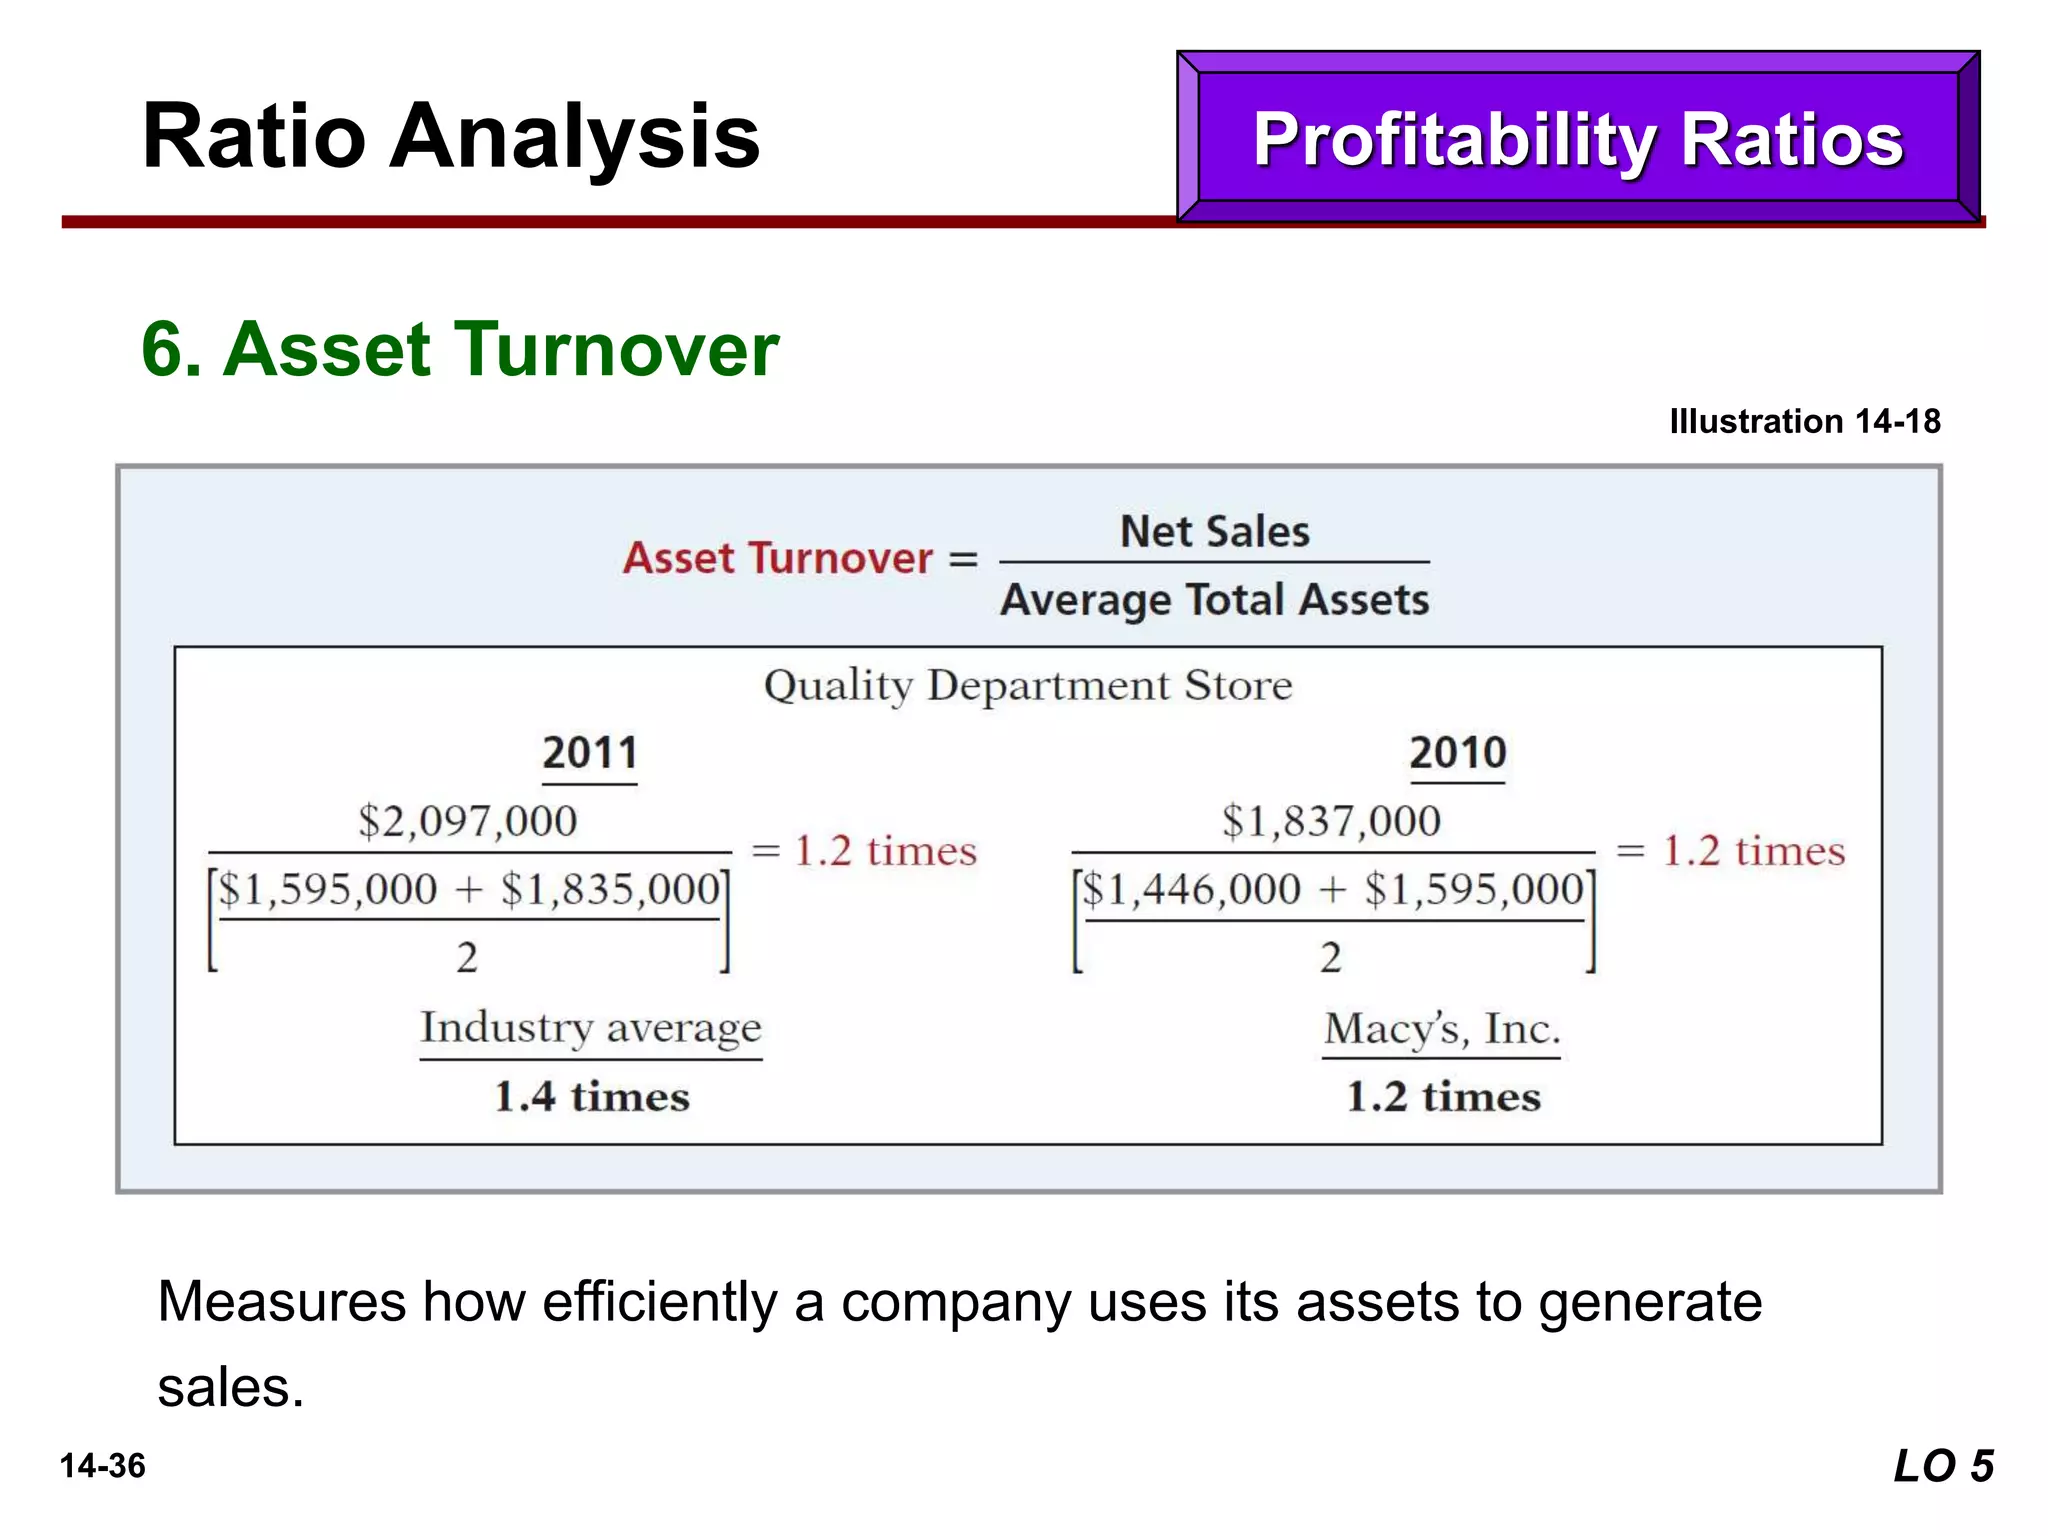
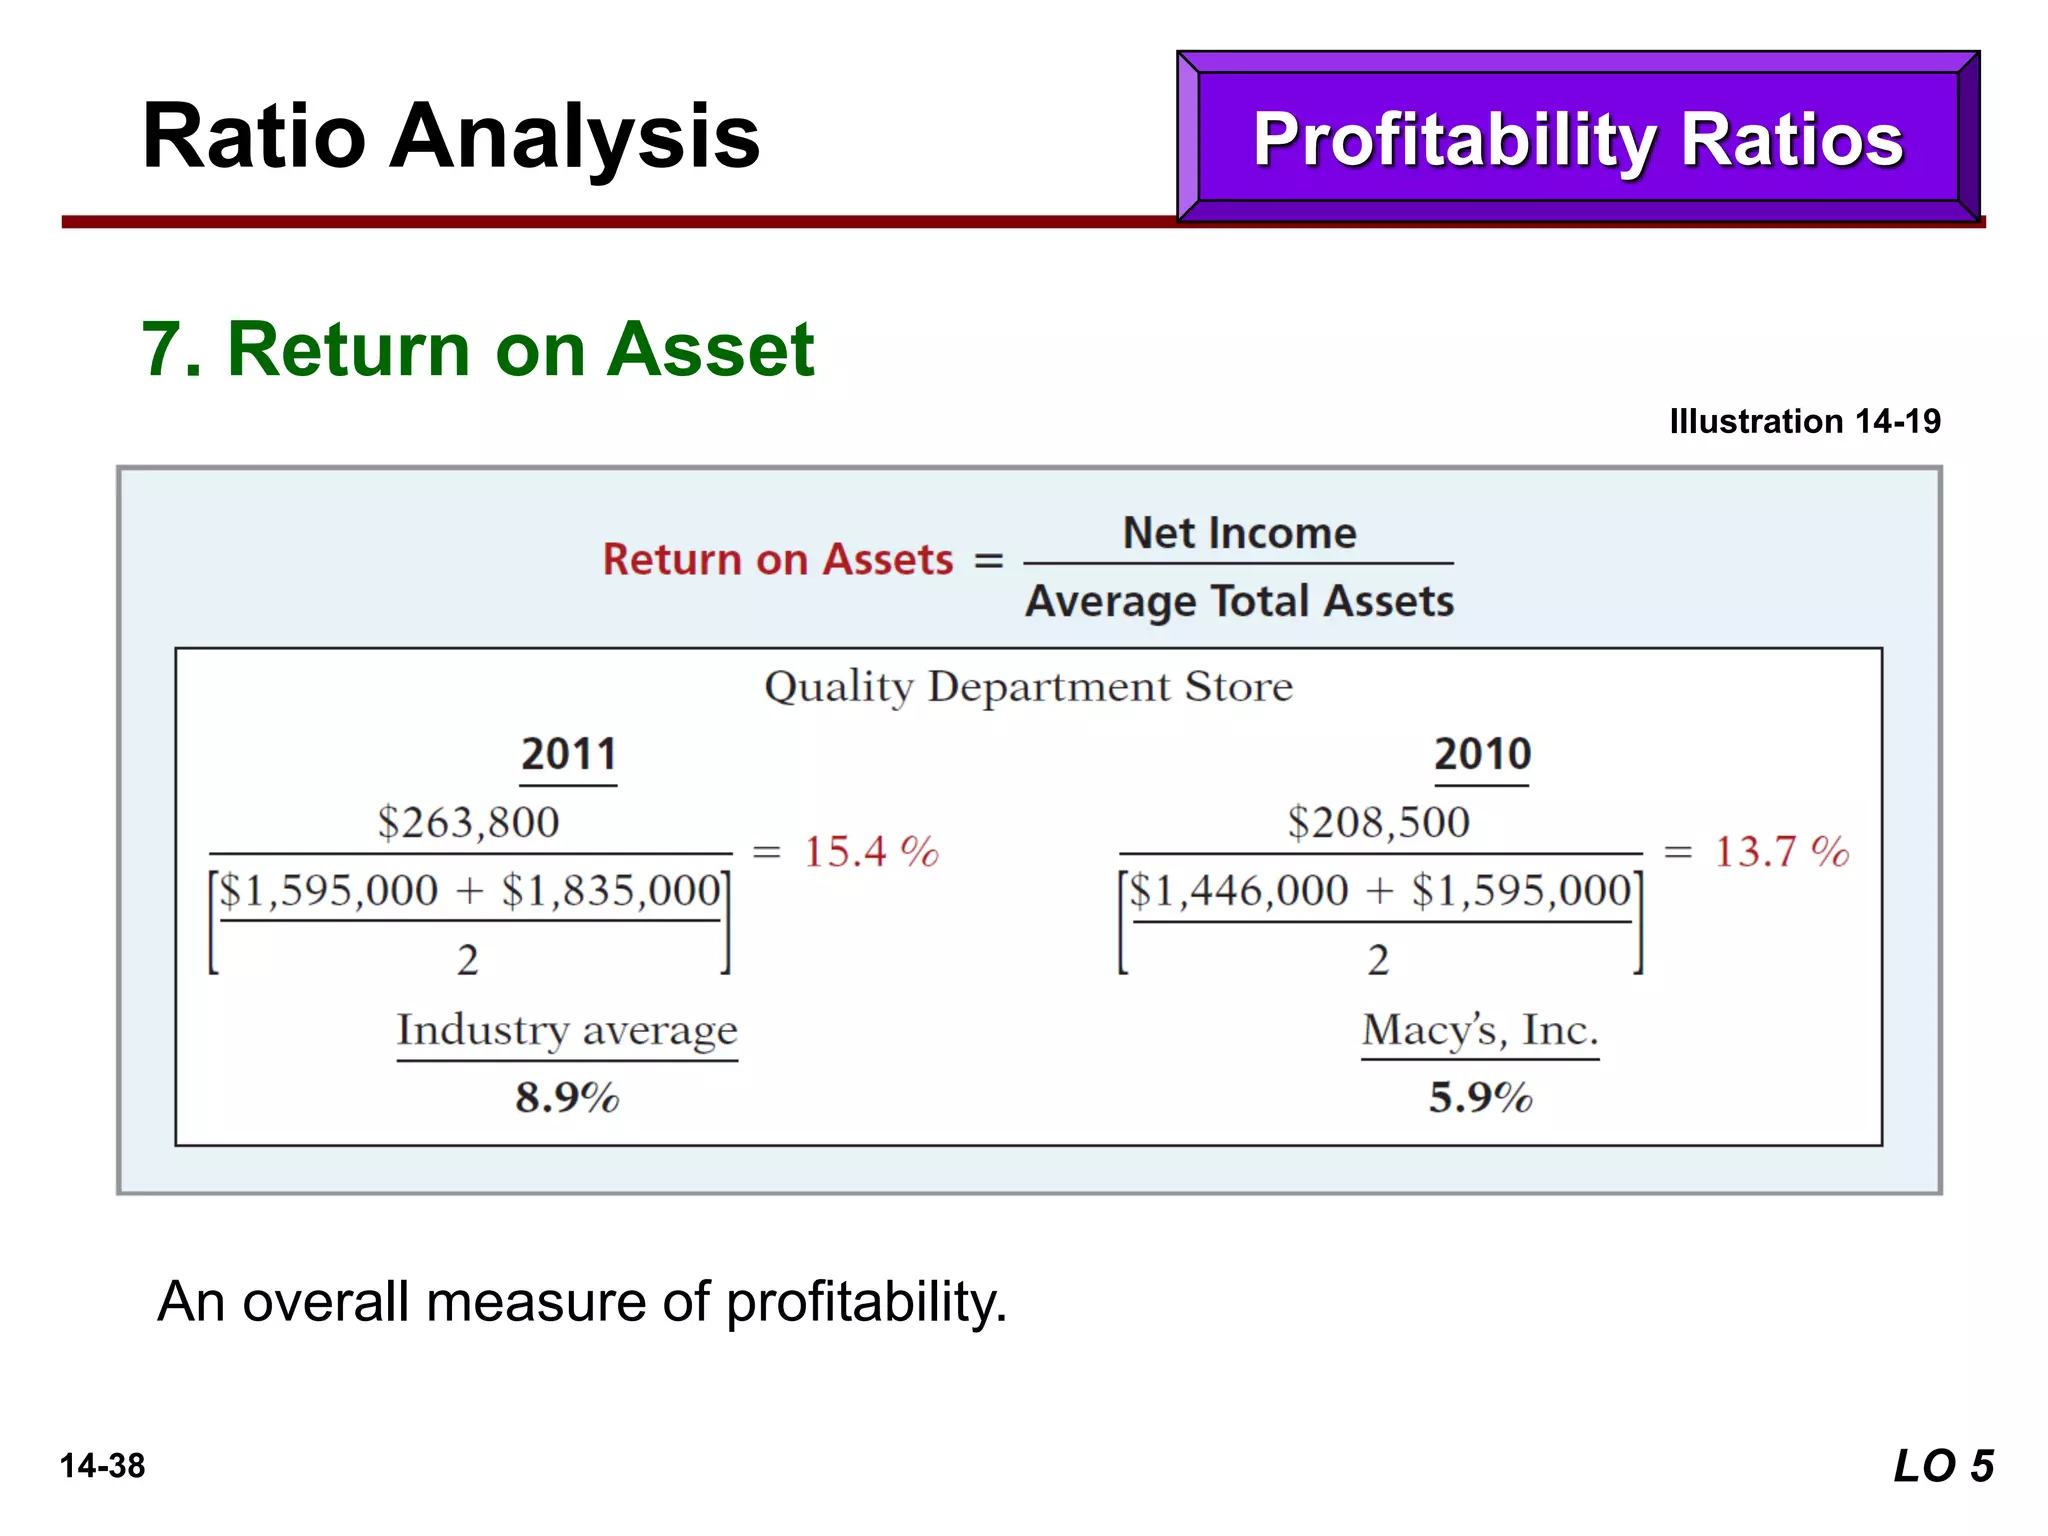
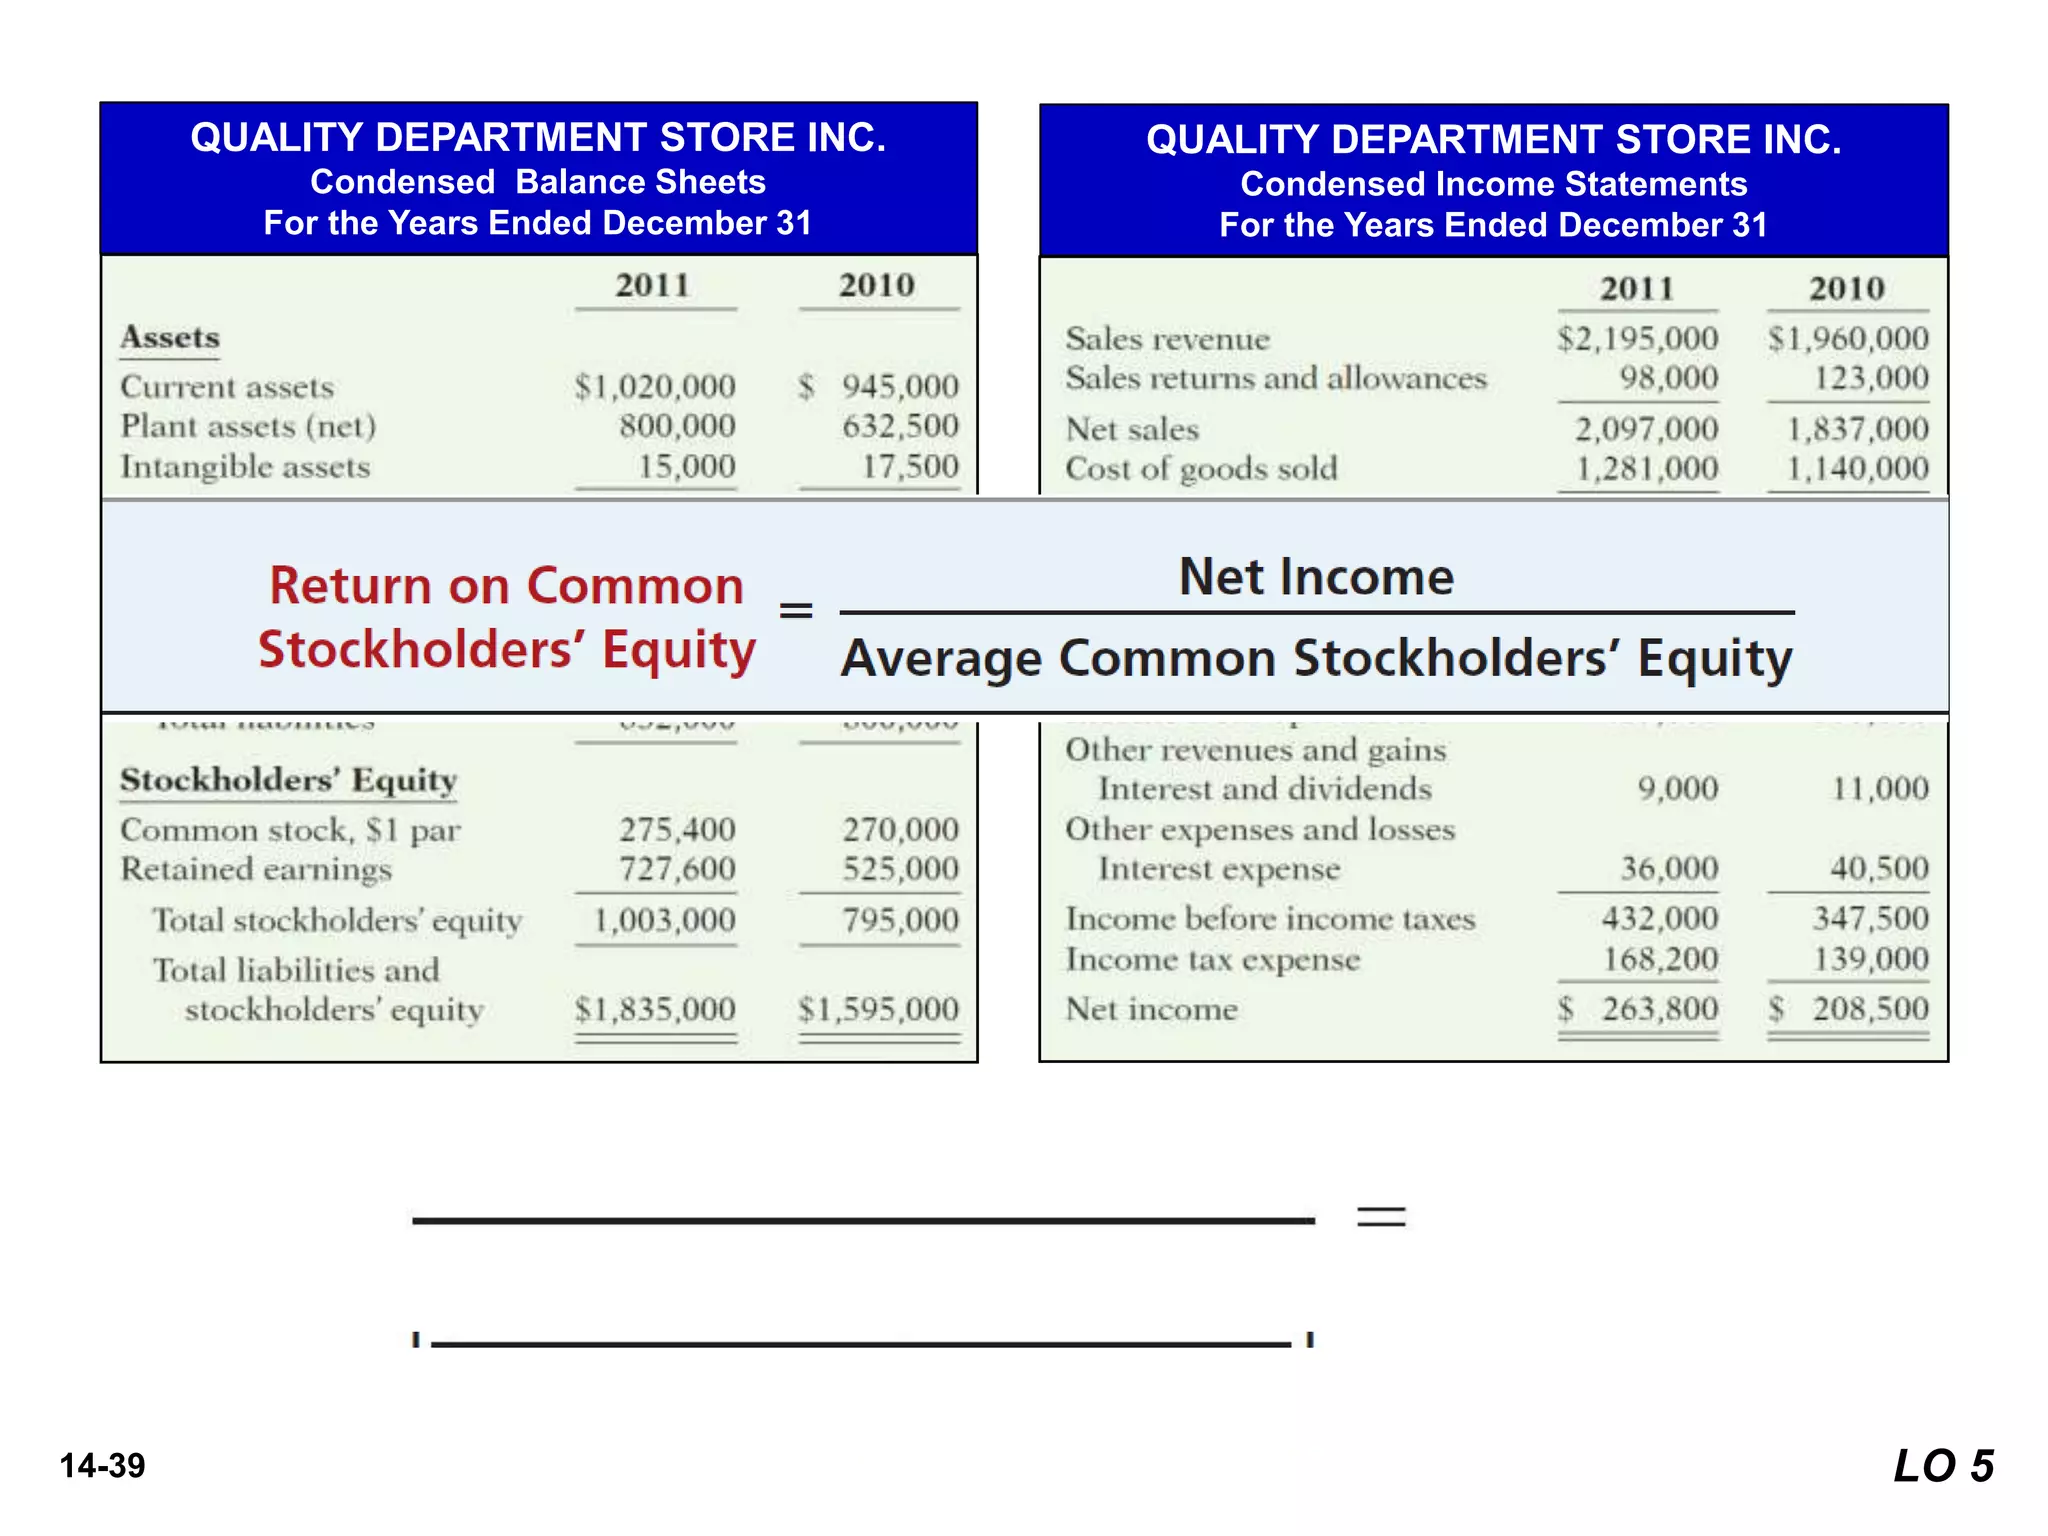
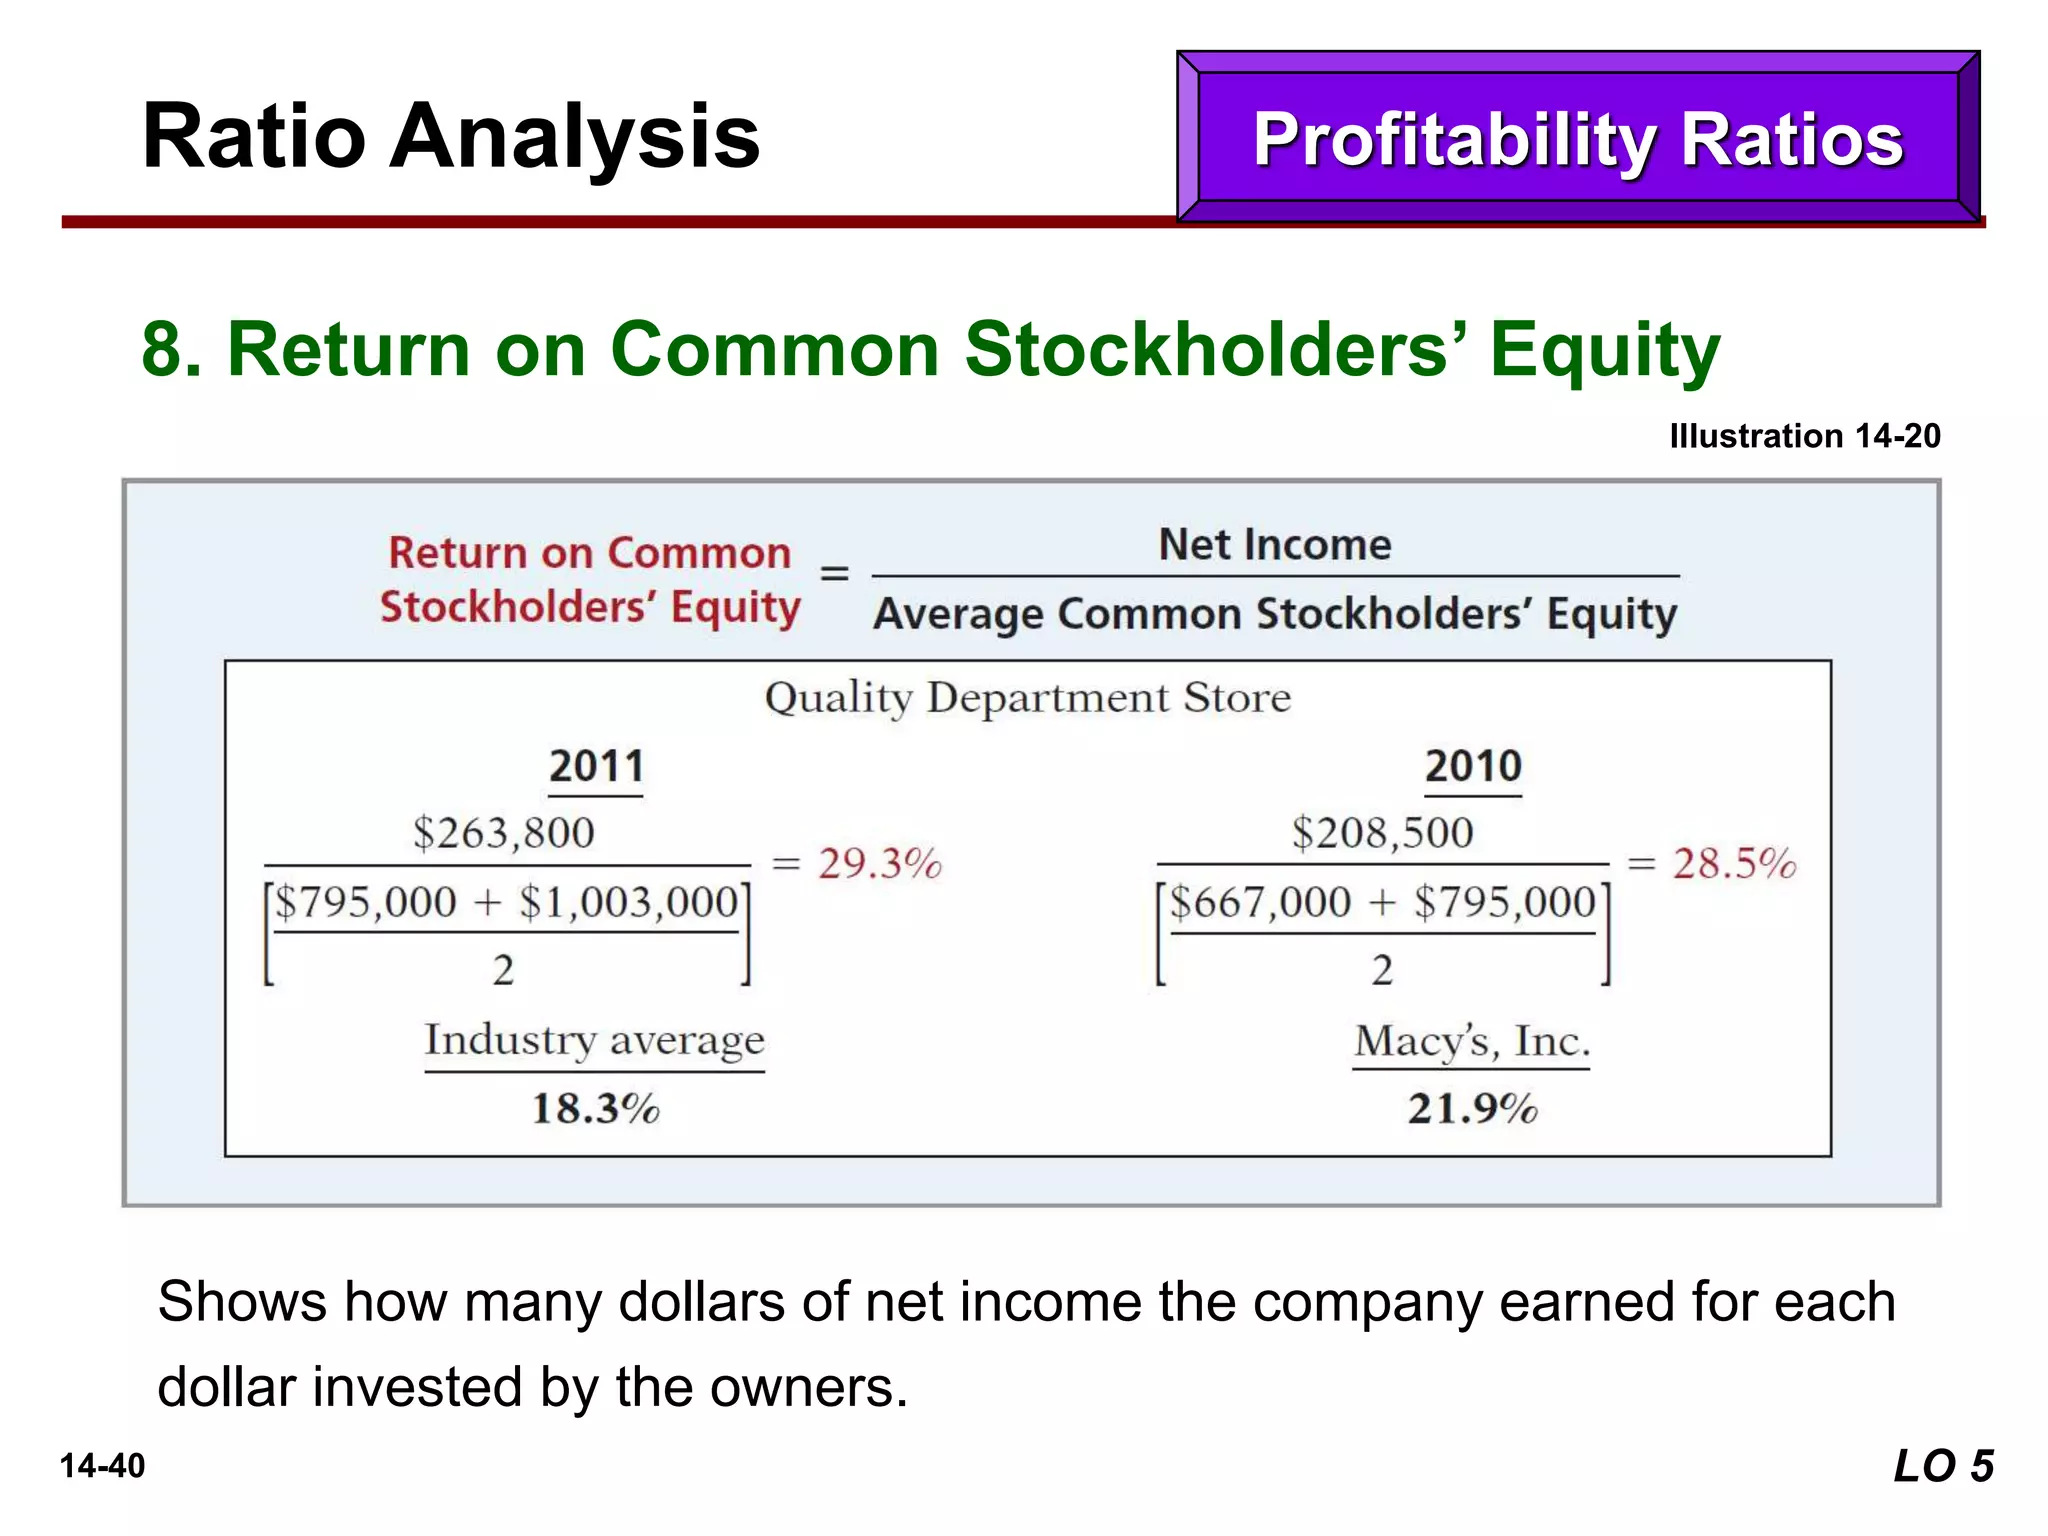
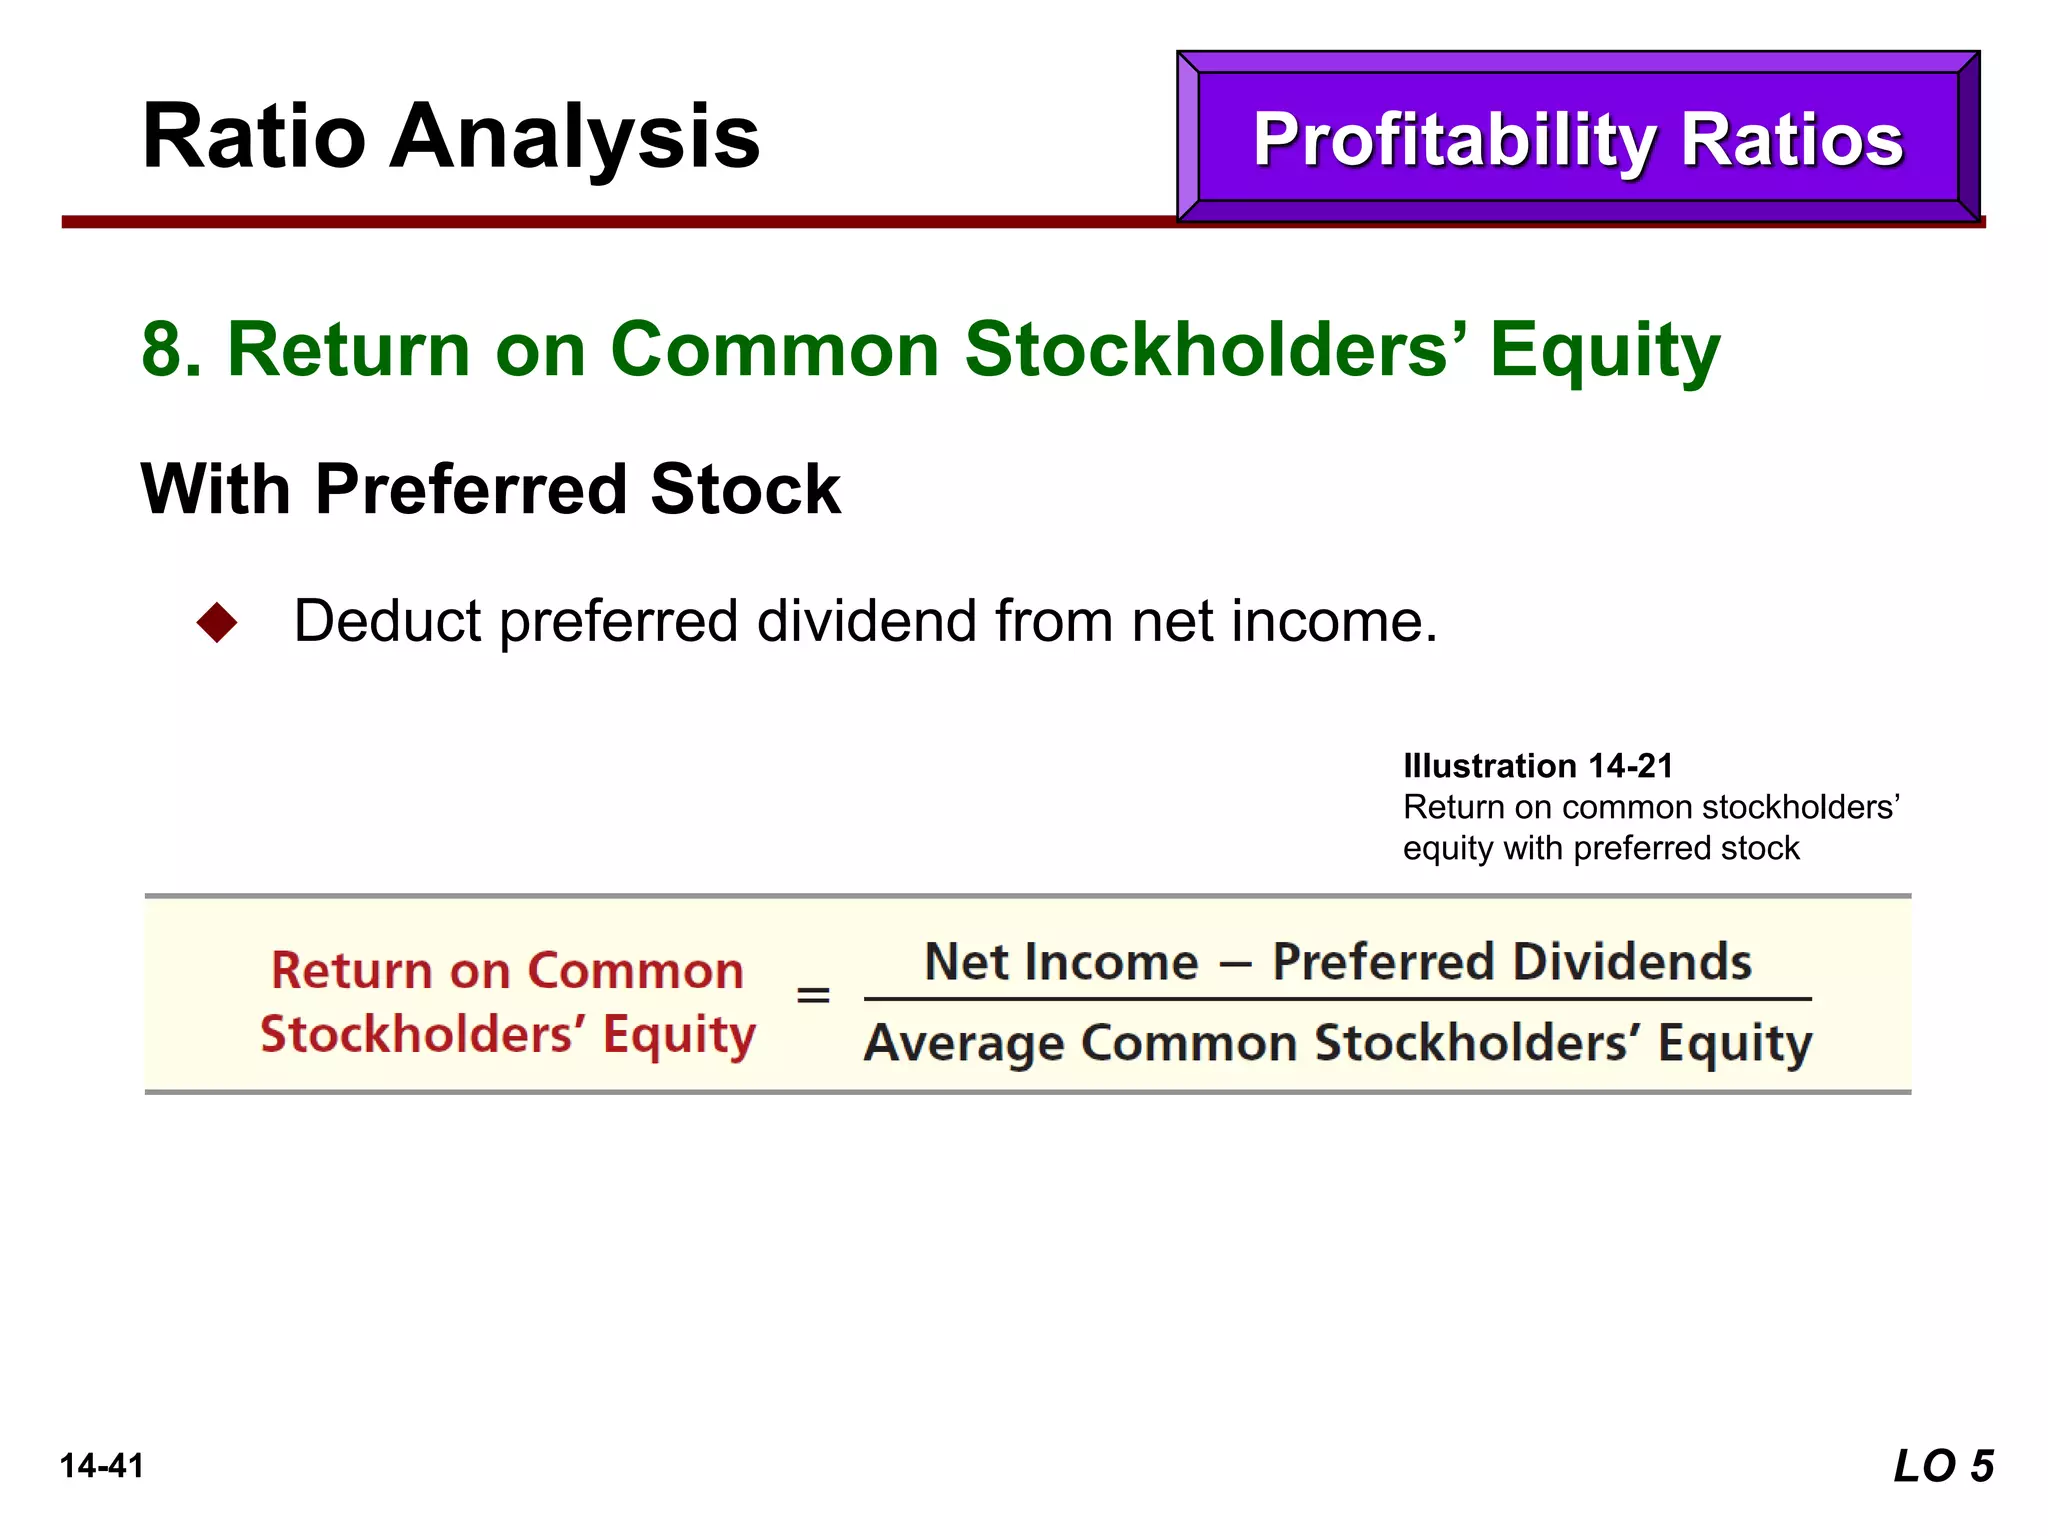
[5] Identify and compute ratios used in analyzing a firm’s liquidity,
profitability, and solvency.
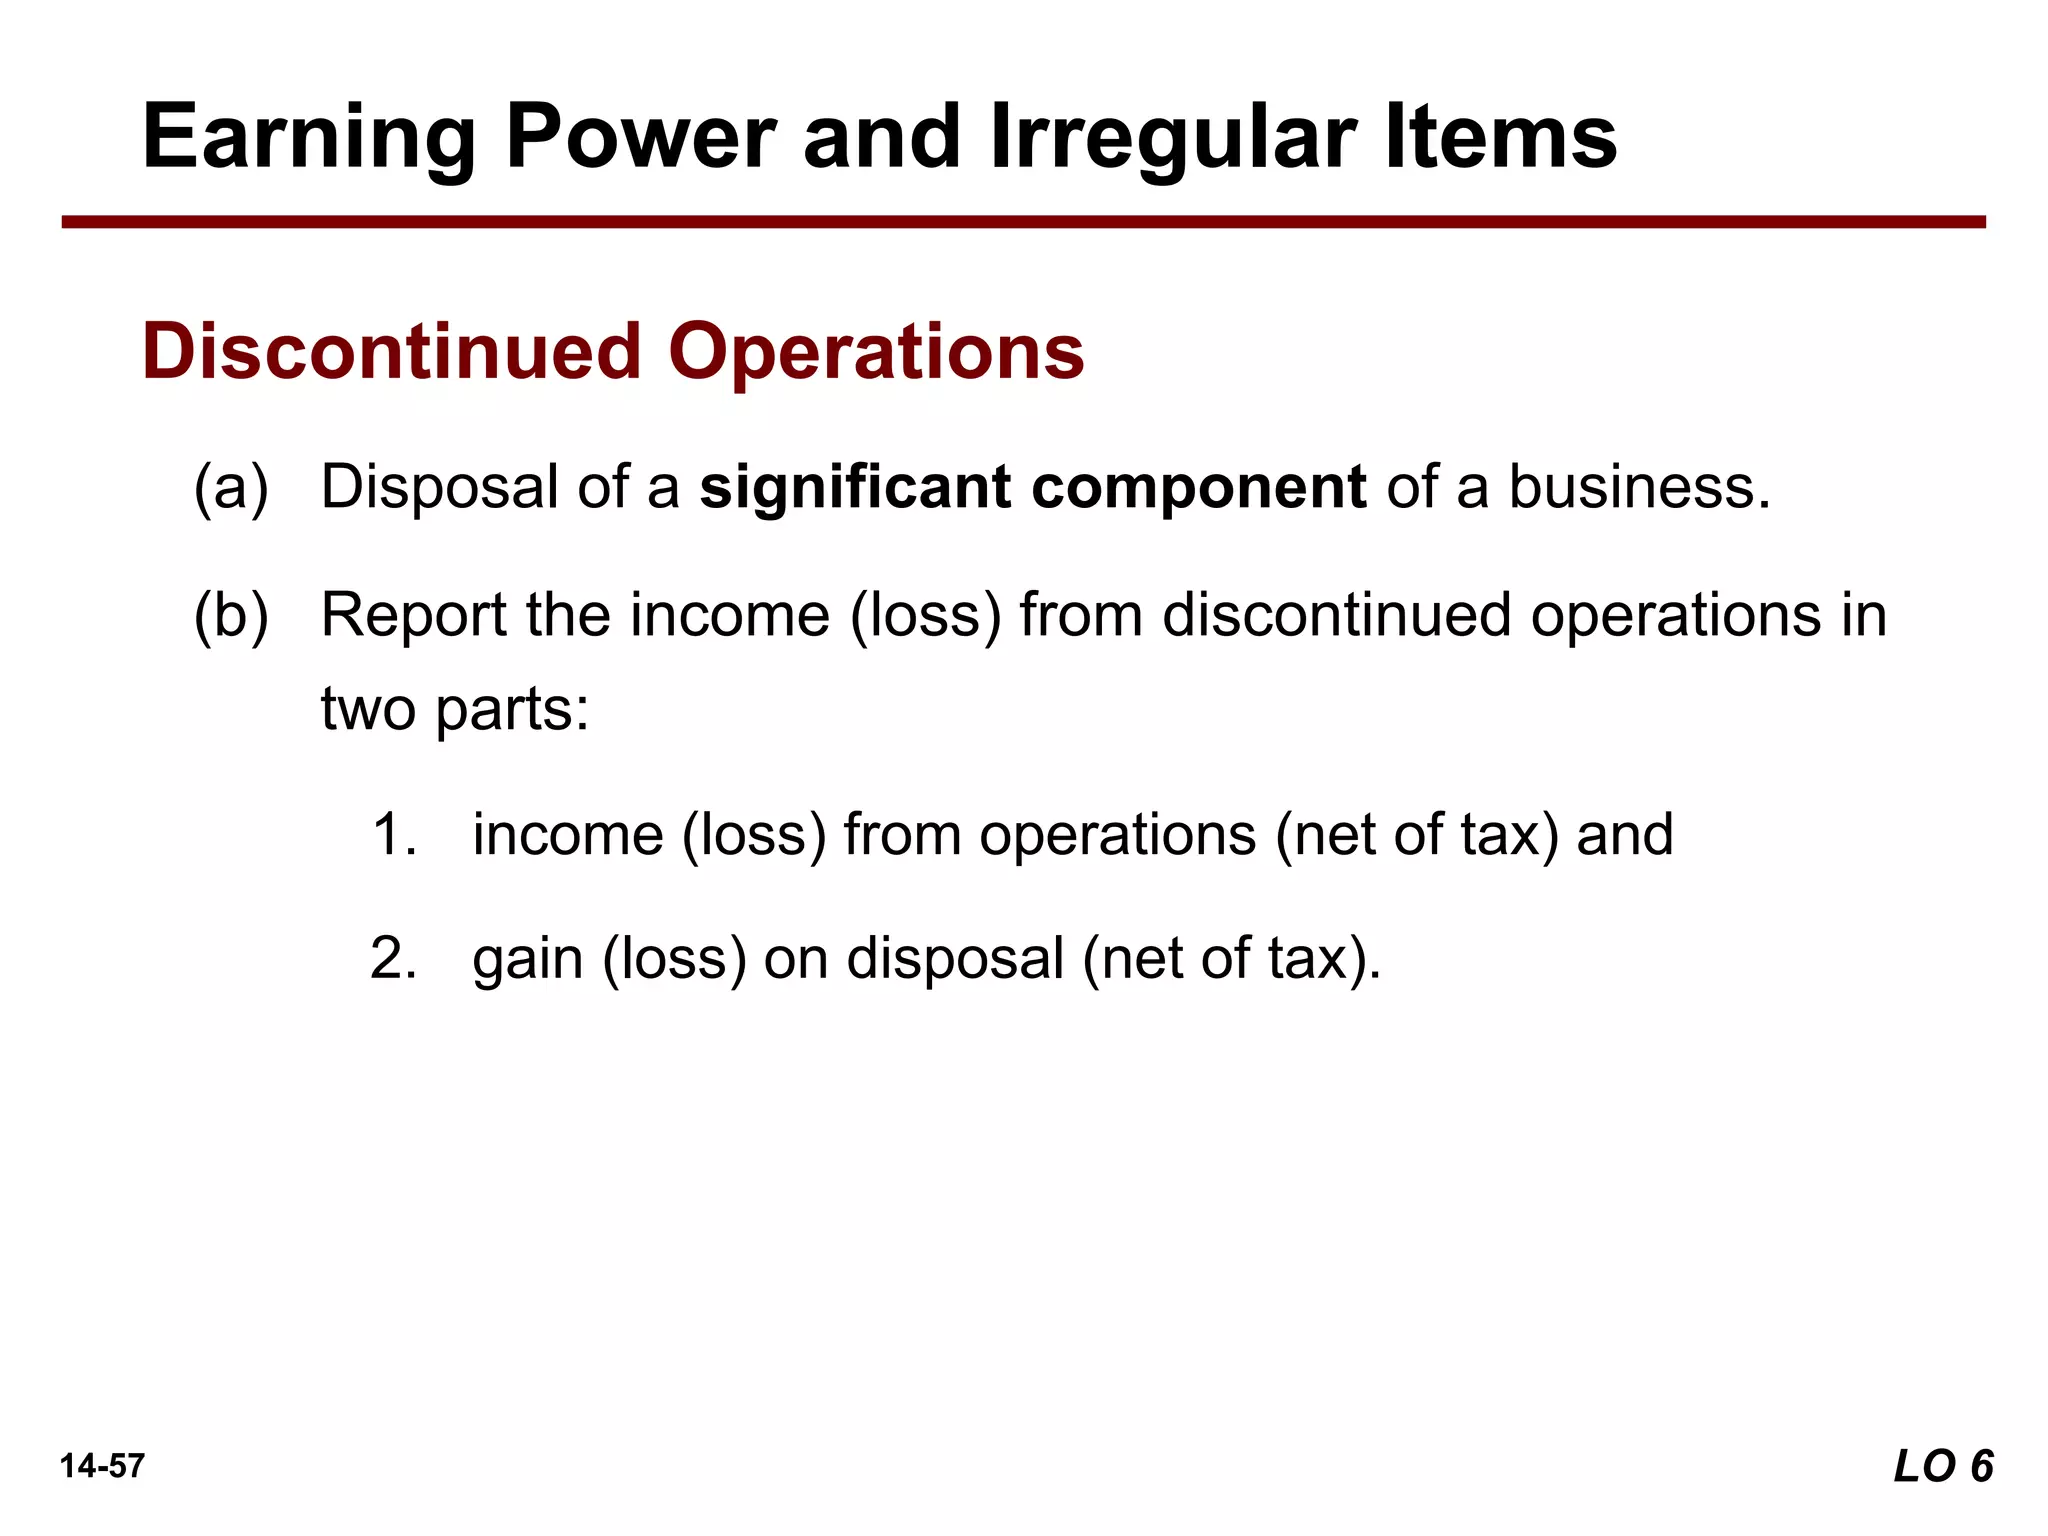
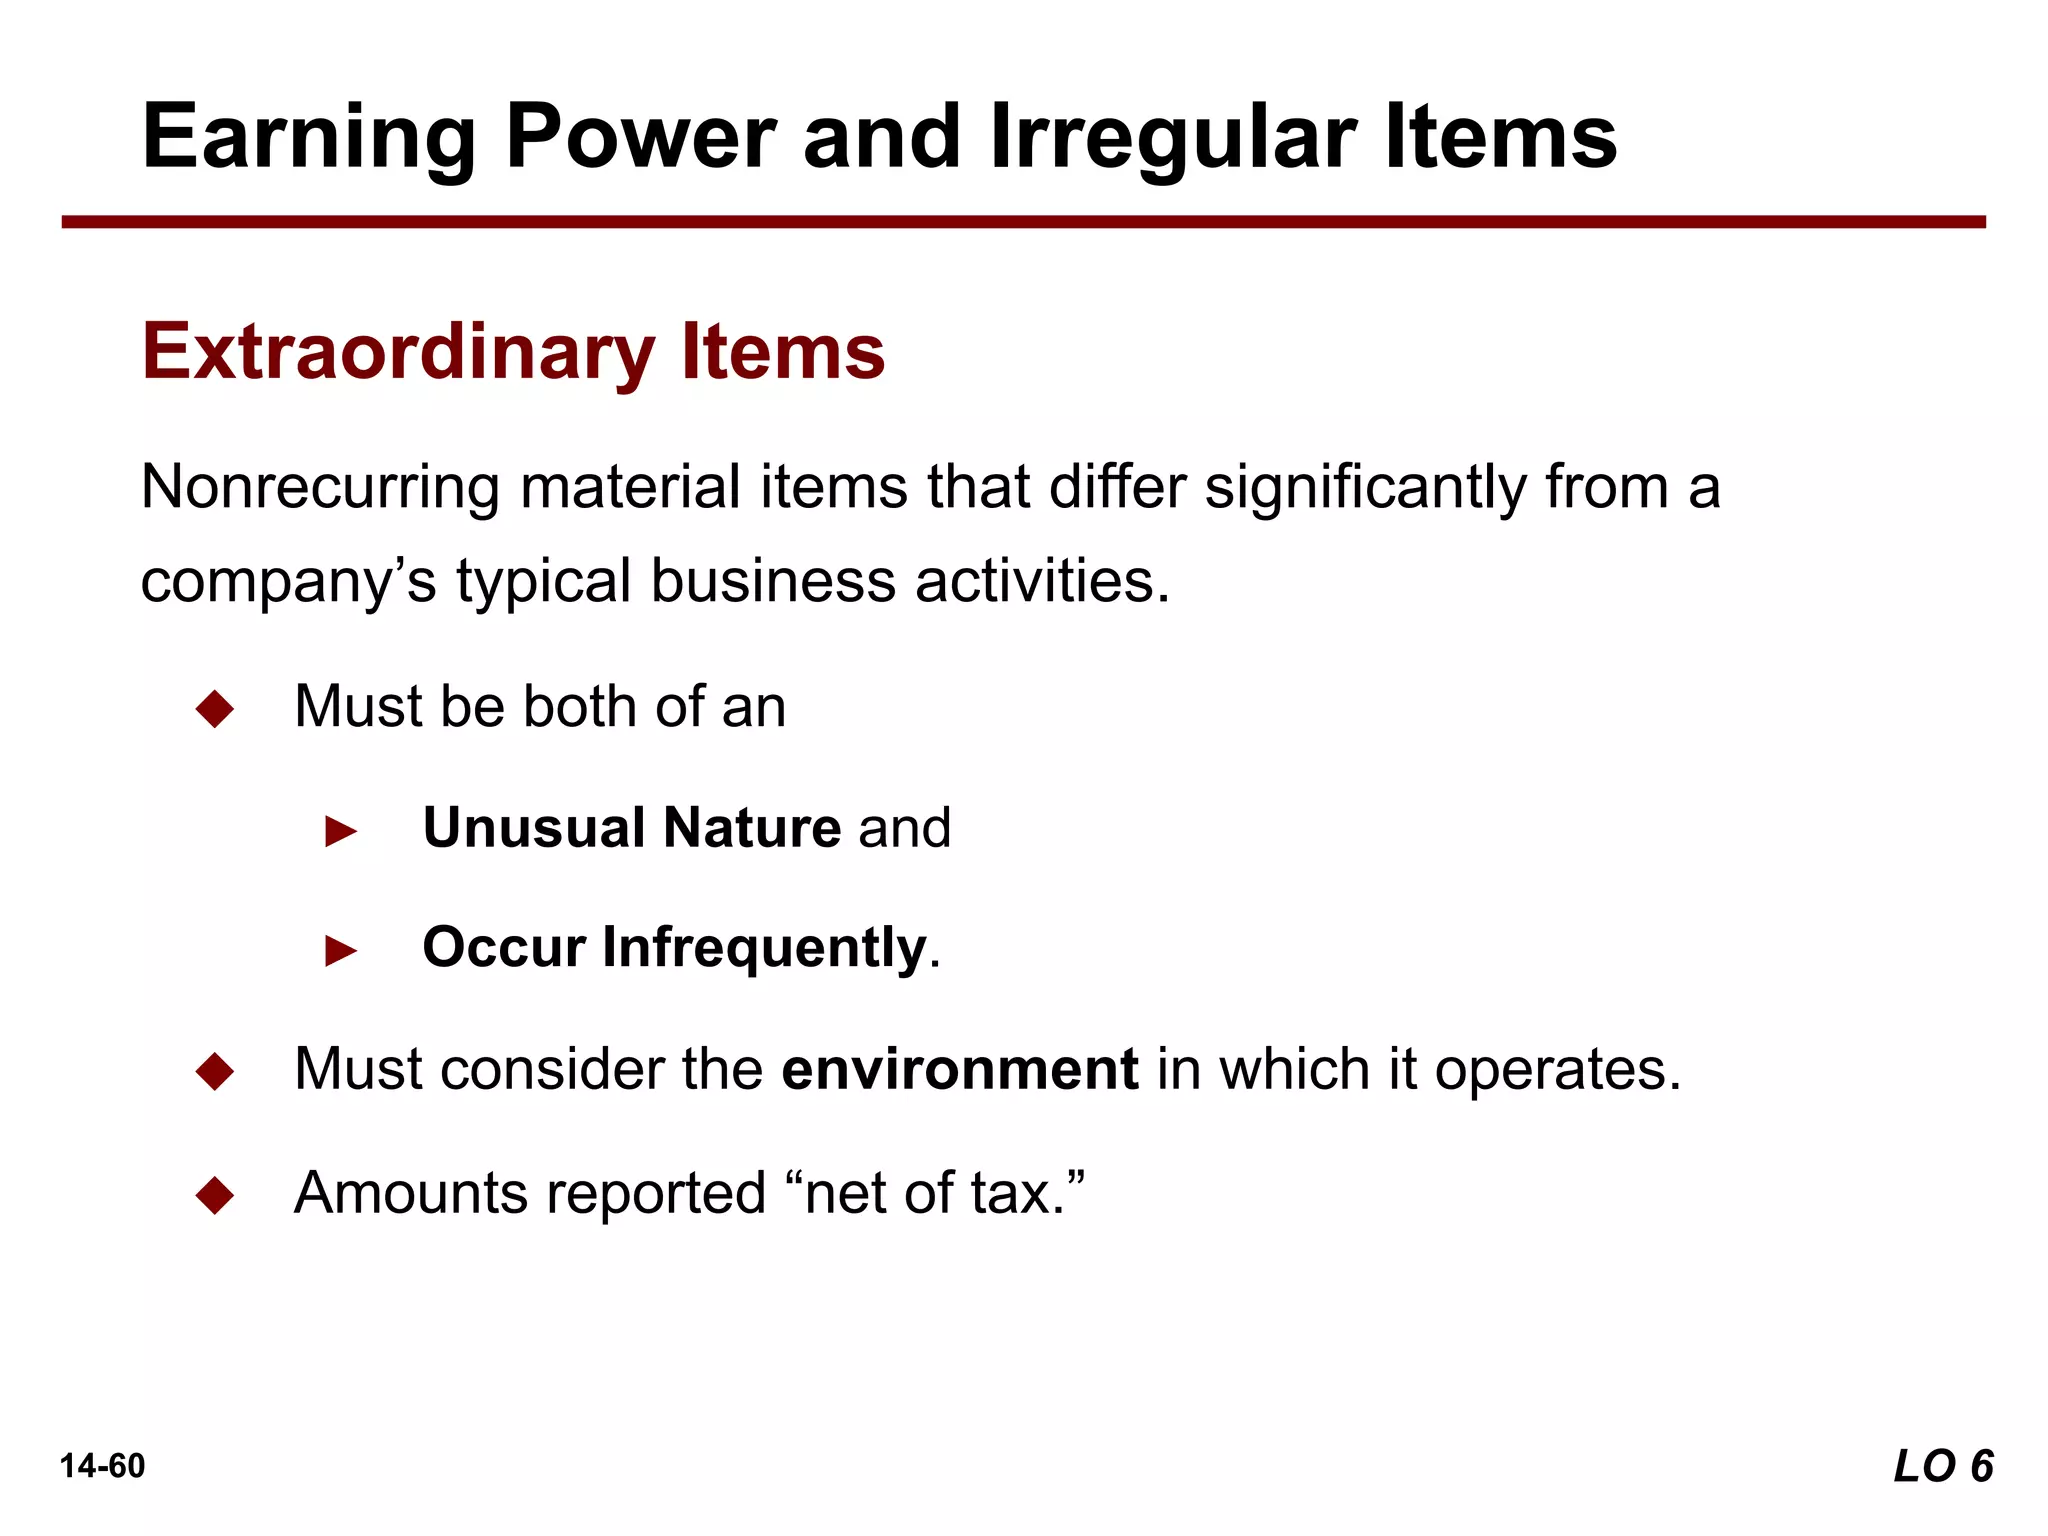
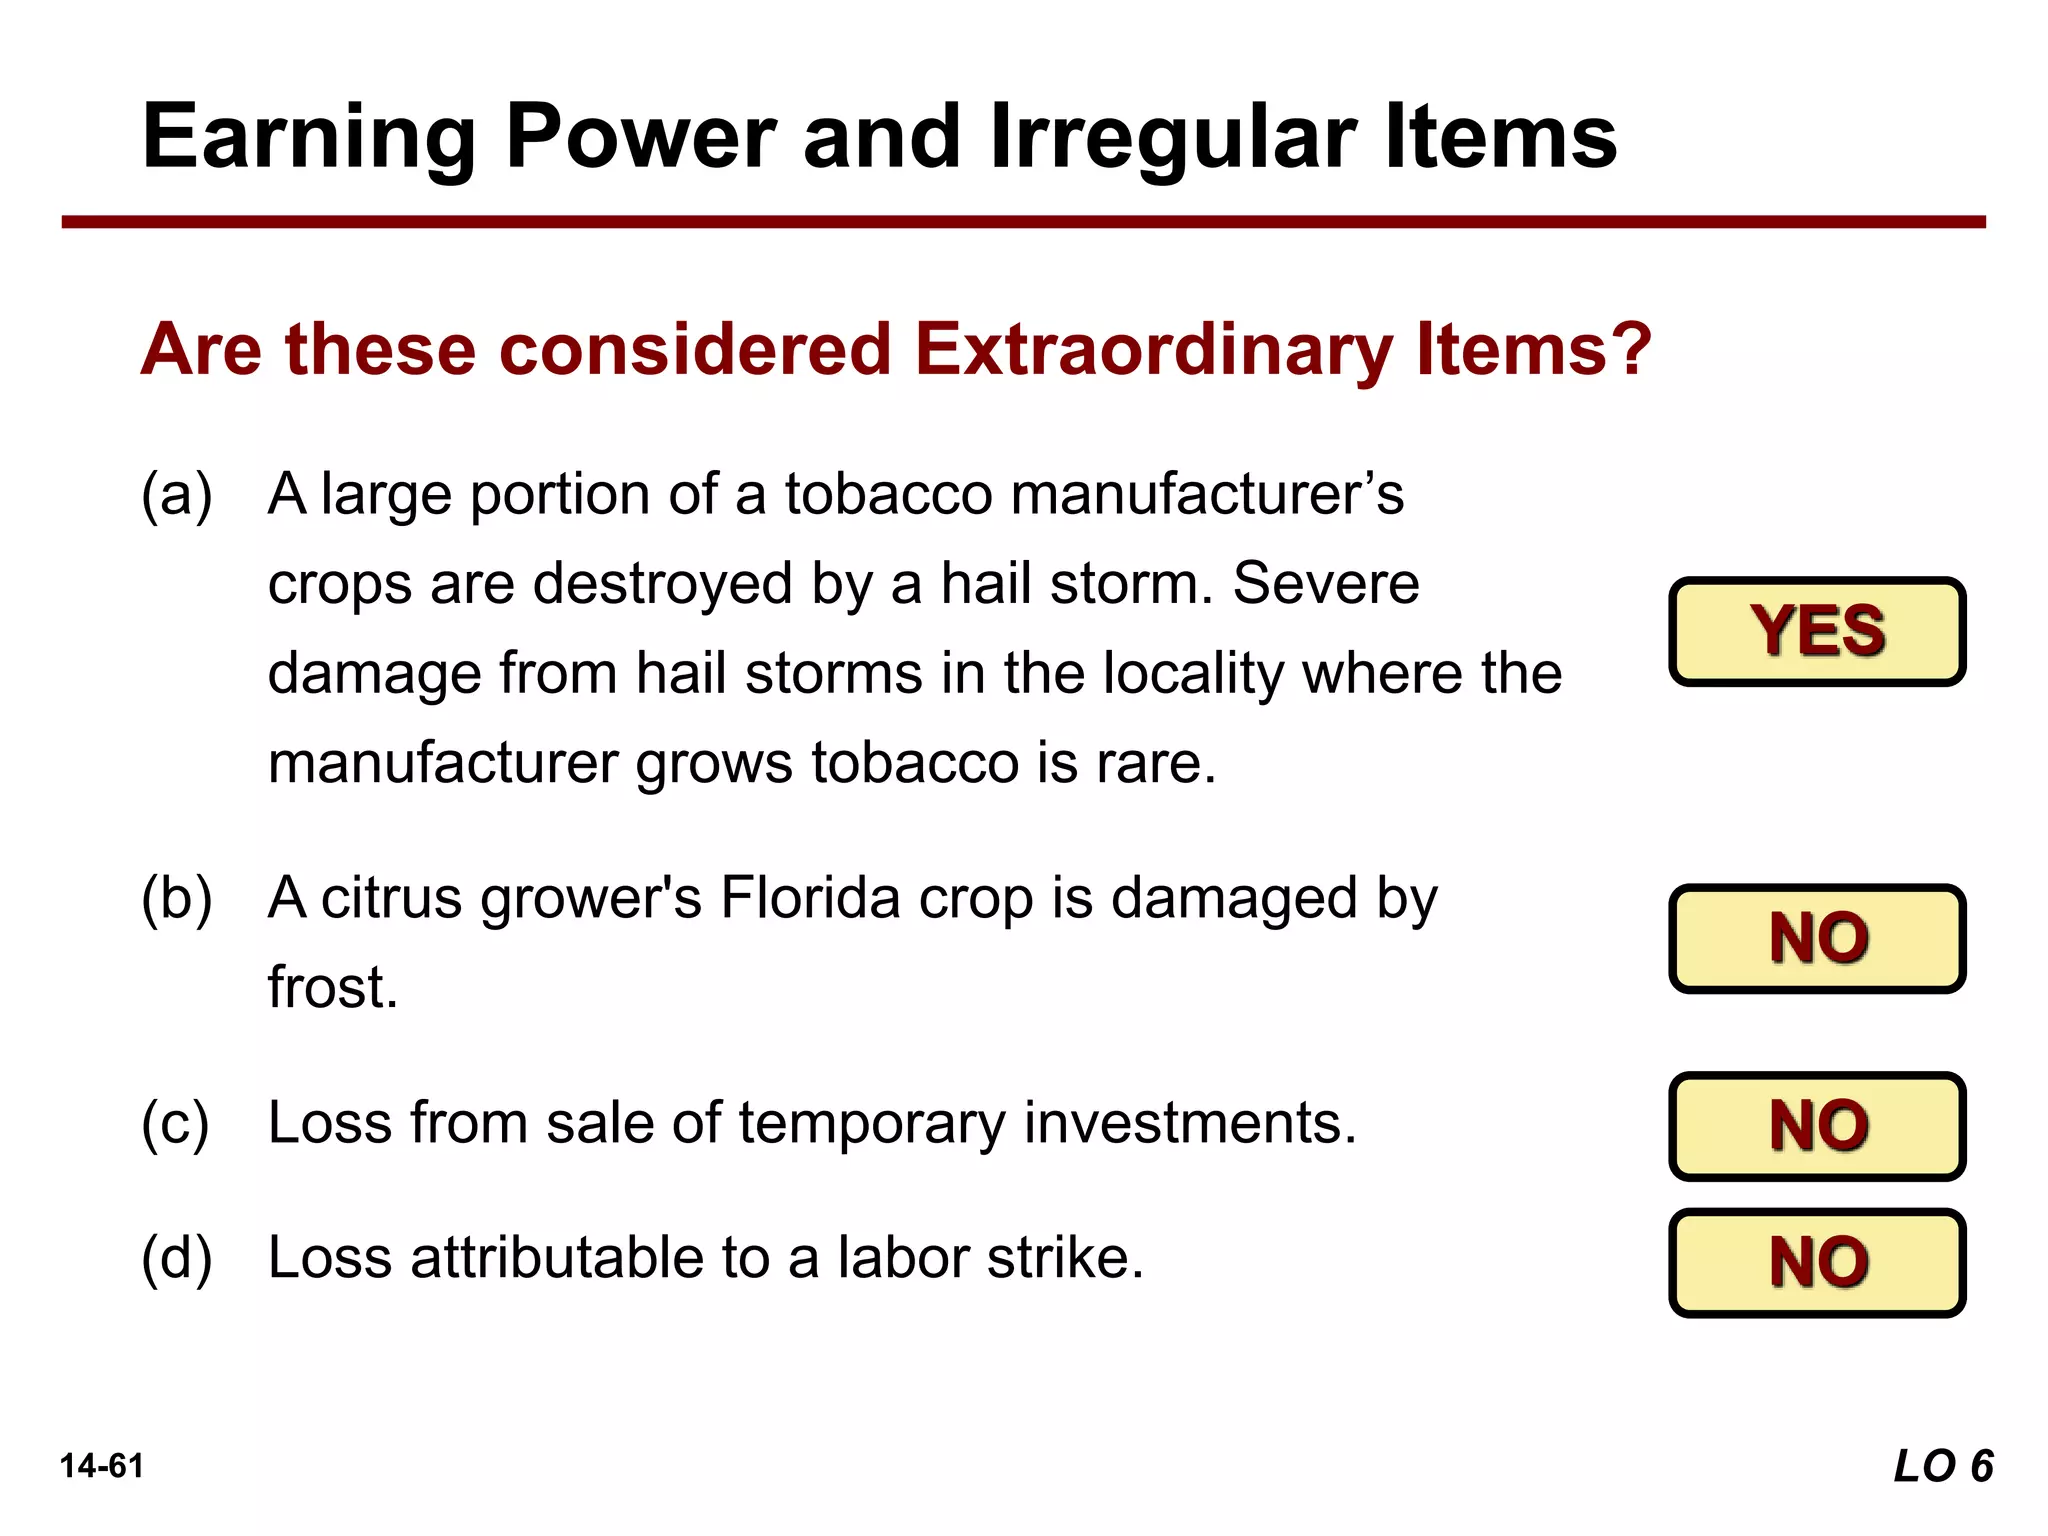
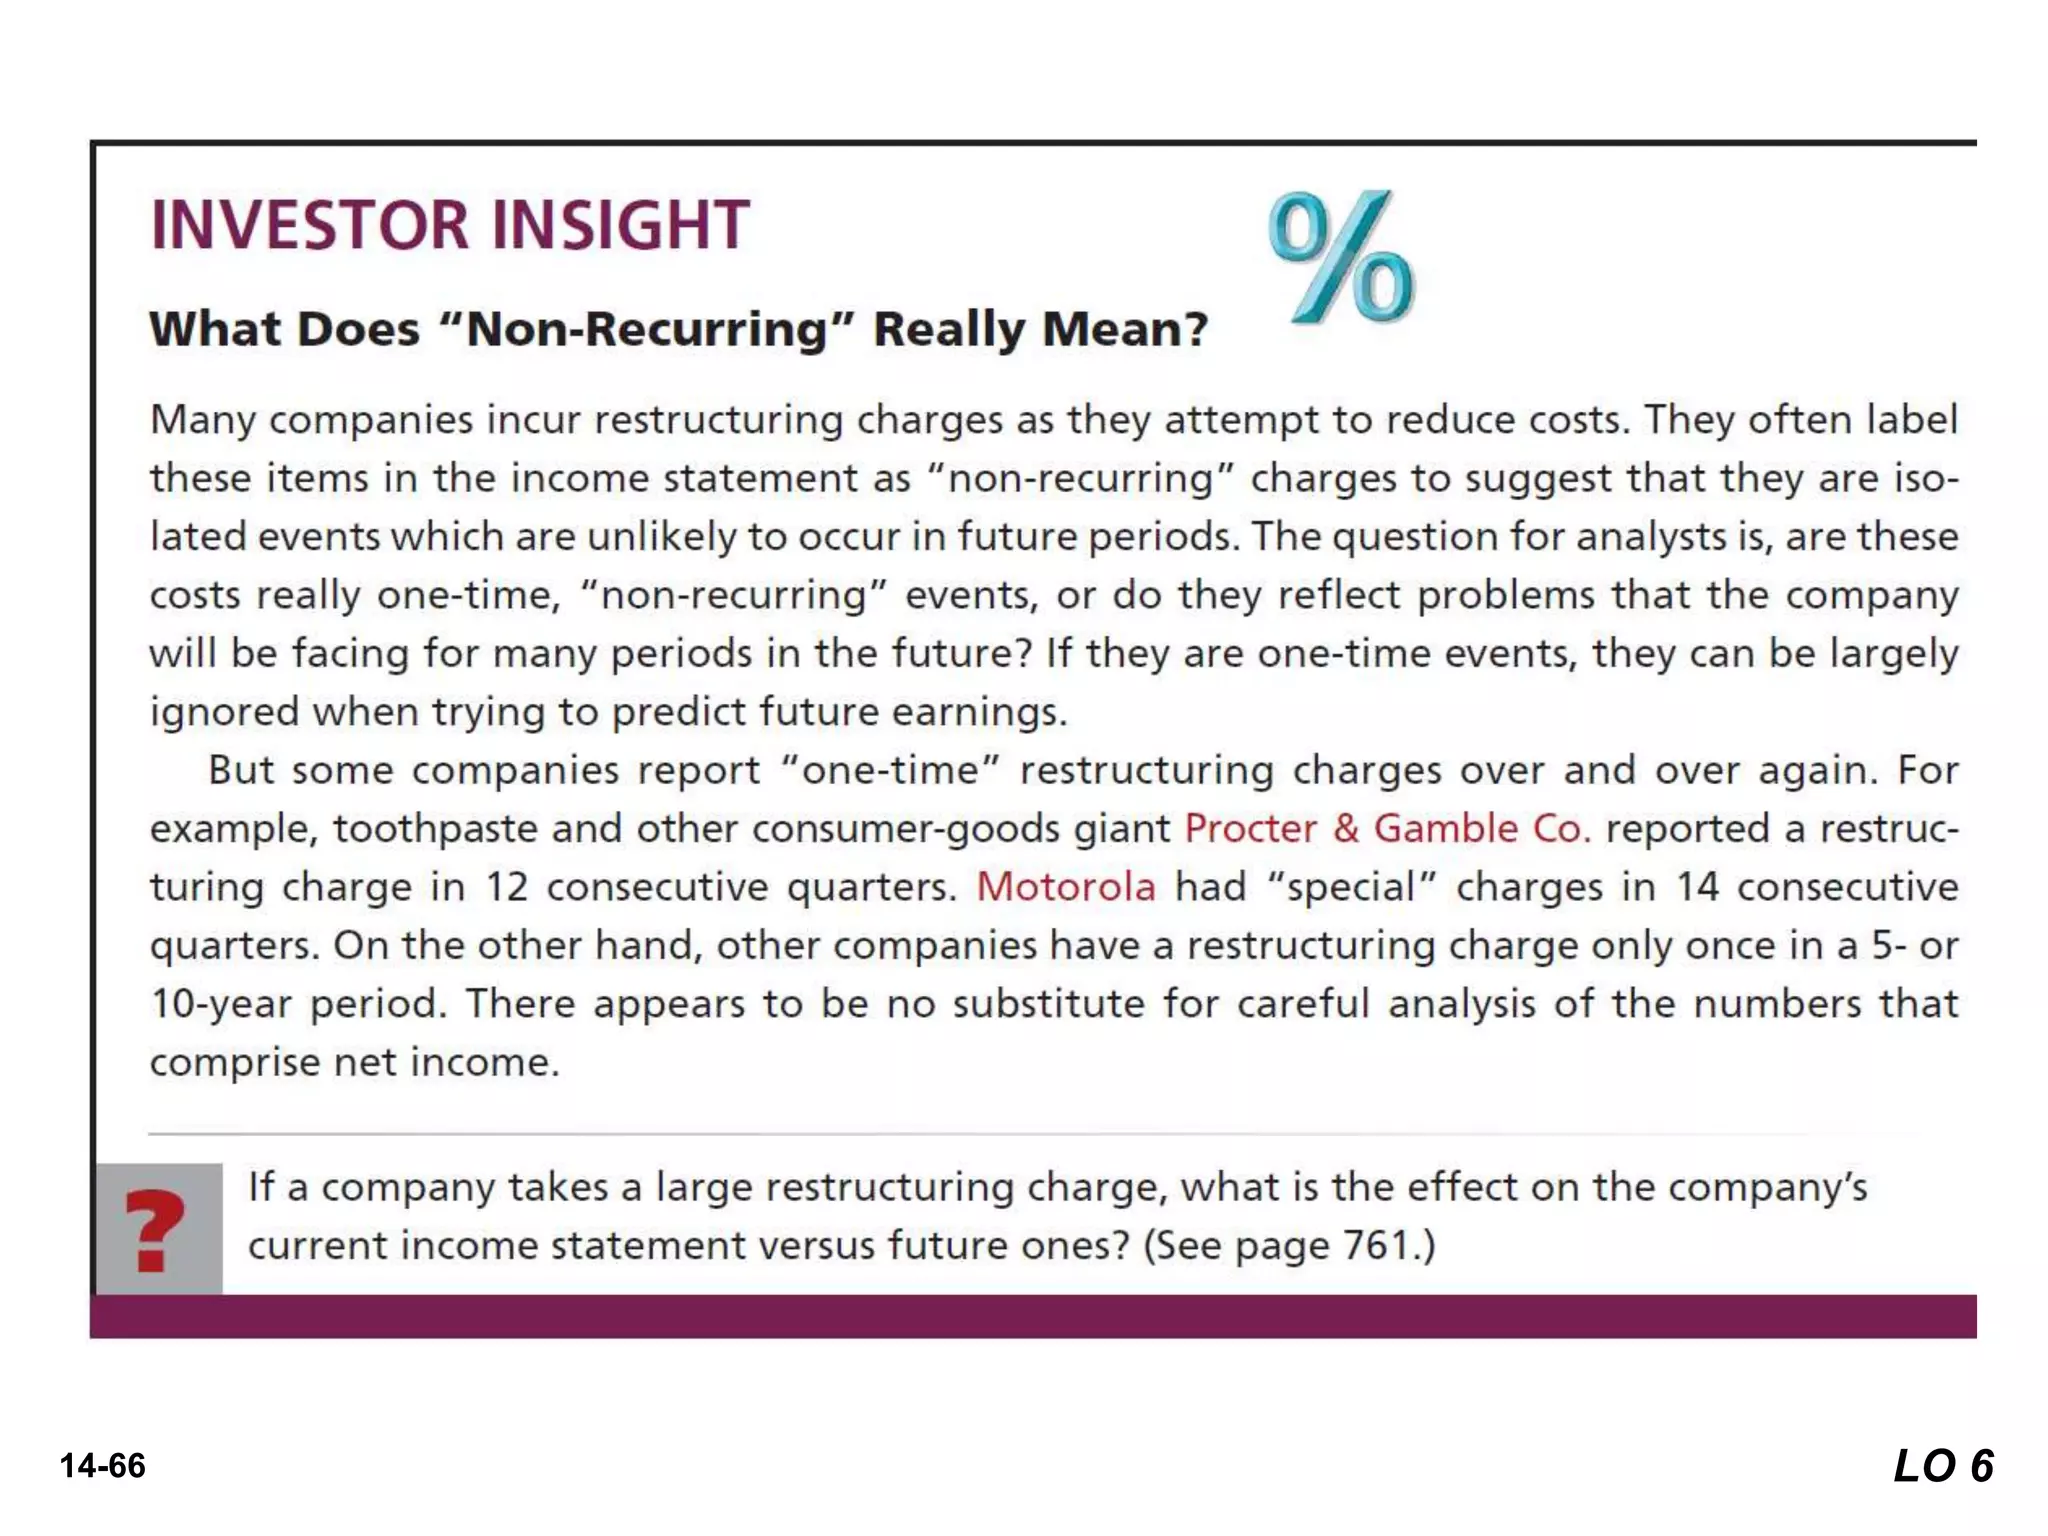
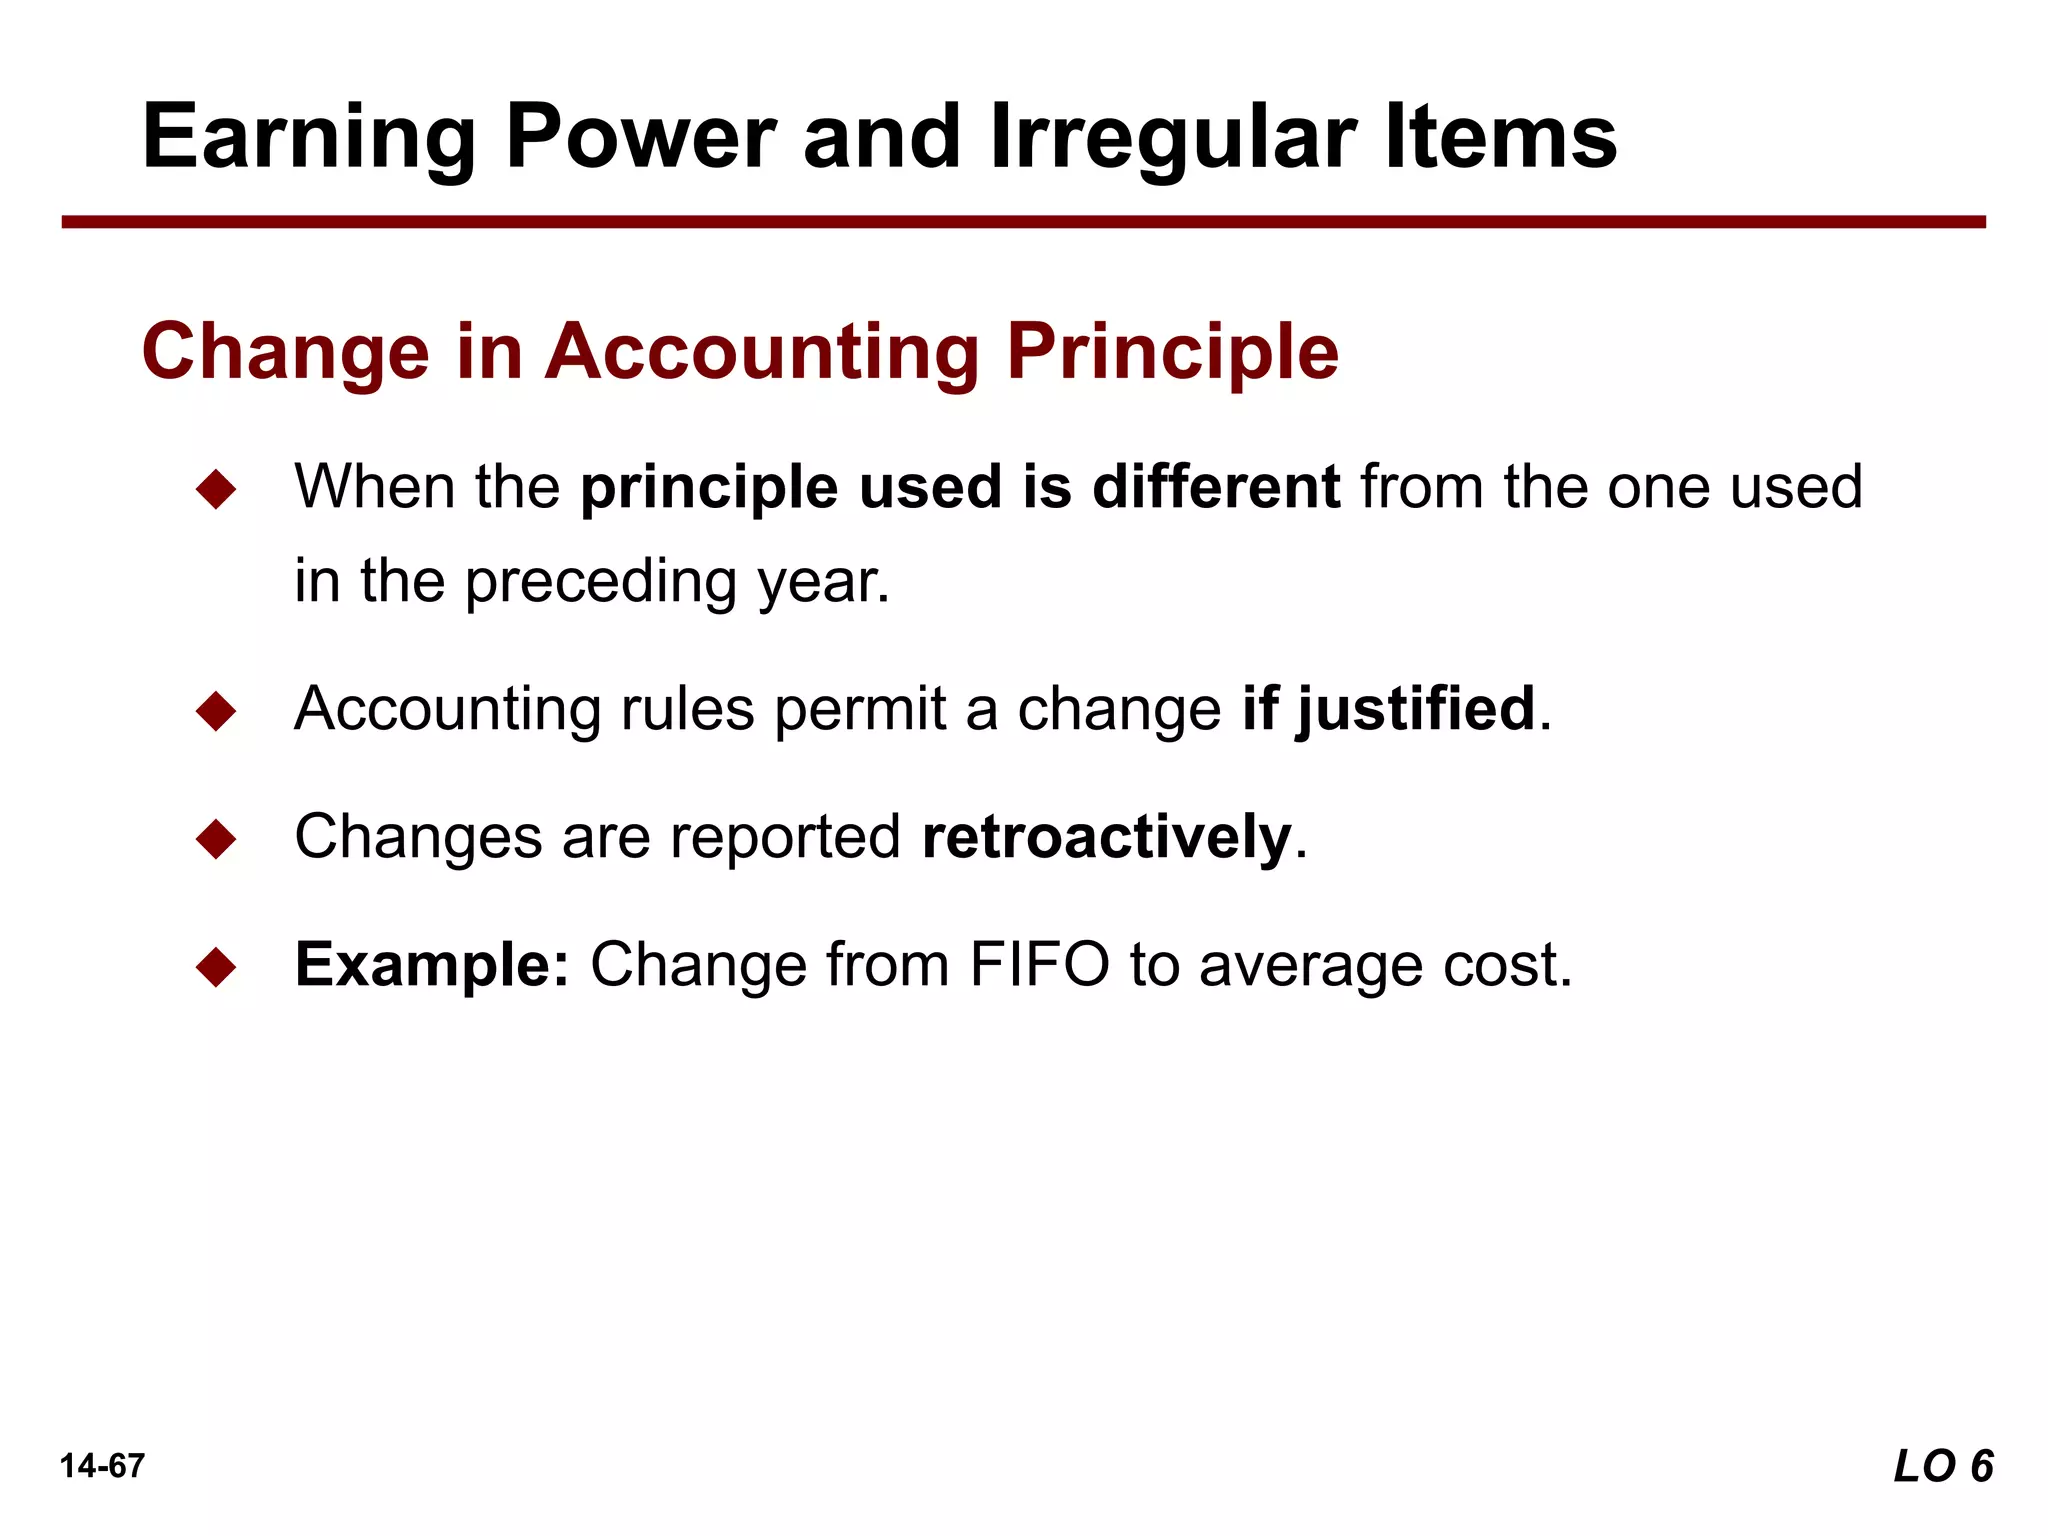
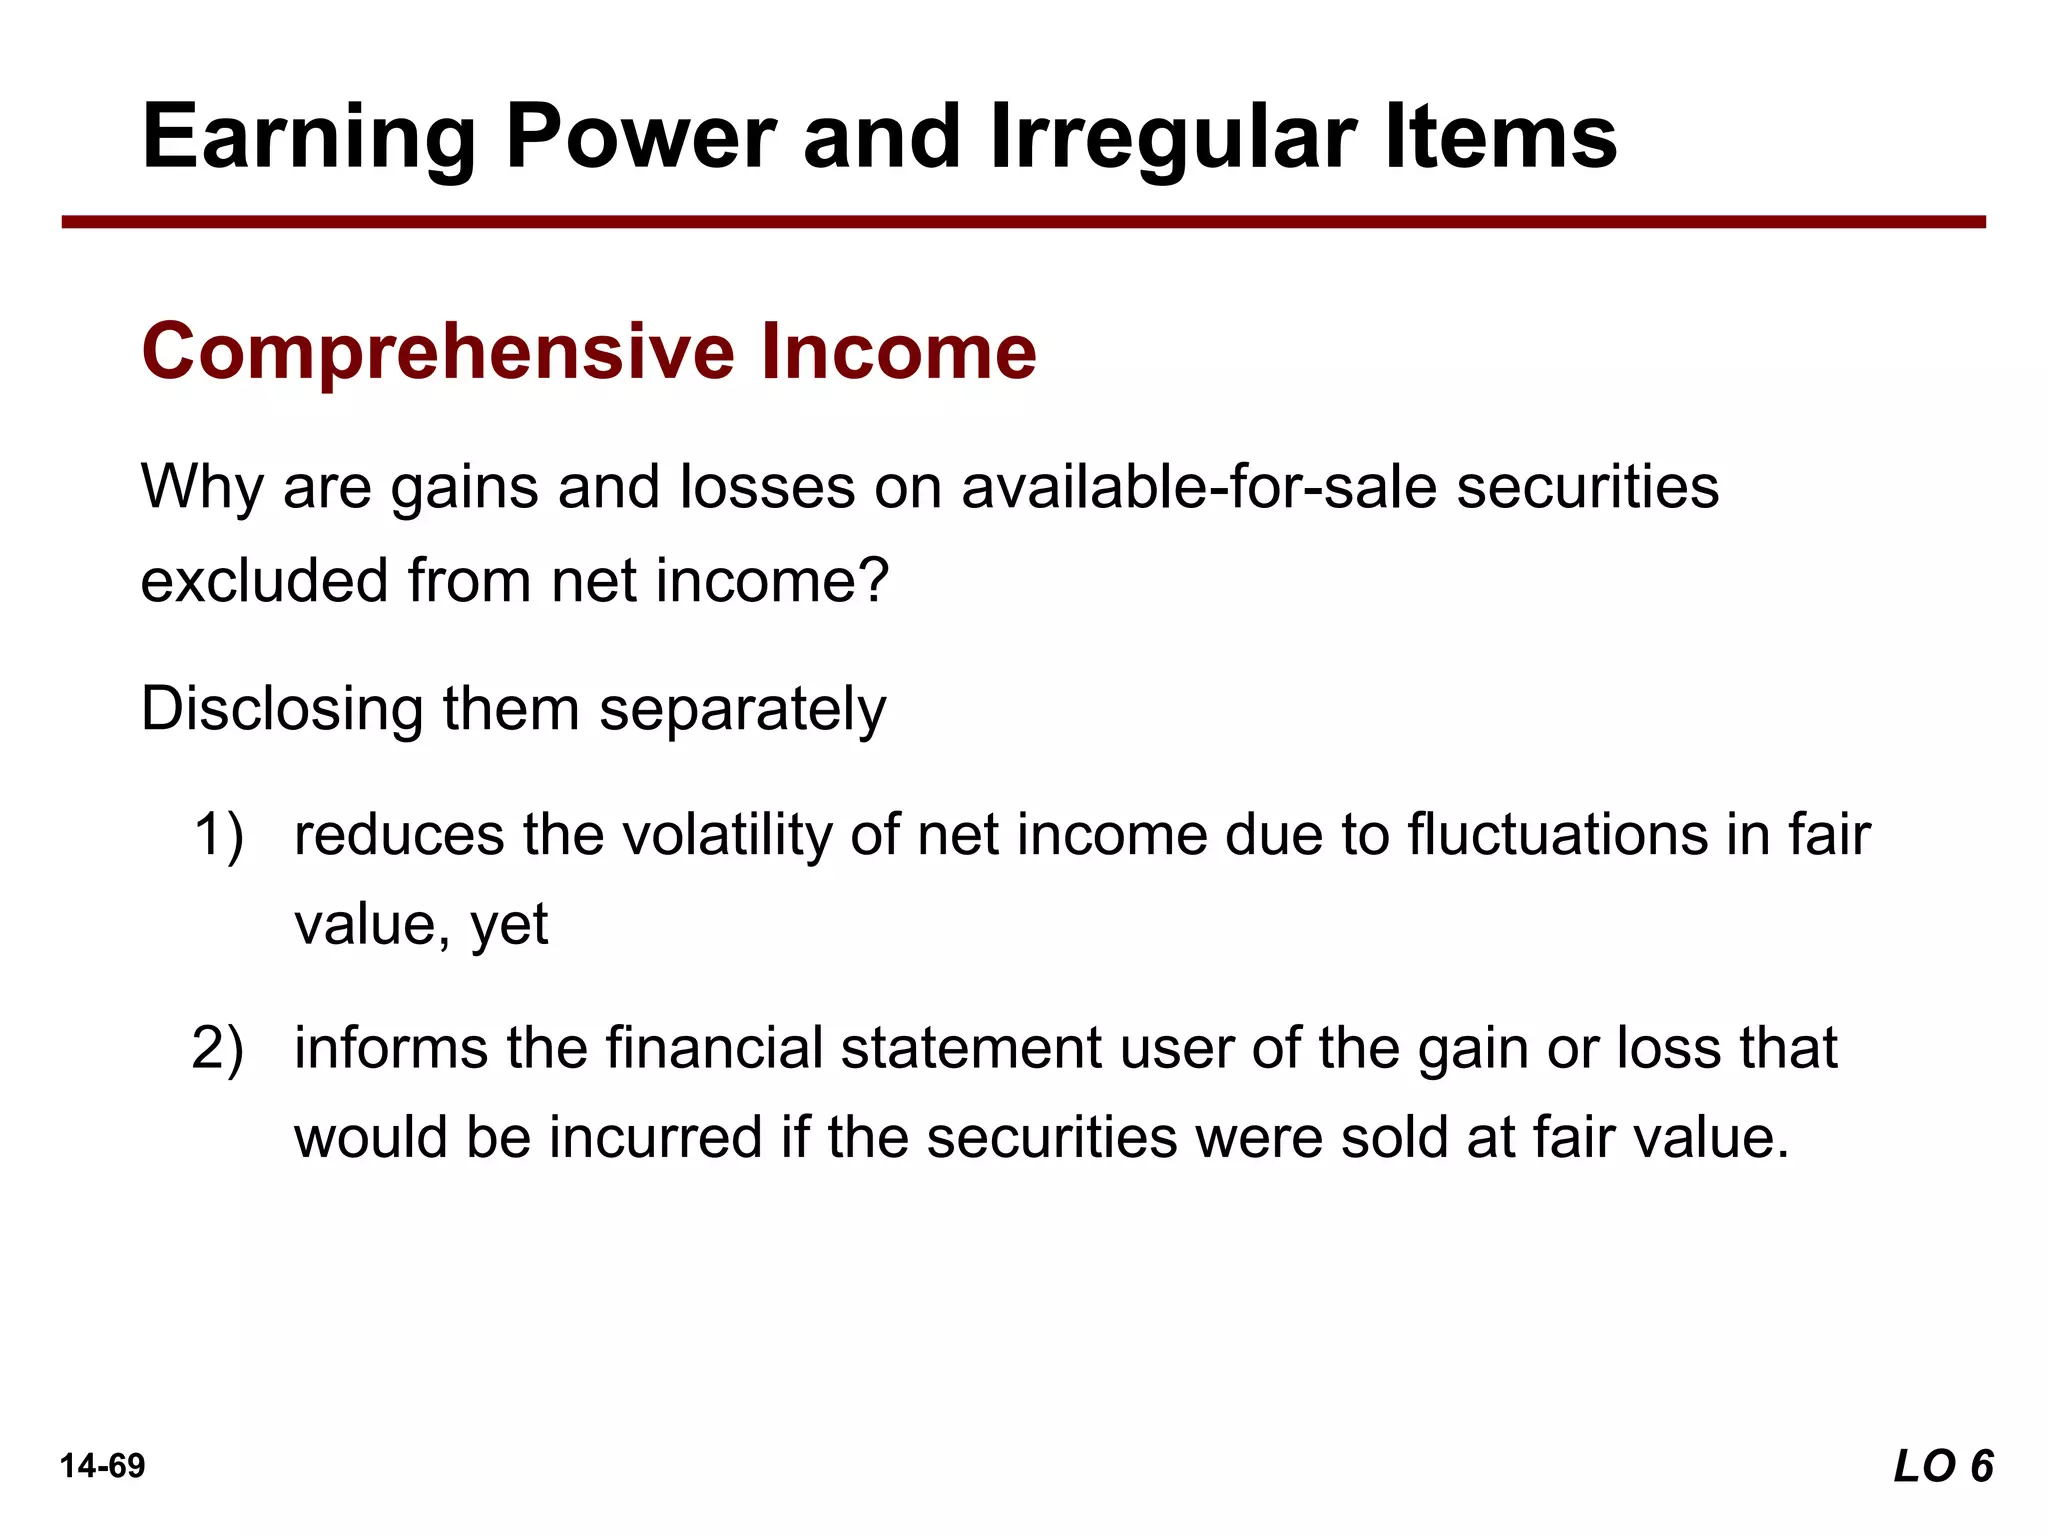
[6] Understand the concept of earning power, and how irregular items are
presented.
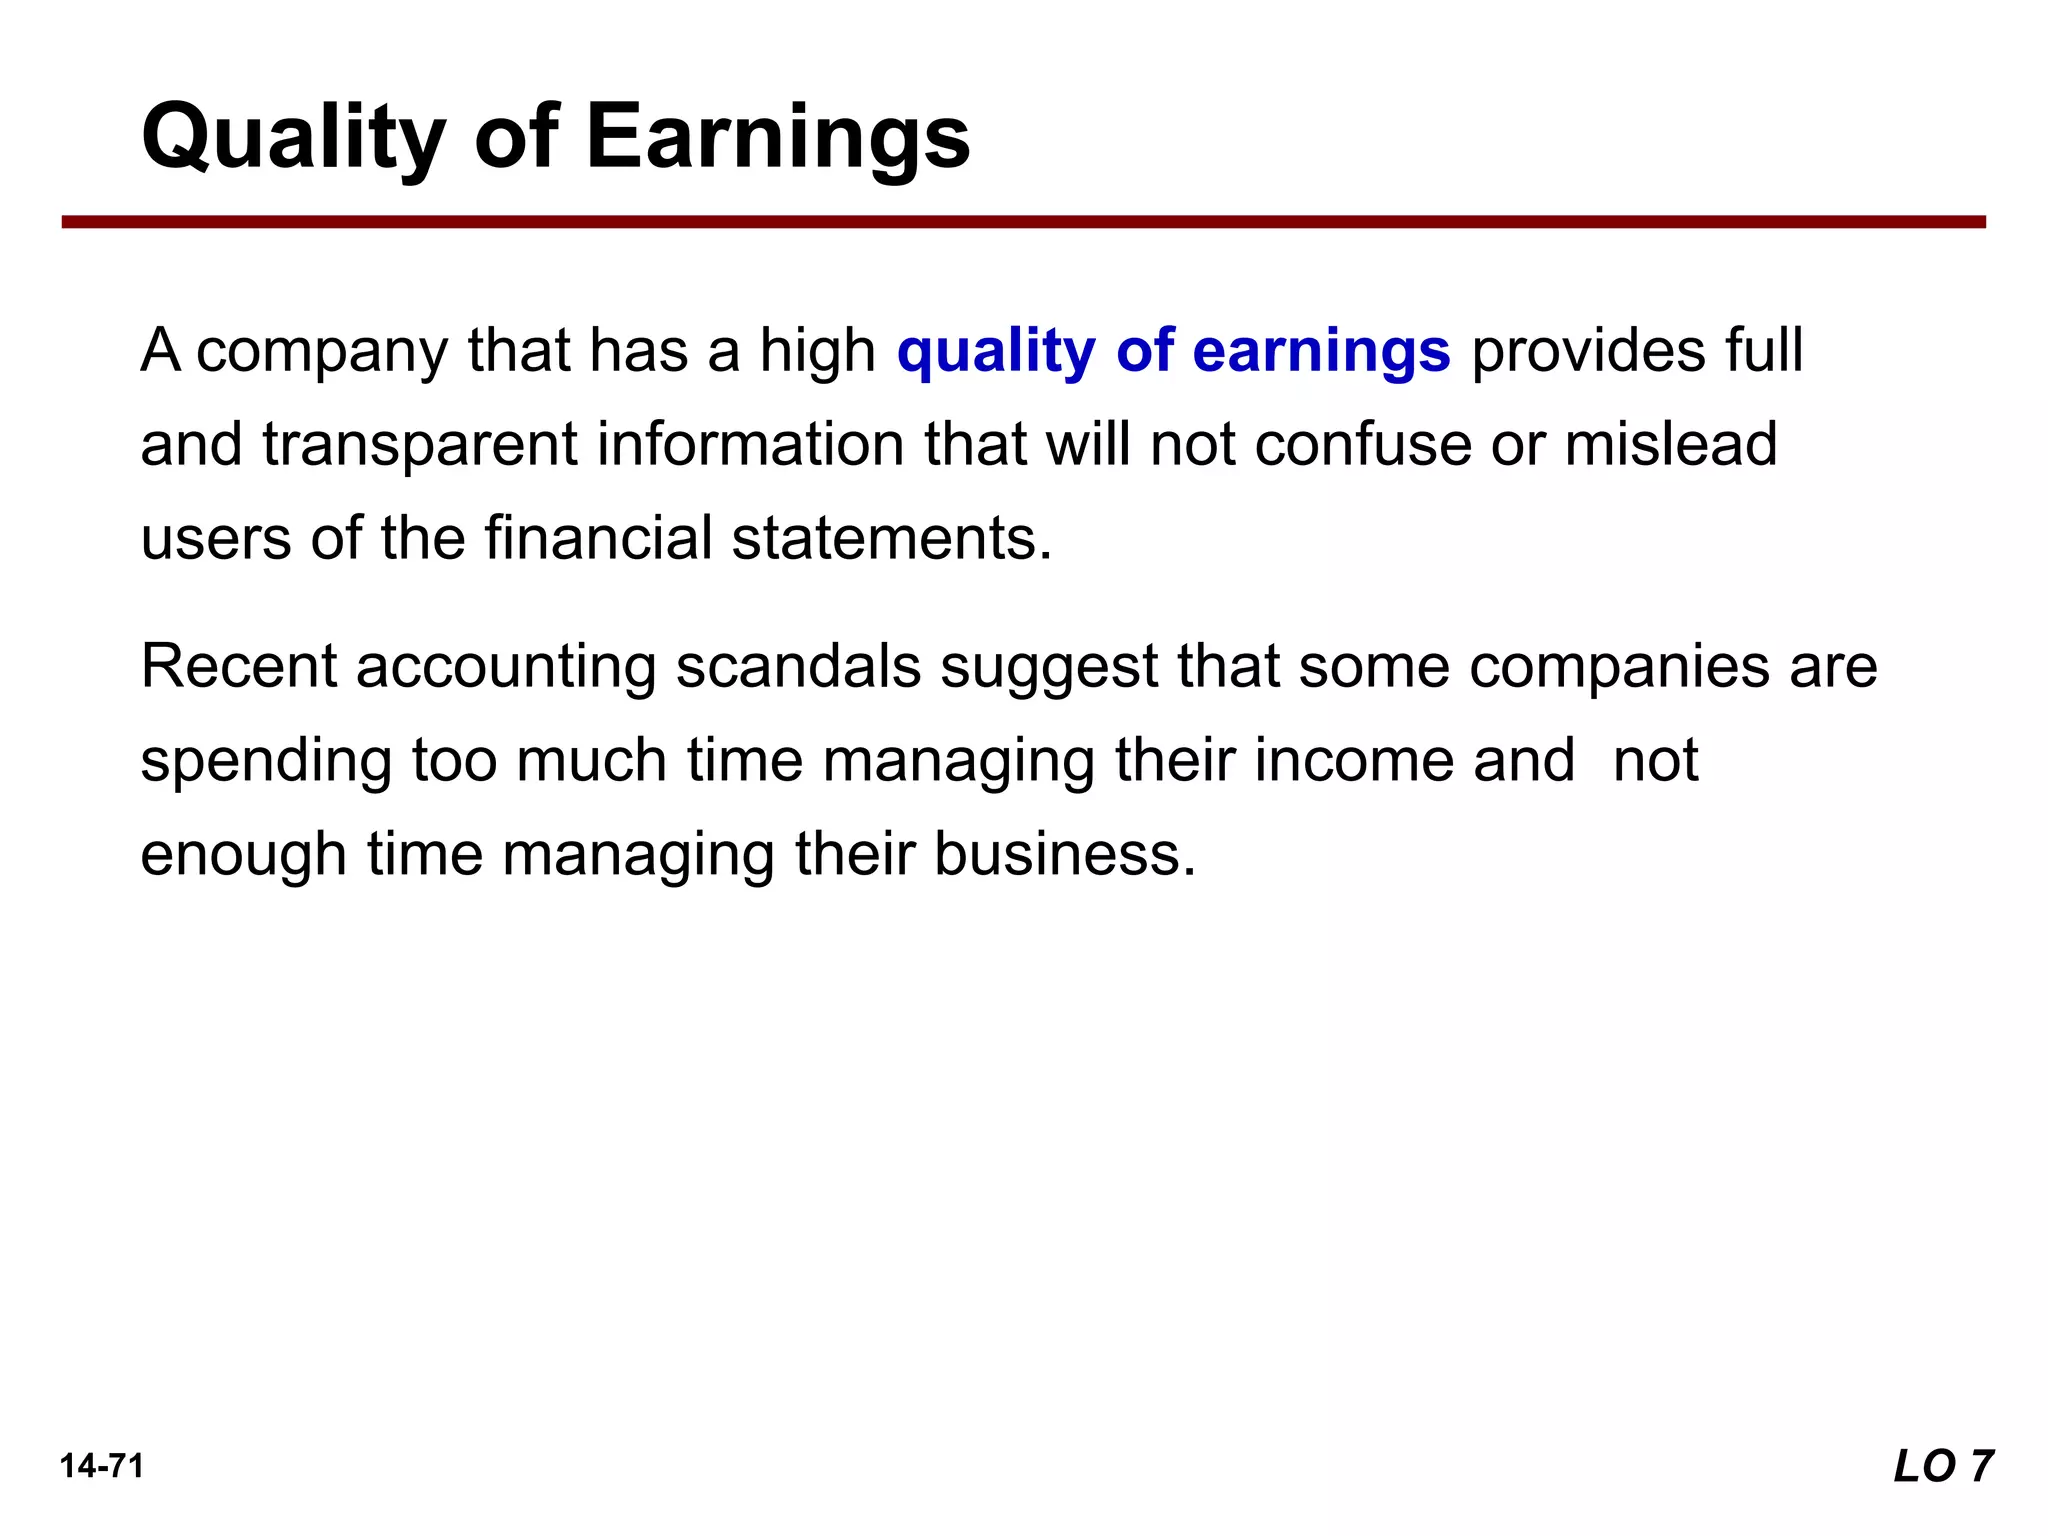
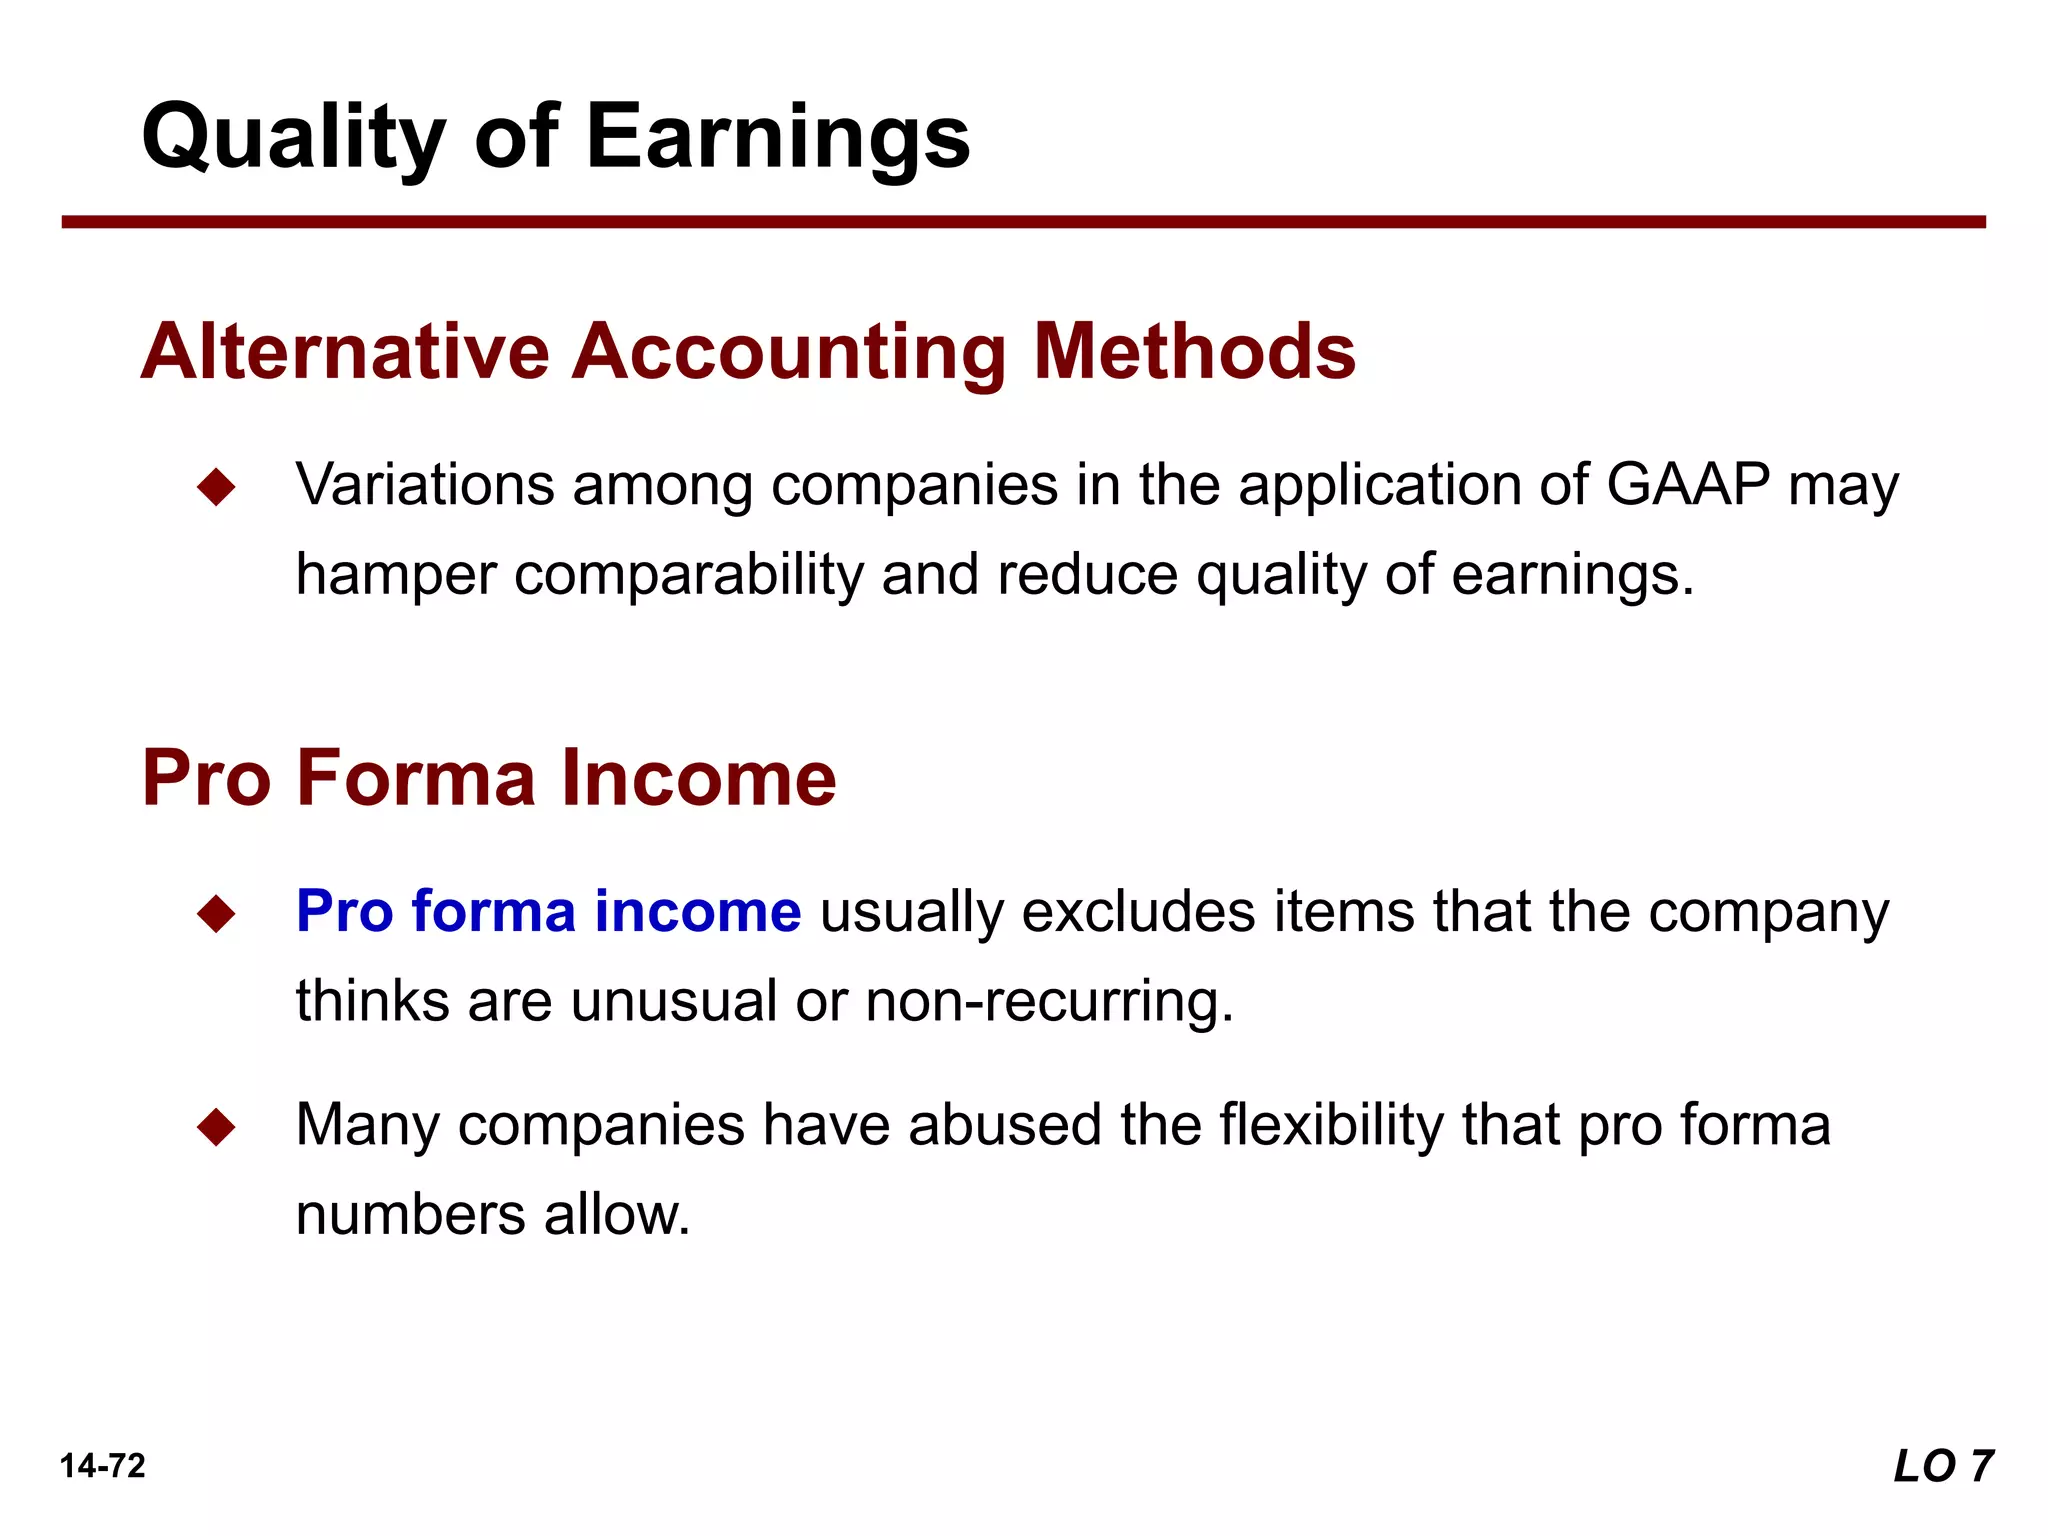
[7] Understand the concept of quality of earnings.](https://image.slidesharecdn.com/ratioanalysis-230805071229-6ea15844/75/ratio-analysis-ppt-3-2048.jpg)
![14-5
14 Financial Statement Analysis
Learning Objectives
After studying this chapter, you should be able to:
[1] Discuss the need for comparative analysis.
[2] Identify the tools of financial statement analysis.
[3] Explain and apply horizontal analysis.
[4] Describe and apply vertical analysis.
[5] Identify and compute ratios used in analyzing a firm’s liquidity,
profitability, and solvency.
[6] Understand the concept of earning power, and how irregular items are
presented.
[7] Understand the concept of quality of earnings.](https://image.slidesharecdn.com/ratioanalysis-230805071229-6ea15844/75/ratio-analysis-ppt-5-2048.jpg)

![14-10
14 Financial Statement Analysis
Learning Objectives
After studying this chapter, you should be able to:
[1] Discuss the need for comparative analysis.
[2] Identify the tools of financial statement analysis.
[3] Explain and apply horizontal analysis.
[4] Describe and apply vertical analysis.
[5] Identify and compute ratios used in analyzing a firm’s liquidity,
profitability, and solvency.
[6] Understand the concept of earning power, and how irregular items are
presented.
[7] Understand the concept of quality of earnings.](https://image.slidesharecdn.com/ratioanalysis-230805071229-6ea15844/75/ratio-analysis-ppt-10-2048.jpg)


![14-15
14 Financial Statement Analysis
Learning Objectives
After studying this chapter, you should be able to:
[1] Discuss the need for comparative analysis.
[2] Identify the tools of financial statement analysis.
[3] Explain and apply horizontal analysis.
[4] Describe and apply vertical analysis.
[5] Identify and compute ratios used in analyzing a firm’s liquidity,
profitability, and solvency.
[6] Understand the concept of earning power, and how irregular items are
presented.
[7] Understand the concept of quality of earnings.](https://image.slidesharecdn.com/ratioanalysis-230805071229-6ea15844/75/ratio-analysis-ppt-15-2048.jpg)


![14-55
14 Financial Statement Analysis
Learning Objectives
After studying this chapter, you should be able to:
[1] Discuss the need for comparative analysis.
[2] Identify the tools of financial statement analysis.
[3] Explain and apply horizontal analysis.
[4] Describe and apply vertical analysis.
[5] Identify and compute ratios used in analyzing a firm’s liquidity,
profitability, and solvency.
[6] Understand the concept of earning power, and how irregular items
are presented.
[7] Understand the concept of quality of earnings.](https://image.slidesharecdn.com/ratioanalysis-230805071229-6ea15844/75/ratio-analysis-ppt-55-2048.jpg)


![14-70
14 Financial Statement Analysis
Learning Objectives
After studying this chapter, you should be able to:
[1] Discuss the need for comparative analysis.
[2] Identify the tools of financial statement analysis.
[3] Explain and apply horizontal analysis.
[4] Describe and apply vertical analysis.
[5] Identify and compute ratios used in analyzing a firm’s liquidity,
profitability, and solvency.
[6] Understand the concept of earning power, and how irregular items are
presented.
[7] Understand the concept of quality of earnings.](https://image.slidesharecdn.com/ratioanalysis-230805071229-6ea15844/75/ratio-analysis-ppt-70-2048.jpg)