Raster data Model
•Introduction
• Raster data type record spatial information
in a regular grid or matrix organized as a
set of rows and columns.
• Each cell within this grid contains a
number representing a particular
geographic feature.
2.
Representation of Featuresin
Raster Model
• A single scalar value is assigned to each
cell or grid
• Value of the cell may represent an
average value over the entire cell area
• It may be the value at the center of the cell
or the value at the grid node (a corner).
3.
Representation of Featuresin
Raster Model
• Image data is a form of raster data in
which each cell or pixel stores a value
recorded by optical or electronic device.
• In remote sensing it is called picture
element or pixel.
• Raster data is highly dependent on the
resolution of the regular grid in which it is
recorded.
4.
When Applicable
• Rasterdata are commonly, but not
exclusively, used to store information
about geographic features that varies
continuously over a surface
(i.e,continuous, rather than discrete, data)
Some examples of continuous data are:
5.
Example of Continuousdata
• elevation (relief) and ground water depth
• oil depth across an open-water oil spill
• soil pH
• reflectance in a certain band in the
electromagnetic spectrum
• landform aspect (compass bearing of
steepest downward descent)
• salinity of a water body
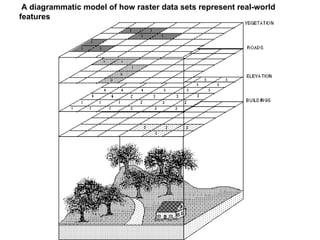
• In theabove diagram, each feature type
on the landscape (buildings, elevation,
roads, vegetation) is represented in its
own raster theme.
• Note that each raster theme has cells with
numbers.
• For the buildings theme, all cell values are
2 (in this case, 2 is a code for houses;
other buildings would be encoded with a
different value).
8.
• For theelevation theme, the cell value is
the elevation at the center of the cell.
• For roads, a value of 3 indicates a road
(other road features, e.g., highways, would
have a different code).
• For vegetation, trees have a value of 1. In
this example, grass is treated as a
background value and has no data value
(although it could have been given a
different numeric value).
9.
• This showsthat raster entities are store in
separate files
• Each file represent a different layer of spatial
data
• If the entities do not occupy the same
geographic location (or cell in the raster model),
then it is possible to store them all in a single file
layer with an entity code given to them
• The code allows the users to know the
entity individual cell represent.
10.
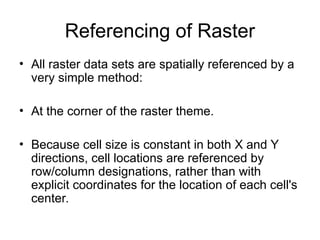
Referencing of Raster
•All raster data sets are spatially referenced by a
very simple method:
• At the corner of the raster theme.
• Because cell size is constant in both X and Y
directions, cell locations are referenced by
row/column designations, rather than with
explicit coordinates for the location of each cell's
center.
12.
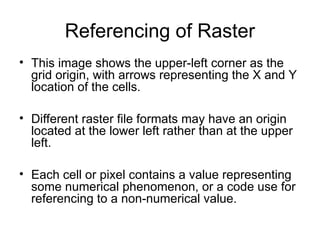
Referencing of Raster
•This image shows the upper-left corner as the
grid origin, with arrows representing the X and Y
location of the cells.
• Different raster file formats may have an origin
located at the lower left rather than at the upper
left.
• Each cell or pixel contains a value representing
some numerical phenomenon, or a code use for
referencing to a non-numerical value.
13.
Raster Versus Vector
•Whereas with vector data, each point, node, and vertex
has an explicit and absolute coordinate location, raster
cells are georeferenced relative to the theme's
coordinate origin.
• This speeds up processing time immensely in
comparison to certain types of vector data processing.
• However, the file sizes of raster data sets can be very
large in comparison to vector data sets representing the
same phenomenon for the same spatial area.
14.
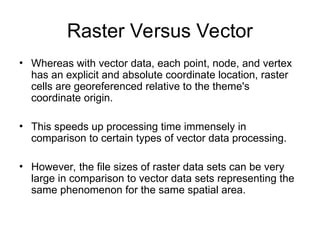
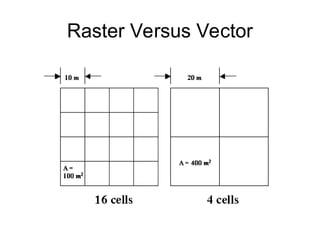
Raster Versus Vector
•Also, there is a geometric relationship between raster
resolution and file size.
• A raster data set with cells half as large (e.g., 10 m on a
side instead of 20 m on a side) may take up 4 times as
much storage space, because it takes four 10 m cells to
fit in the space of a single 20 m cell.
• The following image shows the difference in cell sizes,
area, and number of cells for two configurations of the
same total area:
Cell Value
• Cellsmay either have a value (0-infinity) or no
value (null, or no data).
• Null values mean that data either fall outside the
study area boundary, or that data were either
not collected or not available for those cells.
• In general, when null cells are used in analysis,
the output value at a the same cell location is
alsoa null value.
17.
Pixel / Cell
•Pixel or cell? All raster data sets are stored in
similar formats.
• pixel and a cell are functionally equivalent.
• A pixel (short for Picture Element) represents the
smallest resolvable "piece" of an image,
• A cell represents a user-defined area
representing a phenomenon.
• A pixel is always a cell, but a cell is not always a
pixel.
18.
Advantages Raster
• Remotesensing and other images come
in raster format.
• Good for overlay analysis
• More dimensions (z for height, T for time)
is possible but difficult to visualize.
19.
Disadvantages of Raster
•Less useful for representing networks
where connectivity is important and can
not be captured at grid cell scale
• Can not be used for cadastral mapping to
represent land ownership.
• Coarse raster might cause loss of vital
information