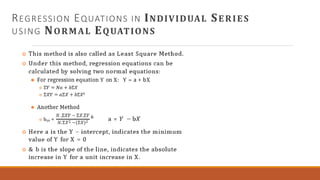
RANDOM SIGNALS
ANALYSIS
THIRD YEAR EXTC 2022-2023
GROUP MEMBERS:-
DARSHAN AHER
ADNAN SHAIKH
RUCHI SHENDAGE
TOPICS :-
•ERGODICITY
•MARKOV CHAINS
•STATISTICAL LEARNING AND ITS APPLICATIONS
ERGODICITY :
MEAN ERGODIC PROCESS :
CORRELATION IN ERGODIC PROCESS :
The stationary process {X(t)} is said to be correlation ergodic (or ergodic in the correlation), if the
process {Y(t)} is mean-ergodic, where
Y(t) = X(t+ τ ) . X(t)
That is the Stationary Process {X(t)} is correlation ergodic, if
Thus to prove that the given Random Process {X(t)} is correlation- ergodic, we have to prove that
1. {X(t)} is stationary and
2.
Ergodic Power Spectral Density
Function :
Properties of Power Spectral Density :
3. The Spectral Density Function of a real Random Process is an even Function .
4. The Spectral Density of a Process {X(t)}, real or complex, is a real function of w and non-negative.
5. The Spectral Density and autocorrelation function of a real WSS process form a Fourier cosine
transform pair .
CROSS SPECTRAL DENSITY FUNCTION :
PROPERTIES OF CROSS SPECTRAL DENSITY :
MARKOV CHAIN
Definition :- If, for all n,
P[ Xn = an/Xn-1 = an-1,Xn-2=an-2…..,X0=0 ]
= P [ Xn = an/Xn = an-1, then process [Xn], n = 0,1,2…. Is called a Markov Chain.
States of Markov Chain :-
(a1,a2,an,….) are called the States of The Markov Chain.
Transition Probability Matrix :-
When the system changes from ith stage to jth stage with probability Pij , the
probability is called transition probability .
CLASSIFICATION ON MARKOV CHAIN :
Statistical Learning and Its
Applications :
UTILITY OF REGRESSION
 Degree & Nature of relationship
 Estimation of relationship
 Prediction
 Useful in Economic & Business
Research
DIFFERENCE BETWEEN CORRELATION & REGRESSION
 Degree & Nature of Relationship
⚫ Correlation is a measure of degree of relationship between X & Y
⚫ Regression studies the nature of relationship between the
variables so that one may be able to predict the value of one
variable on the basis of another.
 Cause & Effect Relationship
⚫ Correlation does not always assume cause and effect
relationship between two variables.
⚫ Regression clearly expresses the cause and effect relationship between
two variables. The independent variable is the cause and dependent
variable is effect.
 Prediction
⚫ Correlation doesn’t help in making predictions
⚫ Regression enable us to make predictions using regression line
 Symmetric
⚫ Correlation coefficients are symmetrical i.e. rxy = ryx.
⚫ Regression coefficients are not symmetrical i.e. bxy ≠ byx.
 Origin & Scale
⚫ Correlation is independent of the change of origin and scale
⚫ Regression coefficient is independent of change of origin
but not of scale
TYPES OF REGRESSION ANALYSIS
 Simple & Multiple Regression
 Linear & Non Linear Regression
 Partial & Total Regression
SIMPLE LINEAR REGRESSION
REGRESSION LINES
 The regression line shows the average relationship between two variables.
It is also called Line of Best Fit.
 If two variables X & Y are given, then there are two regression lines:
⚫ Regression Line of X on Y
⚫ Regression Line of Y on X
 Nature of Regression Lines
⚫ If r = ±1, then the two regression lines are coincident.
⚫ If r = 0, then the two regression lines intersect each other at
90°
⚫ The nearer the regression lines are to each other, the greater will be the degree of
correlation.
⚫ If regression lines rise from left to right upward, then correlation is positive.
REGRESSION EQUATIONS
REGRESSION COEFFICIENTS
PROPERTIES OF REGRESSION COEFFICIENTS
OBTAINING REGRESSION EQUATIONS
REGRESSION EQUATIONS IN INDIVIDUAL SERIES
USING NORMAL EQUATIONS
REGRESSION EQUATIONS USING REGRESSION
COEFFICIENTS
REGRESSION EQUATIONS USING REGRESSION COEFFICIENTS (USING ACTUAL
VALUES)
REGRESSION EQUATIONS USING REGRESSION COEFFICIENTS (USING DEVIATIONS FROM
ACTUAL VALUES)
REGRESSION EQUATIONS USING REGRESSION COEFFICIENTS (USING DEVIATIONS
FROM ASSUMED MEAN)
REGRESSION EQUATIONS USING REGRESSION COEFFICIENTS (USING STANDARD DEVIATIONS)
SHORTCUT METHOD OF CHECKING REGRESSION EQUATIONS
STANDARD ERROR OF ESTIMATE
THANKYOU

RANDOM SIGNALS ANALYSIS pdf.pdf

  • 1.
    RANDOM SIGNALS ANALYSIS THIRD YEAREXTC 2022-2023 GROUP MEMBERS:- DARSHAN AHER ADNAN SHAIKH RUCHI SHENDAGE
  • 2.
  • 3.
  • 4.
  • 5.
    CORRELATION IN ERGODICPROCESS : The stationary process {X(t)} is said to be correlation ergodic (or ergodic in the correlation), if the process {Y(t)} is mean-ergodic, where Y(t) = X(t+ τ ) . X(t) That is the Stationary Process {X(t)} is correlation ergodic, if Thus to prove that the given Random Process {X(t)} is correlation- ergodic, we have to prove that 1. {X(t)} is stationary and 2.
  • 6.
    Ergodic Power SpectralDensity Function :
  • 7.
    Properties of PowerSpectral Density :
  • 8.
    3. The SpectralDensity Function of a real Random Process is an even Function . 4. The Spectral Density of a Process {X(t)}, real or complex, is a real function of w and non-negative. 5. The Spectral Density and autocorrelation function of a real WSS process form a Fourier cosine transform pair .
  • 9.
  • 10.
    PROPERTIES OF CROSSSPECTRAL DENSITY :
  • 11.
  • 12.
    Definition :- If,for all n, P[ Xn = an/Xn-1 = an-1,Xn-2=an-2…..,X0=0 ] = P [ Xn = an/Xn = an-1, then process [Xn], n = 0,1,2…. Is called a Markov Chain. States of Markov Chain :- (a1,a2,an,….) are called the States of The Markov Chain. Transition Probability Matrix :- When the system changes from ith stage to jth stage with probability Pij , the probability is called transition probability .
  • 13.
  • 17.
    Statistical Learning andIts Applications :
  • 18.
    UTILITY OF REGRESSION Degree & Nature of relationship  Estimation of relationship  Prediction  Useful in Economic & Business Research
  • 19.
    DIFFERENCE BETWEEN CORRELATION& REGRESSION  Degree & Nature of Relationship ⚫ Correlation is a measure of degree of relationship between X & Y ⚫ Regression studies the nature of relationship between the variables so that one may be able to predict the value of one variable on the basis of another.  Cause & Effect Relationship ⚫ Correlation does not always assume cause and effect relationship between two variables. ⚫ Regression clearly expresses the cause and effect relationship between two variables. The independent variable is the cause and dependent variable is effect.
  • 20.
     Prediction ⚫ Correlationdoesn’t help in making predictions ⚫ Regression enable us to make predictions using regression line  Symmetric ⚫ Correlation coefficients are symmetrical i.e. rxy = ryx. ⚫ Regression coefficients are not symmetrical i.e. bxy ≠ byx.  Origin & Scale ⚫ Correlation is independent of the change of origin and scale ⚫ Regression coefficient is independent of change of origin but not of scale
  • 21.
    TYPES OF REGRESSIONANALYSIS  Simple & Multiple Regression  Linear & Non Linear Regression  Partial & Total Regression
  • 22.
  • 23.
    REGRESSION LINES  Theregression line shows the average relationship between two variables. It is also called Line of Best Fit.  If two variables X & Y are given, then there are two regression lines: ⚫ Regression Line of X on Y ⚫ Regression Line of Y on X  Nature of Regression Lines ⚫ If r = ±1, then the two regression lines are coincident. ⚫ If r = 0, then the two regression lines intersect each other at 90° ⚫ The nearer the regression lines are to each other, the greater will be the degree of correlation. ⚫ If regression lines rise from left to right upward, then correlation is positive.
  • 24.
  • 25.
  • 26.
  • 27.
  • 28.
    REGRESSION EQUATIONS ININDIVIDUAL SERIES USING NORMAL EQUATIONS
  • 29.
    REGRESSION EQUATIONS USINGREGRESSION COEFFICIENTS
  • 30.
    REGRESSION EQUATIONS USINGREGRESSION COEFFICIENTS (USING ACTUAL VALUES) REGRESSION EQUATIONS USING REGRESSION COEFFICIENTS (USING DEVIATIONS FROM ACTUAL VALUES)
  • 31.
    REGRESSION EQUATIONS USINGREGRESSION COEFFICIENTS (USING DEVIATIONS FROM ASSUMED MEAN) REGRESSION EQUATIONS USING REGRESSION COEFFICIENTS (USING STANDARD DEVIATIONS)
  • 32.
    SHORTCUT METHOD OFCHECKING REGRESSION EQUATIONS
  • 33.
  • 34.