Introduction to Hydrology, Stream GaugingAmol Inamdar
Introduction to Hydrology, Types of Rain gauges, Factors affecting evaporation and infiltration, Stream gauging, Mass curve, Hyetograph, DAD Curve, Horton's Method, Infiltrometers, fi-index, W-index, Methods of measurement of Discharge of Stream, Area-Velocity Method, Moving Boat Method, Salt concentration method, ADCP, Current meter, River staging
Presented by IWMI's Lal Muthuwatta (Regional Researcher – Hydrological Modeling & Remote Sensing) to a group of European Union (EU) delegations in Asia at a discussion on 'Using research on agriculture climate and water to support sustainable food systems', held at IWMI Headquarters in Colombo, Sri Lanka, on June 8, 2016.
Remote sensing application in agriculture & forestry_Dr Menon A R R (The Kera...India Water Portal
This presentation by Dr A R R Menon, Emeritus scientist, CED on Remote Sensing applications in agriculture and forestry was made at at the Kerala Environment Congress, Trivandrum organised by the Centre for Environment and Development
This presentation will provide the knowledge on measurement of evaporation by using class A evaporation pan. In addition it will give you the knowledge regarding pan coefficient and crop coefficient.
It is based on Journal Paper named
"Mukherjee, M.K.2013, ’Flood Frequency Analysis of River Subernarekha, India, Using Gumbel’s extreme Value Distribution’, IJCER,Vol-3,Issue-7,pp-12-18."
I have studied the journal and make a PPT in the following.
I
Water Quality Monitoring Management Powerpoint Presentation SlidesSlideTeam
Introducing Water Quality Monitoring Management PowerPoint Presentation Slides which will assist in developing, distributing, and managing the optimum use of water resources. By taking advantage of our readily available water testing PPT visuals, discuss the six main indicators of the water quality. This water resource management PPT slide deck can be used by the department of water for analyzing information about water quality and to underpin decisions about water resource management. You can provide an overview of water market size, growth rate, and capital expenditure by using our readily available water quality modeling PPT slideshow. Describe how you can monitor and assess the water quality in order to manage the water resources. You can also showcase the wastewater treatment according to various industry types by utilizing these water quality monitoring PowerPoint slides. Highlight the trends that can influence the water industry in the future. Also, showcase the factors that can affect the performance of the water technology market. Hence, download our ready-to-use assessing water quality PowerPoint presentation and ensure the optimum use of water resources. https://bit.ly/30tFhdE
1. Distribution of Runoff
2. Hydrograph Analysis
a) Hydrograph & Unit Hydrograph
b) S - Hydrograph & Synthetic Unit Hydrograph
3. Computation of Design Discharge
a) Rational Formulae
b) SCS Curve Number Method
4. Flood Frequency Analysis
5. Flood Routing
Changes in the hydrologic cycle due to increase in greenhouse gases cause variations in intensity, duration, and frequency of precipitation events. Quantifying the potential effects of climate change and adapting to them is one way to reduce urban vulnerability. Since rainfall characteristics are often used to design water structures, reviewing and updating rainfall characteristics (i.e., Intensity–Duration–Frequency (IDF) curves) for future climate scenarios is necessary. The present study regards the evaluation of the IDF curves for Four raingauge stations of Bangalore rural : Anugondanahalli, Devanahally, Doddabalapura and Hoskote. Starting from daily rainfall observed data, to define the IDF curves and the extreme values in a smaller time window (2, 5, 10, 15, 30, 60, 120, 720, 1440 minutes), disaggregation techniques of the collected data have been used, in order to generate a synthetic sequence of rainfall, with statistical properties similar to the recorded data. Then, the rainfall pattern of the Four raingauge stations was analyzed and IDF curves were evaluated
Using provided long term data, generated a quantitative and visual data analysis to better understand the current drought and water supply crisis affecting Marin County in 2021
How to Make a Field invisible in Odoo 17Celine George
It is possible to hide or invisible some fields in odoo. Commonly using “invisible” attribute in the field definition to invisible the fields. This slide will show how to make a field invisible in odoo 17.
Read| The latest issue of The Challenger is here! We are thrilled to announce that our school paper has qualified for the NATIONAL SCHOOLS PRESS CONFERENCE (NSPC) 2024. Thank you for your unwavering support and trust. Dive into the stories that made us stand out!
Unit 8 - Information and Communication Technology (Paper I).pdfThiyagu K
This slides describes the basic concepts of ICT, basics of Email, Emerging Technology and Digital Initiatives in Education. This presentations aligns with the UGC Paper I syllabus.
Model Attribute Check Company Auto PropertyCeline George
In Odoo, the multi-company feature allows you to manage multiple companies within a single Odoo database instance. Each company can have its own configurations while still sharing common resources such as products, customers, and suppliers.
Biological screening of herbal drugs: Introduction and Need for
Phyto-Pharmacological Screening, New Strategies for evaluating
Natural Products, In vitro evaluation techniques for Antioxidants, Antimicrobial and Anticancer drugs. In vivo evaluation techniques
for Anti-inflammatory, Antiulcer, Anticancer, Wound healing, Antidiabetic, Hepatoprotective, Cardio protective, Diuretics and
Antifertility, Toxicity studies as per OECD guidelines
Francesca Gottschalk - How can education support child empowerment.pptxEduSkills OECD
Francesca Gottschalk from the OECD’s Centre for Educational Research and Innovation presents at the Ask an Expert Webinar: How can education support child empowerment?
The Roman Empire A Historical Colossus.pdfkaushalkr1407
The Roman Empire, a vast and enduring power, stands as one of history's most remarkable civilizations, leaving an indelible imprint on the world. It emerged from the Roman Republic, transitioning into an imperial powerhouse under the leadership of Augustus Caesar in 27 BCE. This transformation marked the beginning of an era defined by unprecedented territorial expansion, architectural marvels, and profound cultural influence.
The empire's roots lie in the city of Rome, founded, according to legend, by Romulus in 753 BCE. Over centuries, Rome evolved from a small settlement to a formidable republic, characterized by a complex political system with elected officials and checks on power. However, internal strife, class conflicts, and military ambitions paved the way for the end of the Republic. Julius Caesar’s dictatorship and subsequent assassination in 44 BCE created a power vacuum, leading to a civil war. Octavian, later Augustus, emerged victorious, heralding the Roman Empire’s birth.
Under Augustus, the empire experienced the Pax Romana, a 200-year period of relative peace and stability. Augustus reformed the military, established efficient administrative systems, and initiated grand construction projects. The empire's borders expanded, encompassing territories from Britain to Egypt and from Spain to the Euphrates. Roman legions, renowned for their discipline and engineering prowess, secured and maintained these vast territories, building roads, fortifications, and cities that facilitated control and integration.
The Roman Empire’s society was hierarchical, with a rigid class system. At the top were the patricians, wealthy elites who held significant political power. Below them were the plebeians, free citizens with limited political influence, and the vast numbers of slaves who formed the backbone of the economy. The family unit was central, governed by the paterfamilias, the male head who held absolute authority.
Culturally, the Romans were eclectic, absorbing and adapting elements from the civilizations they encountered, particularly the Greeks. Roman art, literature, and philosophy reflected this synthesis, creating a rich cultural tapestry. Latin, the Roman language, became the lingua franca of the Western world, influencing numerous modern languages.
Roman architecture and engineering achievements were monumental. They perfected the arch, vault, and dome, constructing enduring structures like the Colosseum, Pantheon, and aqueducts. These engineering marvels not only showcased Roman ingenuity but also served practical purposes, from public entertainment to water supply.
Palestine last event orientationfvgnh .pptxRaedMohamed3
An EFL lesson about the current events in Palestine. It is intended to be for intermediate students who wish to increase their listening skills through a short lesson in power point.
Macroeconomics- Movie Location
This will be used as part of your Personal Professional Portfolio once graded.
Objective:
Prepare a presentation or a paper using research, basic comparative analysis, data organization and application of economic information. You will make an informed assessment of an economic climate outside of the United States to accomplish an entertainment industry objective.
Embracing GenAI - A Strategic ImperativePeter Windle
Artificial Intelligence (AI) technologies such as Generative AI, Image Generators and Large Language Models have had a dramatic impact on teaching, learning and assessment over the past 18 months. The most immediate threat AI posed was to Academic Integrity with Higher Education Institutes (HEIs) focusing their efforts on combating the use of GenAI in assessment. Guidelines were developed for staff and students, policies put in place too. Innovative educators have forged paths in the use of Generative AI for teaching, learning and assessments leading to pockets of transformation springing up across HEIs, often with little or no top-down guidance, support or direction.
This Gasta posits a strategic approach to integrating AI into HEIs to prepare staff, students and the curriculum for an evolving world and workplace. We will highlight the advantages of working with these technologies beyond the realm of teaching, learning and assessment by considering prompt engineering skills, industry impact, curriculum changes, and the need for staff upskilling. In contrast, not engaging strategically with Generative AI poses risks, including falling behind peers, missed opportunities and failing to ensure our graduates remain employable. The rapid evolution of AI technologies necessitates a proactive and strategic approach if we are to remain relevant.
June 3, 2024 Anti-Semitism Letter Sent to MIT President Kornbluth and MIT Cor...Levi Shapiro
Letter from the Congress of the United States regarding Anti-Semitism sent June 3rd to MIT President Sally Kornbluth, MIT Corp Chair, Mark Gorenberg
Dear Dr. Kornbluth and Mr. Gorenberg,
The US House of Representatives is deeply concerned by ongoing and pervasive acts of antisemitic
harassment and intimidation at the Massachusetts Institute of Technology (MIT). Failing to act decisively to ensure a safe learning environment for all students would be a grave dereliction of your responsibilities as President of MIT and Chair of the MIT Corporation.
This Congress will not stand idly by and allow an environment hostile to Jewish students to persist. The House believes that your institution is in violation of Title VI of the Civil Rights Act, and the inability or
unwillingness to rectify this violation through action requires accountability.
Postsecondary education is a unique opportunity for students to learn and have their ideas and beliefs challenged. However, universities receiving hundreds of millions of federal funds annually have denied
students that opportunity and have been hijacked to become venues for the promotion of terrorism, antisemitic harassment and intimidation, unlawful encampments, and in some cases, assaults and riots.
The House of Representatives will not countenance the use of federal funds to indoctrinate students into hateful, antisemitic, anti-American supporters of terrorism. Investigations into campus antisemitism by the Committee on Education and the Workforce and the Committee on Ways and Means have been expanded into a Congress-wide probe across all relevant jurisdictions to address this national crisis. The undersigned Committees will conduct oversight into the use of federal funds at MIT and its learning environment under authorities granted to each Committee.
• The Committee on Education and the Workforce has been investigating your institution since December 7, 2023. The Committee has broad jurisdiction over postsecondary education, including its compliance with Title VI of the Civil Rights Act, campus safety concerns over disruptions to the learning environment, and the awarding of federal student aid under the Higher Education Act.
• The Committee on Oversight and Accountability is investigating the sources of funding and other support flowing to groups espousing pro-Hamas propaganda and engaged in antisemitic harassment and intimidation of students. The Committee on Oversight and Accountability is the principal oversight committee of the US House of Representatives and has broad authority to investigate “any matter” at “any time” under House Rule X.
• The Committee on Ways and Means has been investigating several universities since November 15, 2023, when the Committee held a hearing entitled From Ivory Towers to Dark Corners: Investigating the Nexus Between Antisemitism, Tax-Exempt Universities, and Terror Financing. The Committee followed the hearing with letters to those institutions on January 10, 202
Introduction to AI for Nonprofits with Tapp NetworkTechSoup
Dive into the world of AI! Experts Jon Hill and Tareq Monaur will guide you through AI's role in enhancing nonprofit websites and basic marketing strategies, making it easy to understand and apply.
Home assignment II on Spectroscopy 2024 Answers.pdf
Rainfall Frequency Analysis.pptx
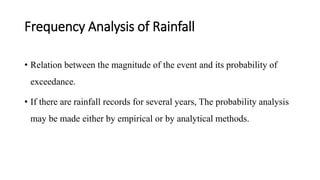
1. Frequency Analysis of Rainfall
• Relation between the magnitude of the event and its probability of
exceedance.
• If there are rainfall records for several years, The probability analysis
may be made either by empirical or by analytical methods.
2. Probability P of an event equals to or exceeds,
and recurrence interval T
The probability P of an event equals to or exceeds, and recurrence interval T (also
known as the return period) of the storm magnitude is given by one of the following
equations:
Method Probability P Recurrence interval T
Kimball’s method 𝑃 =
𝑚
𝑛+1
𝑇 =
𝑛+1
𝑚
California method
(1923),
𝑇 =
𝑚
𝑛
𝑇 =
𝑛
𝑚
Hazen’s method (1930)
𝑇 =
𝑚−
1
2
𝑛
𝑇 =
𝑛
𝑚−
1
2
3. Example 6:
The annual rainfall at a place for a period of 21 years is given below.
Year Rainfall (cm) Year Rainfall (cm)
1950 50 1960 40
1951 60 1961 56
1952 40 1962 52
1953 27 1963 42
1954 30 1964 38
1955 38 1965 27
1956 70 1966 40
1957 60 1967 100
1958 35 1968 90
1959 55 1969 43
1970 33
4. Example Cont’d
Draw the rainfall frequency curve and determine:
a) the rainfall of 5-year and 20-year recurrence, interval
b)the rainfall which occurs 50% of the times
c) the rainfall of probability of 0.75
d)the recurrence interval of rainfall of 75 cm and its probability of
occurrence.
7. Solution
1. From the frequency-curve, the required values can be obtained as
• T = 5 years, Rainfall = 65 cm.
• T = 20 years, Rainfall = 97.5 cm
1. The rainfall which occurs 50% of the times,
• For F = 50%, P = 0.5 and T = 1/P = 2
• From the graph Rainfall = 43 cm
8. Solution
3. The rainfall of probability of 0.75
• for probability of 0.75, Return period T = 1/P =1/0.75 =1.33, for which
rainfall = 34 cm
4. The recurrence interval of rainfall of 75 cm and its probability of occurrence
• from the graph, the recurrence interval = 8.2 years and P = 1/T, P = 1/8.2 =
0.122