Download as PDF, PPTX

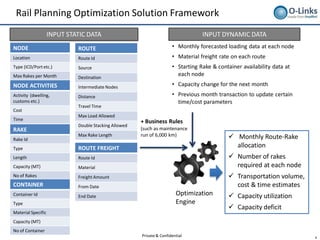
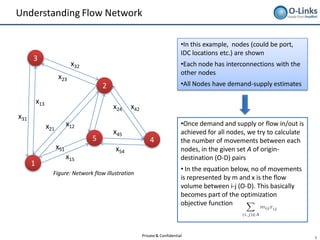

The document discusses railroad planning and optimization for freight operations in India. It notes the large scale of freight transportation by rail and the need to maximize efficiency given high capital costs. The solution framework involves collecting static and dynamic data on nodes, routes, rakes, and containers then using an optimization engine to allocate routes, rakes, and volumes monthly to maximize capacity utilization and minimize empty runs while meeting business rules. It provides an example network flow illustration to explain modeling transportation flows between nodes.


