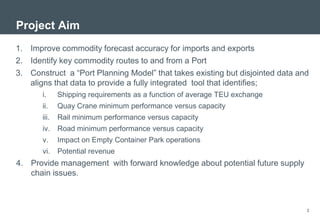
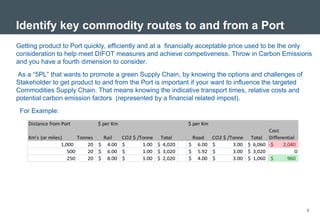
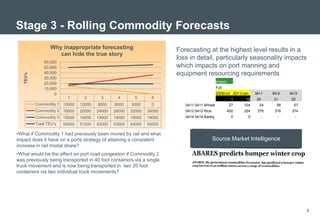
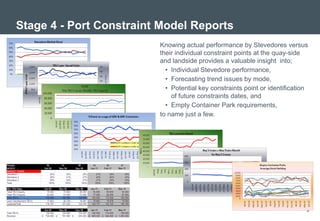
A ContainerPort Supply Chain Project –
Status update


Mark Deacon
Mstr SCM
Presentation Aim & Disclaimer
 The aim of this presentation is to provide a status update & help illustrate from a
 conceptual perspective, how by applying “Fit-for-Purpose” contemporary Supply Chain
 principles can providing an insight to what I call a “5PL” Organisation i.e. one with no
 direct responsibility for container movements but certainly one that can influence
 container movement productivity


 As in my preceding presentation the data I’ll present in this PowerPoint is of a fictitious
 nature and false so no linkage should be inferred between presented graphs or tables
 to any actual Port location or stakeholder performance. However the data presented
 does serve the purpose of illustrating the benefits that constructing a Port S&OP model
 can be in order to garner discussions with various stakeholders and the various
 disciplines within a Port related businesses.


                                                                                          2
Project Aim
1. Improve commodity forecast accuracy for imports and exports
2. Identify key commodity routes to and from a Port
3. Construct a “Port Planning Model” that takes existing but disjointed data and
   aligns that data to provide a fully integrated tool that identifies;
       i.     Shipping requirements as a function of average TEU exchange
       ii.    Quay Crane minimum performance versus capacity
       iii.   Rail minimum performance versus capacity
       iv.    Road minimum performance versus capacity
       v.     Impact on Empty Container Park operations
       vi.    Potential revenue
4. Provide management with forward knowledge about potential future supply
   chain issues.


                                                                               3
Improving commodity forecast accuracy for Imports
and Exports
Various statistical techniques exist to forecast future trends based on past results but the trick is to
select a methodology that is not only relatively accurate, but makes sense (conceptually to those who
don’t understand the difference between 1 standard deviation and the fact that MSE isn’t related to
Chinese take away, so its about “Fit for Purpose” and “Multivariate Decompositional Analysis” is fun !


                                                                                                      4
Identify key commodity routes to and from a Port
Getting product to Port quickly, efficiently and at a financially acceptable price used to be the only
consideration to help meet DIFOT measures and achieve competiveness. Throw in Carbon Emissions
and you have a fourth dimension to consider.
As a “5PL” that wants to promote a green Supply Chain, by knowing the options and challenges of
Stakeholder to get product to and from the Port is important if your want to influence the targeted
Commodities Supply Chain. That means knowing the indicative transport times, relative costs and
potential carbon emission factors (represented by a financial related impost).
 For Example:
    Distance from Port        $ per Km                          $ per Km
                                                                                            Cost
    Km's (or miles)      Tonnes  Rail    CO2 $ /Tonne Total      Road  CO2 $ /Tonne Total Differential
                  1,000      20 $ 4.00   $       1.00 $ 4,020   $ 6.00 $       3.00 $ 6,060 -$   2,040
                     500     20 $ 6.00   $       1.00 $ 3,020   $ 5.92 $       3.00 $ 3,020            0
                     250     20 $ 8.00   $       1.00 $ 2,020   $ 4.00 $       3.00 $ 1,060 $      960


                                                                                                           5
3 .1 - Shipping requirements as a function of average
TEU exchange


Identifying the Vessel TEU exchange rate trends enables both:
1. Expected vessel visits to be calculated, ( & hence resource requirements such as berth occupancy),
2. Required discharge rates if time is a factor and,
3. Revenue in the form of Wharfage , Navigation, Pilotage and other(?)


                                                                                                        6
Stage 2 - CAD or GIS mapping
                               Illustrating where the commodity is imported
                               to or exported from by region helps to ;
                               1. Provide data in an easy comprehendible
                                  format
                               2. Assist in the development of supply
                                  strategies that may influence modal
                                  choice for moving product to and from
                                  the port
                               3. Identify contestable markets by mode
                               4. Estimate transportation costs and
                                  delivery times.


                                                                         7
Stage 3 - Rolling Commodity Forecasts
                  Why inappropriate forecasting                          Forecasting at the highest level results in a
                     can hide the true story
                                                                         loss in detail, particularly seasonality impacts
               60,000
               50,000                                                    which impacts on port manning and
               40,000                                                    equipment resourcing requirements
   TEU's


               30,000
               20,000                                                                          Import
               10,000                                                                          Full
                    0                                                                          2009/Jul 2011/Jan    M+1   M+2   M+3
                           1       2       3       4       5       6                                      1    19   20    21    22
           Commodity 1 15000     12000   9000    6000    3000     0         0411 0411 Wheat              27   104    54    56    57
           Commodity 2 16000     20000   24000   28000   32000   36000      0412 0412 Rice              492   324   378   376   374
           Commodity 3 19000     19000   19000   19000   19000   19000      0414 0414 Barley              0     0     -     -     -
           Total TEU's   50000   51000   52000   53000   54000   55000

•What if Commodity 1 had previously been moved by rail and what
impact does it have on a ports strategy of attaining a consistent                            Source Market Intelligence
increase in rail modal share?
•What would be the effect on port road congestion if Commodity 2
was previously being transported in 40 foot containers via a single
truck movement and is now being transported in two 20 foot
containers via two individual truck movements?


                                                                                                                                      8
Stage 4 - Port Constraint Model Reports
                         Knowing actual performance by Stevedores versus
                         their individual constraint points at the quay-side
                         and landside provides a valuable insight into;
                           • Individual Stevedore performance,
                           • Forecasting trend issues by mode,
                           • Potential key constraints point or identification
                             of future constraints dates, and
                           • Empty Container Park requirements,
                         to name just a few.


                                                                             9
Stage 5 – Financial Impact

 The aim is to link revenue data associated with overall TEU monthly
 forecasts.

 By rolling up example charges such;
 • Navigation services
 • Pilotage
 • Container size
 you can apply at a high level, an indicative financial revenue factor


                                                                                Future

                                                                         Past


                                                                                         10
Stage 6 & 7 – Benchmarking and Reports
Stage 6 – Develop Port Benchmarking exercises targeting supply chain initiatives with other ports;
     • Are S&OP processes in place
     • Do regular meetings occur with key commodity stakeholders
     • Are vessel size impacts taken up in future strategies
     • Is a landside improvement strategy in place
     • What frequency do you meet with key logistics organisations

Stage 7 -Publication of a monthly “Dashboard” Supply Chain Management report.
  Purpose is to develop a simple but meaningful “traffic light” report that provides a high level
  indicative “health measure” of the overall Port supply chain;
  For example:
     • Commodity forecast accuracy by %
     • % of Commodity modal routes mapped
     • Modal splits by % versus target
     • Operational levels versus capacity for quay side, rail & road
     • Other


                                                                                                     11
Desired Outcome
 Supply savvy organisations understand the “value-add” an efficient supply chain will
 bring to an organisation.


  As outlined in this presentation there are significant benefits to government port
 organisations applying contemporary supply principles that provide significantly
 improved task visibility towards understanding stakeholder interactions and port modal
 capacities.


                                                                                        12
Thank you

Supply Chain Project Status Update 010911 Mcd

  • 1.
    A ContainerPort SupplyChain Project – Status update Mark Deacon Mstr SCM
  • 2.
    Presentation Aim &Disclaimer The aim of this presentation is to provide a status update & help illustrate from a conceptual perspective, how by applying “Fit-for-Purpose” contemporary Supply Chain principles can providing an insight to what I call a “5PL” Organisation i.e. one with no direct responsibility for container movements but certainly one that can influence container movement productivity As in my preceding presentation the data I’ll present in this PowerPoint is of a fictitious nature and false so no linkage should be inferred between presented graphs or tables to any actual Port location or stakeholder performance. However the data presented does serve the purpose of illustrating the benefits that constructing a Port S&OP model can be in order to garner discussions with various stakeholders and the various disciplines within a Port related businesses. 2
  • 3.
    Project Aim 1. Improvecommodity forecast accuracy for imports and exports 2. Identify key commodity routes to and from a Port 3. Construct a “Port Planning Model” that takes existing but disjointed data and aligns that data to provide a fully integrated tool that identifies; i. Shipping requirements as a function of average TEU exchange ii. Quay Crane minimum performance versus capacity iii. Rail minimum performance versus capacity iv. Road minimum performance versus capacity v. Impact on Empty Container Park operations vi. Potential revenue 4. Provide management with forward knowledge about potential future supply chain issues. 3
  • 4.
    Improving commodity forecastaccuracy for Imports and Exports Various statistical techniques exist to forecast future trends based on past results but the trick is to select a methodology that is not only relatively accurate, but makes sense (conceptually to those who don’t understand the difference between 1 standard deviation and the fact that MSE isn’t related to Chinese take away, so its about “Fit for Purpose” and “Multivariate Decompositional Analysis” is fun ! 4
  • 5.
    Identify key commodityroutes to and from a Port Getting product to Port quickly, efficiently and at a financially acceptable price used to be the only consideration to help meet DIFOT measures and achieve competiveness. Throw in Carbon Emissions and you have a fourth dimension to consider. As a “5PL” that wants to promote a green Supply Chain, by knowing the options and challenges of Stakeholder to get product to and from the Port is important if your want to influence the targeted Commodities Supply Chain. That means knowing the indicative transport times, relative costs and potential carbon emission factors (represented by a financial related impost). For Example: Distance from Port $ per Km $ per Km Cost Km's (or miles) Tonnes Rail CO2 $ /Tonne Total Road CO2 $ /Tonne Total Differential 1,000 20 $ 4.00 $ 1.00 $ 4,020 $ 6.00 $ 3.00 $ 6,060 -$ 2,040 500 20 $ 6.00 $ 1.00 $ 3,020 $ 5.92 $ 3.00 $ 3,020 0 250 20 $ 8.00 $ 1.00 $ 2,020 $ 4.00 $ 3.00 $ 1,060 $ 960 5
  • 6.
    3 .1 -Shipping requirements as a function of average TEU exchange Identifying the Vessel TEU exchange rate trends enables both: 1. Expected vessel visits to be calculated, ( & hence resource requirements such as berth occupancy), 2. Required discharge rates if time is a factor and, 3. Revenue in the form of Wharfage , Navigation, Pilotage and other(?) 6
  • 7.
    Stage 2 -CAD or GIS mapping Illustrating where the commodity is imported to or exported from by region helps to ; 1. Provide data in an easy comprehendible format 2. Assist in the development of supply strategies that may influence modal choice for moving product to and from the port 3. Identify contestable markets by mode 4. Estimate transportation costs and delivery times. 7
  • 8.
    Stage 3 -Rolling Commodity Forecasts Why inappropriate forecasting Forecasting at the highest level results in a can hide the true story loss in detail, particularly seasonality impacts 60,000 50,000 which impacts on port manning and 40,000 equipment resourcing requirements TEU's 30,000 20,000 Import 10,000 Full 0 2009/Jul 2011/Jan M+1 M+2 M+3 1 2 3 4 5 6 1 19 20 21 22 Commodity 1 15000 12000 9000 6000 3000 0 0411 0411 Wheat 27 104 54 56 57 Commodity 2 16000 20000 24000 28000 32000 36000 0412 0412 Rice 492 324 378 376 374 Commodity 3 19000 19000 19000 19000 19000 19000 0414 0414 Barley 0 0 - - - Total TEU's 50000 51000 52000 53000 54000 55000 •What if Commodity 1 had previously been moved by rail and what impact does it have on a ports strategy of attaining a consistent Source Market Intelligence increase in rail modal share? •What would be the effect on port road congestion if Commodity 2 was previously being transported in 40 foot containers via a single truck movement and is now being transported in two 20 foot containers via two individual truck movements? 8
  • 9.
    Stage 4 -Port Constraint Model Reports Knowing actual performance by Stevedores versus their individual constraint points at the quay-side and landside provides a valuable insight into; • Individual Stevedore performance, • Forecasting trend issues by mode, • Potential key constraints point or identification of future constraints dates, and • Empty Container Park requirements, to name just a few. 9
  • 10.
    Stage 5 –Financial Impact The aim is to link revenue data associated with overall TEU monthly forecasts. By rolling up example charges such; • Navigation services • Pilotage • Container size you can apply at a high level, an indicative financial revenue factor Future Past 10
  • 11.
    Stage 6 &7 – Benchmarking and Reports Stage 6 – Develop Port Benchmarking exercises targeting supply chain initiatives with other ports; • Are S&OP processes in place • Do regular meetings occur with key commodity stakeholders • Are vessel size impacts taken up in future strategies • Is a landside improvement strategy in place • What frequency do you meet with key logistics organisations Stage 7 -Publication of a monthly “Dashboard” Supply Chain Management report. Purpose is to develop a simple but meaningful “traffic light” report that provides a high level indicative “health measure” of the overall Port supply chain; For example: • Commodity forecast accuracy by % • % of Commodity modal routes mapped • Modal splits by % versus target • Operational levels versus capacity for quay side, rail & road • Other 11
  • 12.
    Desired Outcome Supplysavvy organisations understand the “value-add” an efficient supply chain will bring to an organisation. As outlined in this presentation there are significant benefits to government port organisations applying contemporary supply principles that provide significantly improved task visibility towards understanding stakeholder interactions and port modal capacities. 12
  • 13.