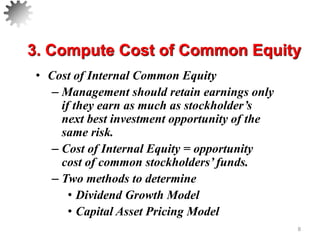
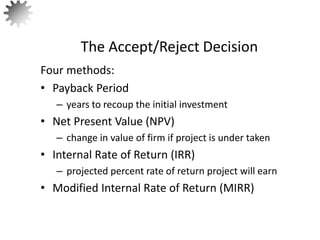
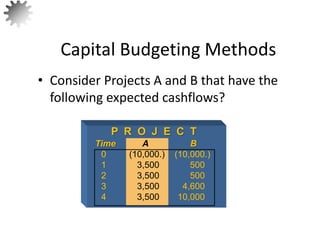
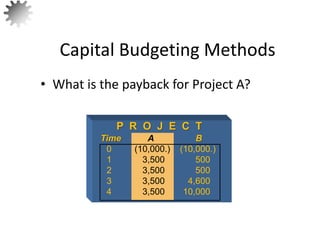
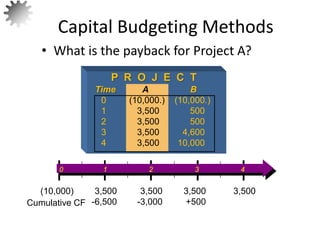
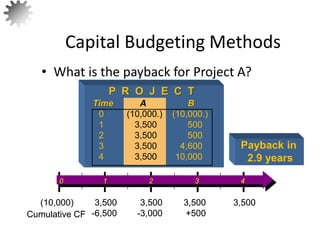
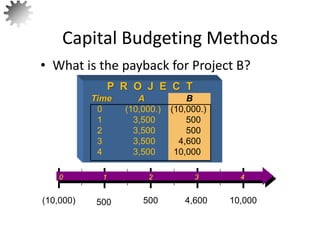
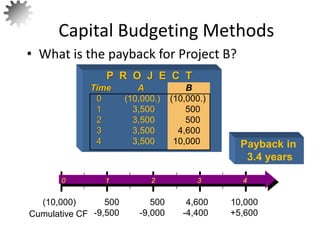
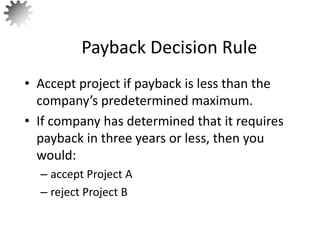
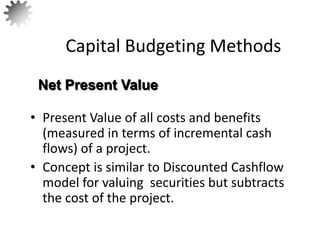
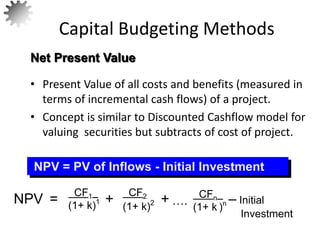
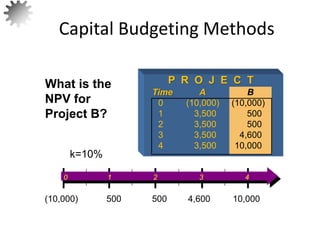
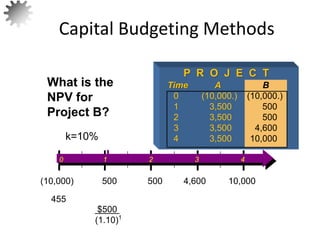
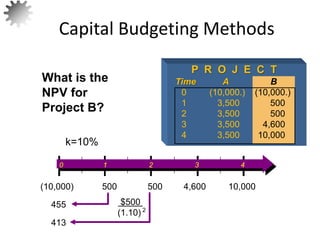
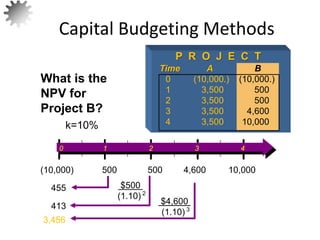
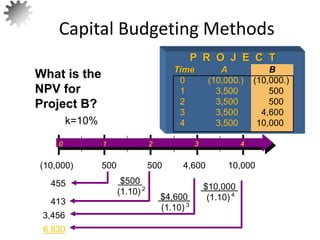
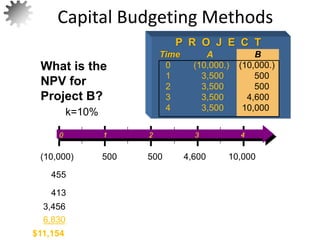
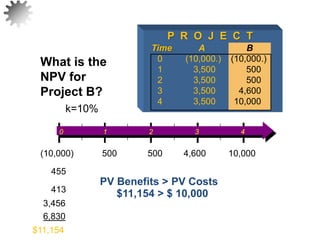
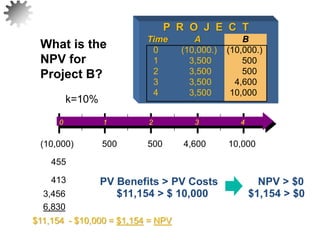
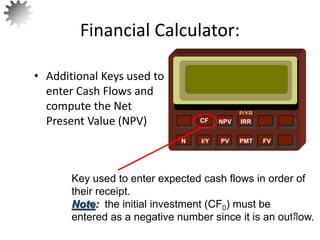
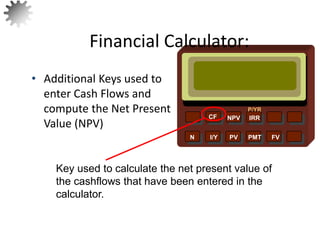
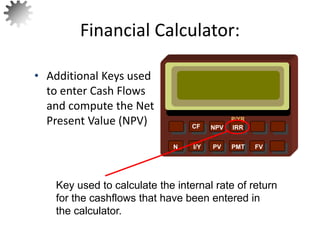
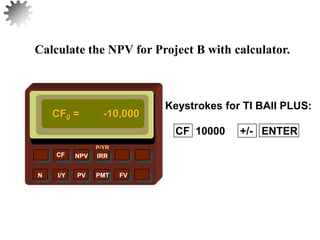
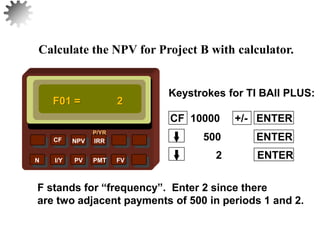
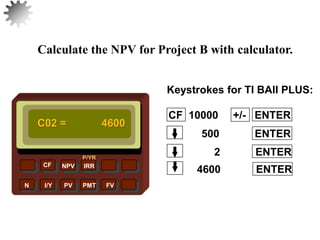
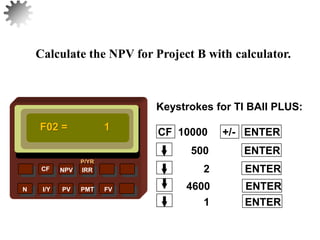
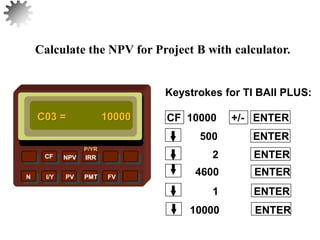
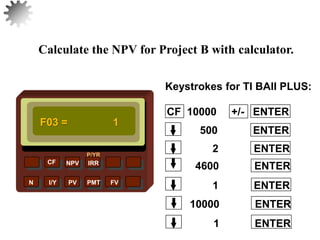
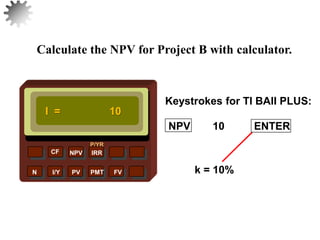
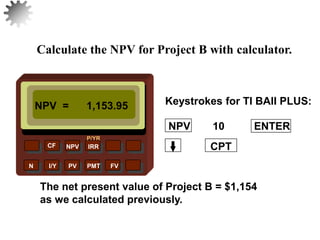
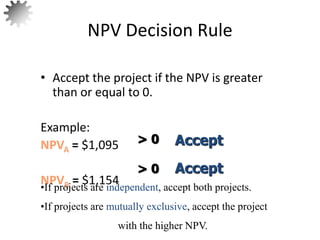
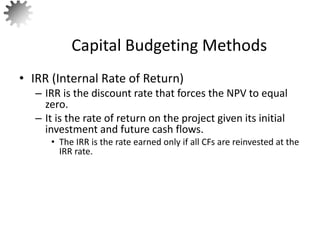
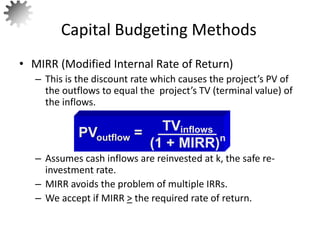
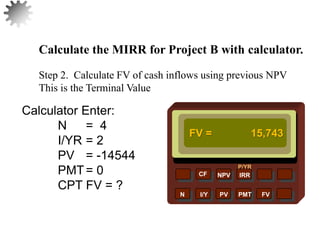
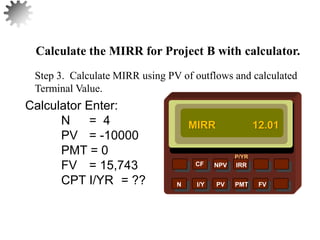
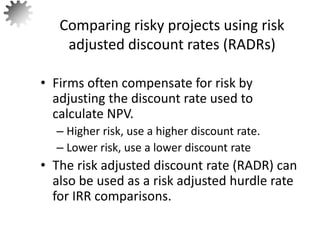
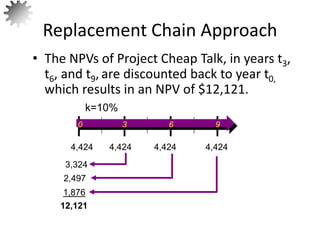
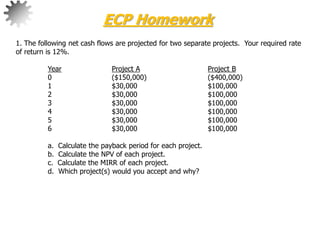
The document discusses methods for evaluating capital investment projects, including payback period, net present value (NPV), internal rate of return (IRR), and modified internal rate of return (MIRR). It provides examples of calculating payback periods for two projects (Projects A and B) and explains that Project A would be accepted while Project B would be rejected if the company's maximum payback period is three years. The document also defines NPV as the present value of all cash flows from a project less the initial investment, similar to how discounted cash flow is used to value securities.


![• Step 3: Find the Standard Deviation of the New
Portfolio (Existing plus Proposed).
– Assume the proposed is uncorrelated with the
existing project. rxy = 0
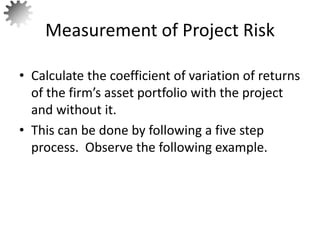
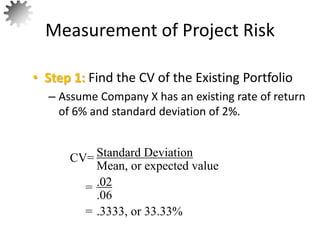
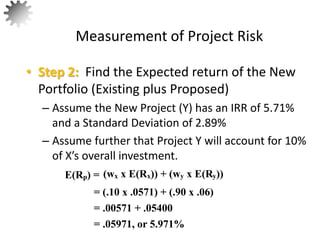
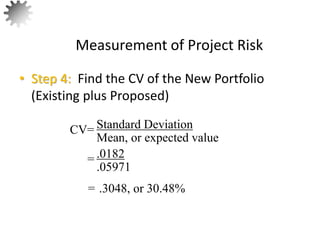
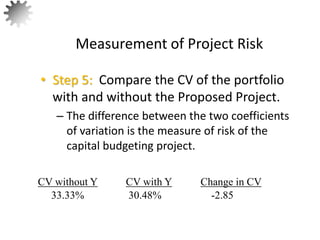
Measurement of Project Risk
58
[wx
2σx
2 + wy
2σy
2 + 2wxwyrxyσxσy]1/2
= [(.102)(.02892) + (.902)(.022) + (2)(.10)(.90)(0.0)(.0289)(02)]1/2
= [(.01)(.000835) + (.81)(.0004) + 0]1/2
= .0182, or 1.82%
= [.00000835 + .000324]1/2
= [.00033235]1/2
σp =](https://image.slidesharecdn.com/quiz31-220708062425-04b7b9a7/85/QUIZ3-1-ppt-84-320.jpg)


![Chapter 3 Introduction to cost_of_capital[1].ppt](https://cdn.slidesharecdn.com/ss_thumbnails/ch3costofcapital1-250903052809-c6964923-thumbnail.jpg?width=640&height=640&fit=bounds)


