SlideShare a Scribd company logo
10 - 1
Copyright © 2001 by Harcourt, Inc. All rights reserved.
 Capital components: debt, preferred stock,
and common stock.
 Any increase in total assets must be financed
by an increase in one or more of these capital
components
 Kd: the interest rate on the firm’s new debt
Kps: the cost of preferred stock
Ks: the cost of retained earnings
Ke:the cost of common equity (equity obtained
by issuing new common stock as apposed to
retaining eanings
10 - 2
Copyright © 2001 by Harcourt, Inc. All rights reserved.
1. The cost of debt
Kd(1-T) is the after tax cost of debt. The
relevant cost of new debt, taking into
account the tax deductibility of interest.
In effect, the government pays part of the
cost of debt because interest is
deductible.
Note that the cost of debt is the interest
rate on new debt, not the interest rate
paid on existing or old debt.
10 - 3
Copyright © 2001 by Harcourt, Inc. All rights reserved.
A 15-year, 12% semiannual bond sells
for $1,153.72. What’s kd?
60 60 + 1,000
60
0 1 2 30
i = ?
30 -1153.72 60 1000
5.0% x 2 = kd = 10%
N I/YR PV FV
PMT
-1,153.72
...
INPUTS
OUTPUT
10 - 4
Copyright © 2001 by Harcourt, Inc. All rights reserved.
Component Cost of Debt
Interest is tax deductible, so
kd AT = kd BT(1 – T)
= 10%(1 – 0.40) = 6%.
10 - 5
Copyright © 2001 by Harcourt, Inc. All rights reserved.
2. The cost of preferred stock (Kp)
The rate of return investors require on the
firm’s preferred stock.
Preferred stock is a perpetuity that pays a
fixed dividend (Dp) forever.
Kp = Preferred dividend / the current price
of the preferred stock
10 - 6
Copyright © 2001 by Harcourt, Inc. All rights reserved.
What’s the cost of preferred stock?
Pp = $111.10; $10 dividend/share
Use this formula:
%.
0
.
9
090
.
0
10
.
111
$
10
$
P
D
k
p
p
p 



10 - 7
Copyright © 2001 by Harcourt, Inc. All rights reserved.
Note:
Preferred dividends are not tax
deductible, so no tax adjustment.
Just kp.
Nominal kp is used.
Our calculation ignores flotation
costs.
10 - 8
Copyright © 2001 by Harcourt, Inc. All rights reserved.
Why is there a cost for retained
earnings?
Earnings can be reinvested or paid
out as dividends.
Investors could buy other securities,
earn a return.
Thus, there is an opportunity cost if
earnings are retained.
10 - 9
Copyright © 2001 by Harcourt, Inc. All rights reserved.
Opportunity cost: The return
stockholders could earn on
alternative investments of equal risk.
They could buy similar stocks and
earn ks. So, ks is the cost of retained
earnings. The rate of return required by
stockholders on a firm’s common stock
10 - 10
Copyright © 2001 by Harcourt, Inc. All rights reserved.
Three ways to determine cost of
common equity, ks:
1. CAPM: ks = kRF + (kM – kRF)b.
2. The bond-yield plus risk-premium approach:
Ks= bond yield + firm’s risk premium
firms with risky, low-rated, and consequently
high-interest-rate debt will also have risky, high-
cost equity. The risk premium over a firm’s own
bond yield has generally ranged from 3 to 5
percentage.
10 - 11
Copyright © 2001 by Harcourt, Inc. All rights reserved.
3. Discount Cash Flow model
(Constant dividend growth model)
Ks = (D1/Po) + g
How to estimate g?
g = (1- dividend pay out ratio)*ROE
10 - 12
Copyright © 2001 by Harcourt, Inc. All rights reserved.
What’s the cost of common equity
based on the CAPM?
kRF = 7%, RPM = 6%, b = 1.2.
ks = kRF + (kM – kRF )b.
= 7.0% + (6.0%)1.2 = 14.2%.
10 - 13
Copyright © 2001 by Harcourt, Inc. All rights reserved.
What’s the DCF cost of common
equity, ks? Given: D0 = $4.19;
P0 = $50; g = 5%.
D1
P0
D0(1 + g)
P0
$4.19(1.05)
$50
ks = + g = + g
= + 0.05
= 0.088 + 0.05
= 13.8%.
10 - 14
Copyright © 2001 by Harcourt, Inc. All rights reserved.
Suppose the company has been
earning 15% on equity (ROE = 15%)
and retaining 35% (dividend payout =
65%), and this situation is expected to
continue.
What’s the expected future g?
10 - 15
Copyright © 2001 by Harcourt, Inc. All rights reserved.
Retention growth rate:
g = (1 – Payout)(ROE) = 0.35(15%)
= 5.25%.
Here (1 – Payout) = Fraction retained.
10 - 16
Copyright © 2001 by Harcourt, Inc. All rights reserved.
Find ks using the own-bond-yield-plus-
risk-premium method.
(kd = 10%, RP = 4%.)
This RP  CAPM RP.
Produces ballpark estimate of ks.
ks = kd + RP
= 10.0% + 4.0% = 14.0%
10 - 17
Copyright © 2001 by Harcourt, Inc. All rights reserved.
What’s a reasonable final estimate of ks?
Method Estimate
CAPM 14.2%
DCF 13.8%
kd + RP 14.0%
Average 14.0%
10 - 18
Copyright © 2001 by Harcourt, Inc. All rights reserved.
1. When a company issues new common
stock they also have to pay flotation costs
to the underwriter.
2. Issuing new common stock may send a
negative signal to the capital markets,
which may depress stock price.
Why is the cost of retained earnings
(ks) cheaper than the cost of issuing
new common stock (ke)?
10 - 19
Copyright © 2001 by Harcourt, Inc. All rights reserved.
Two approaches that can be used to
account for flotation costs:
Include the flotation costs as part of the
project’s up-front cost. This reduces the
project’s estimated return.
Adjust the cost of capital to include
flotation costs. This is most commonly
done by incorporating flotation costs in
the DCF model.
10 - 20
Copyright © 2001 by Harcourt, Inc. All rights reserved.
Ke = [D1/Po(1-F) ] + g
F is the percentage flotation cost incurred in
selling the new stock.
So, Po (1-F) is the net price per share
received by the company.
10 - 21
Copyright © 2001 by Harcourt, Inc. All rights reserved.
New common, F = 15%:
g
)
F
1
(
P
)
g
1
(
D
k
0
0
e




 
 
%.
4
.
15
%
0
.
5
50
.
42
$
40
.
4
$
%
0
.
5
15
.
0
1
50
$
05
.
1
19
.
4
$






10 - 22
Copyright © 2001 by Harcourt, Inc. All rights reserved.
 Because of flotation costs, dollars raised by
selling new stock must “work harder” than
dollars raised by retaining earnings.
Moreover, since no flotation costs are
involved, retained earnings have a lower cost
than new stock.
 Therefore, the firms should utilize retained
earnings to the extent possible to avoid the
costs of new common stock.
 However, if a firm has more good investment
opportunities, issuing new common stock is
necessary.
10 - 23
Copyright © 2001 by Harcourt, Inc. All rights reserved.
The retained earnings breakpoint represents
the total amount of financing that can be
raised before the firm is forced to sell new
common stock.
Retained earnings breakpoint
= addition to retained earnings/equity fraction
10 - 24
Copyright © 2001 by Harcourt, Inc. All rights reserved.
E.g) Suppose a firm estimates its
earnings to be $100M next year and
has a payout ratio of 40%. Its capital
structure consists of 45% debt, 2%
preferred, and 53% equity.
The break point will be $60M/0.53 =
$113.2M; After the firm has raised
total capital of $113.2M, the firm will
be forced to issue new common
stock.
10 - 25
Copyright © 2001 by Harcourt, Inc. All rights reserved.
Comments about flotation costs:
Flotation costs depend on the risk of
the firm and the type of capital being
raised.
The flotation costs are highest for
common equity. However, since
most firms issue equity infrequently,
the per-project cost is fairly small.
We will frequently ignore flotation
costs when calculating the WACC.
10 - 26
Copyright © 2001 by Harcourt, Inc. All rights reserved.
5. Weighted Average Cost of Capital (WACC)
If all new equity will come from retained earnings:
WACC = Wd [Kd(1-t)] + Wp(Kps) + Wc(Ks)
Wd, Ws, Wc are the weights used for debt, preferred
stock, and common equity.
Assume that the firm has established such a target
and will finance all new investments so as to
maintain a constant target capital structure.
Weights should be based on the market value.
10 - 27
Copyright © 2001 by Harcourt, Inc. All rights reserved.
What’s the firm’s WACC (ignoring
flotation costs)?
WACC = wdkd(1 – T) + wpkp + wcks
= 0.3(10%)(0.6) + 0.1(9%) + 0.6(14%)
= 1.8% + 0.9% + 8.4% = 11.1%.
10 - 28
Copyright © 2001 by Harcourt, Inc. All rights reserved.
The company has a target capital
structure of 40 percent debt and 60
percent equity
Bonds pay 10% coupon (semiannual),
mature in 20 years and sell for $849.54
the company stock beta is 1.2
rf = 10%, market risk premium = 5%
the company is a constant growth firm
that just paid a dividend of $2, sells for
$27 per share, and a growth rate of 8%
marginal tax rate is 40%.
10 - 29
Copyright © 2001 by Harcourt, Inc. All rights reserved.
What factors influence a company’s
composite WACC?
Market conditions. (the level of interest
rates, tax rates…)
The firm’s capital structure and dividend
policy.
The firm’s investment policy. Firms with
riskier projects generally have a higher
WACC.
10 - 30
Copyright © 2001 by Harcourt, Inc. All rights reserved.
WACC Estimates for Some Large
U. S. Corporations, Nov. 1999
Company WACC
Intel 12.9%
General Electric 11.9
Motorola 11.3
Coca-Cola 11.2
Walt Disney 10.0
AT&T 9.8
Wal-Mart 9.8
Exxon 8.8
H. J. Heinz 8.5
BellSouth 8.2
10 - 31
Copyright © 2001 by Harcourt, Inc. All rights reserved.
Should the company use the
composite WACC as the hurdle rate for
each of its projects?
NO! The composite WACC reflects the
risk of an average project undertaken
by the firm. Therefore, the WACC only
represents the “hurdle rate” for a
typical project with average risk.
Different projects have different risks.
The project’s WACC should be adjusted
to reflect the project’s risk.
10 - 32
Copyright © 2001 by Harcourt, Inc. All rights reserved.
Subjective adjustments to the
firm’s composite WACC.
Attempt to estimate what the cost
of capital would be if the
project/division were a stand-alone
firm. This requires estimating the
project’s beta.
What procedures are used to determine
the risk-adjusted cost of capital for a
particular project or division?
10 - 33
Copyright © 2001 by Harcourt, Inc. All rights reserved.
Find the division’s market risk and cost
of capital based on the CAPM, given
these inputs:
Target debt ratio = 40%.
kd = 12%.
kRF = 7%.
Tax rate = 40%.
betaDivision = 1.7.
Market risk premium = 6%.
10 - 34
Copyright © 2001 by Harcourt, Inc. All rights reserved.
Beta = 1.7, so division has more market
risk than average.
Division’s required return on equity:
ks = kRF + (kM – kRF)bDiv.
= 7% + (6%)1.7 = 17.2%.
WACCDiv. = wdkd(1 – T) + wcks
= 0.4(12%)(0.6) + 0.6(17.2%)
= 13.2%.
10 - 35
Copyright © 2001 by Harcourt, Inc. All rights reserved.
How does the division’s market risk
compare with the firm’s overall market
risk?
Division WACC = 13.2% versus
company WACC = 11.1%.
Indicates that the division’s market risk
is greater than firm’s average project.
“Typical” projects within this division
would be accepted if their returns are
above 13.2%.

More Related Content

Similar to WACC.ppt

Ch. 6ed Cost of Capital.ppt.ppt
Ch. 6ed Cost of Capital.ppt.pptCh. 6ed Cost of Capital.ppt.ppt
Ch. 6ed Cost of Capital.ppt.ppt
HudaElMaghraby1
 
Whether it is for skills development or career preparation or personal financ...
Whether it is for skills development or career preparation or personal financ...Whether it is for skills development or career preparation or personal financ...
Whether it is for skills development or career preparation or personal financ...
asoabdullah82
 
Cost of capital ppt @ bec doms on finance
Cost of capital ppt @ bec doms on financeCost of capital ppt @ bec doms on finance
Cost of capital ppt @ bec doms on finance
Babasab Patil
 
Cost of capital slides.pptx
Cost of capital slides.pptxCost of capital slides.pptx
Cost of capital slides.pptx
KamranKhan389726
 
Cost of Capital
Cost of CapitalCost of Capital
Cost of Capital
Augustin Bangalore
 
Additional File-Capital Budgeting 3.ppt
Additional File-Capital Budgeting 3.pptAdditional File-Capital Budgeting 3.ppt
Additional File-Capital Budgeting 3.ppt
ArneetSarna1
 
Learning ObjectivesUpon completion of Chapter 10, you will.docx
Learning ObjectivesUpon completion of Chapter 10, you will.docxLearning ObjectivesUpon completion of Chapter 10, you will.docx
Learning ObjectivesUpon completion of Chapter 10, you will.docx
SHIVA101531
 
Chapter 12 Cost Of Capital
Chapter 12 Cost Of CapitalChapter 12 Cost Of Capital
Chapter 12 Cost Of Capital
Alamgir Alwani
 
Chapter 5 cost of capital sml 401 btech
Chapter 5   cost of capital sml 401 btechChapter 5   cost of capital sml 401 btech
Chapter 5 cost of capital sml 401 btech
Mvs Krishna
 
Module-5-Assigned-Problems (1).pdf
Module-5-Assigned-Problems (1).pdfModule-5-Assigned-Problems (1).pdf
Module-5-Assigned-Problems (1).pdf
RiaBago
 
Ch14
Ch14Ch14
Ch14
Odko Ts
 
ch 10; cost of capital
ch 10; cost of capitalch 10; cost of capital
ch 10; cost of capital
Sathish Kumar Patturaj
 
Fin 515 week 6
Fin 515 week 6Fin 515 week 6
Fin 515 week 6
ecambry
 
Weighted Average Cost of Capital
Weighted Average Cost of CapitalWeighted Average Cost of Capital
Weighted Average Cost of Capital
Rod Medallon
 
Financial Management Lecture 9 NUML Capital Structure
Financial Management Lecture 9 NUML Capital StructureFinancial Management Lecture 9 NUML Capital Structure
Financial Management Lecture 9 NUML Capital Structure
pal83111
 
Chap013
Chap013Chap013
FM CH 4.pptx best presentation for financial management
FM CH 4.pptx best presentation for financial managementFM CH 4.pptx best presentation for financial management
FM CH 4.pptx best presentation for financial management
Kalkaye
 
Bonds Valuation for Financial Statements
Bonds Valuation for Financial StatementsBonds Valuation for Financial Statements
Bonds Valuation for Financial Statements
HassanHani5
 
Financial Management Slides Ch 15
Financial Management Slides Ch 15Financial Management Slides Ch 15
Financial Management Slides Ch 15
Sayyed Naveed Ali
 
Cost of capital
Cost of capital Cost of capital
Cost of capital
Dr. Soheli Ghose Banerjee
 

Similar to WACC.ppt (20)

Ch. 6ed Cost of Capital.ppt.ppt
Ch. 6ed Cost of Capital.ppt.pptCh. 6ed Cost of Capital.ppt.ppt
Ch. 6ed Cost of Capital.ppt.ppt
 
Whether it is for skills development or career preparation or personal financ...
Whether it is for skills development or career preparation or personal financ...Whether it is for skills development or career preparation or personal financ...
Whether it is for skills development or career preparation or personal financ...
 
Cost of capital ppt @ bec doms on finance
Cost of capital ppt @ bec doms on financeCost of capital ppt @ bec doms on finance
Cost of capital ppt @ bec doms on finance
 
Cost of capital slides.pptx
Cost of capital slides.pptxCost of capital slides.pptx
Cost of capital slides.pptx
 
Cost of Capital
Cost of CapitalCost of Capital
Cost of Capital
 
Additional File-Capital Budgeting 3.ppt
Additional File-Capital Budgeting 3.pptAdditional File-Capital Budgeting 3.ppt
Additional File-Capital Budgeting 3.ppt
 
Learning ObjectivesUpon completion of Chapter 10, you will.docx
Learning ObjectivesUpon completion of Chapter 10, you will.docxLearning ObjectivesUpon completion of Chapter 10, you will.docx
Learning ObjectivesUpon completion of Chapter 10, you will.docx
 
Chapter 12 Cost Of Capital
Chapter 12 Cost Of CapitalChapter 12 Cost Of Capital
Chapter 12 Cost Of Capital
 
Chapter 5 cost of capital sml 401 btech
Chapter 5   cost of capital sml 401 btechChapter 5   cost of capital sml 401 btech
Chapter 5 cost of capital sml 401 btech
 
Module-5-Assigned-Problems (1).pdf
Module-5-Assigned-Problems (1).pdfModule-5-Assigned-Problems (1).pdf
Module-5-Assigned-Problems (1).pdf
 
Ch14
Ch14Ch14
Ch14
 
ch 10; cost of capital
ch 10; cost of capitalch 10; cost of capital
ch 10; cost of capital
 
Fin 515 week 6
Fin 515 week 6Fin 515 week 6
Fin 515 week 6
 
Weighted Average Cost of Capital
Weighted Average Cost of CapitalWeighted Average Cost of Capital
Weighted Average Cost of Capital
 
Financial Management Lecture 9 NUML Capital Structure
Financial Management Lecture 9 NUML Capital StructureFinancial Management Lecture 9 NUML Capital Structure
Financial Management Lecture 9 NUML Capital Structure
 
Chap013
Chap013Chap013
Chap013
 
FM CH 4.pptx best presentation for financial management
FM CH 4.pptx best presentation for financial managementFM CH 4.pptx best presentation for financial management
FM CH 4.pptx best presentation for financial management
 
Bonds Valuation for Financial Statements
Bonds Valuation for Financial StatementsBonds Valuation for Financial Statements
Bonds Valuation for Financial Statements
 
Financial Management Slides Ch 15
Financial Management Slides Ch 15Financial Management Slides Ch 15
Financial Management Slides Ch 15
 
Cost of capital
Cost of capital Cost of capital
Cost of capital
 

Recently uploaded

Detailed power point presentation on compound interest and how it is calculated
Detailed power point presentation on compound interest  and how it is calculatedDetailed power point presentation on compound interest  and how it is calculated
Detailed power point presentation on compound interest and how it is calculated
KishanChaudhary23
 
快速制作美国迈阿密大学牛津分校毕业证文凭证书英文原版一模一样
快速制作美国迈阿密大学牛津分校毕业证文凭证书英文原版一模一样快速制作美国迈阿密大学牛津分校毕业证文凭证书英文原版一模一样
快速制作美国迈阿密大学牛津分校毕业证文凭证书英文原版一模一样
rlo9fxi
 
Independent Study - College of Wooster Research (2023-2024) FDI, Culture, Glo...
Independent Study - College of Wooster Research (2023-2024) FDI, Culture, Glo...Independent Study - College of Wooster Research (2023-2024) FDI, Culture, Glo...
Independent Study - College of Wooster Research (2023-2024) FDI, Culture, Glo...
AntoniaOwensDetwiler
 
Solution Manual For Financial Accounting, 8th Canadian Edition 2024, by Libby...
Solution Manual For Financial Accounting, 8th Canadian Edition 2024, by Libby...Solution Manual For Financial Accounting, 8th Canadian Edition 2024, by Libby...
Solution Manual For Financial Accounting, 8th Canadian Edition 2024, by Libby...
Donc Test
 
Applying the Global Internal Audit Standards_AIS.pdf
Applying the Global Internal Audit Standards_AIS.pdfApplying the Global Internal Audit Standards_AIS.pdf
Applying the Global Internal Audit Standards_AIS.pdf
alexiusbrian1
 
falcon-invoice-discounting-a-premier-investment-platform-for-superior-returns...
falcon-invoice-discounting-a-premier-investment-platform-for-superior-returns...falcon-invoice-discounting-a-premier-investment-platform-for-superior-returns...
falcon-invoice-discounting-a-premier-investment-platform-for-superior-returns...
Falcon Invoice Discounting
 
Tumelo-deep-dive-into-pass-through-voting-Feb23 (1).pdf
Tumelo-deep-dive-into-pass-through-voting-Feb23 (1).pdfTumelo-deep-dive-into-pass-through-voting-Feb23 (1).pdf
Tumelo-deep-dive-into-pass-through-voting-Feb23 (1).pdf
Henry Tapper
 
Economic Risk Factor Update: June 2024 [SlideShare]
Economic Risk Factor Update: June 2024 [SlideShare]Economic Risk Factor Update: June 2024 [SlideShare]
Economic Risk Factor Update: June 2024 [SlideShare]
Commonwealth
 
falcon-invoice-discounting-a-strategic-approach-to-optimize-investments
falcon-invoice-discounting-a-strategic-approach-to-optimize-investmentsfalcon-invoice-discounting-a-strategic-approach-to-optimize-investments
falcon-invoice-discounting-a-strategic-approach-to-optimize-investments
Falcon Invoice Discounting
 
FCCS Basic Accounts Outline and Hierarchy.pptx
FCCS Basic Accounts Outline and Hierarchy.pptxFCCS Basic Accounts Outline and Hierarchy.pptx
FCCS Basic Accounts Outline and Hierarchy.pptx
nalamynandan
 
Who Is the Largest Producer of Soybean in India Now.pdf
Who Is the Largest Producer of Soybean in India Now.pdfWho Is the Largest Producer of Soybean in India Now.pdf
Who Is the Largest Producer of Soybean in India Now.pdf
Price Vision
 
The Impact of GST Payments on Loan Approvals
The Impact of GST Payments on Loan ApprovalsThe Impact of GST Payments on Loan Approvals
The Impact of GST Payments on Loan Approvals
Vighnesh Shashtri
 
Using Online job postings and survey data to understand labour market trends
Using Online job postings and survey data to understand labour market trendsUsing Online job postings and survey data to understand labour market trends
Using Online job postings and survey data to understand labour market trends
Labour Market Information Council | Conseil de l’information sur le marché du travail
 
一比一原版(RMIT毕业证)皇家墨尔本理工大学毕业证如何办理
一比一原版(RMIT毕业证)皇家墨尔本理工大学毕业证如何办理一比一原版(RMIT毕业证)皇家墨尔本理工大学毕业证如何办理
一比一原版(RMIT毕业证)皇家墨尔本理工大学毕业证如何办理
k4ncd0z
 
1:1制作加拿大麦吉尔大学毕业证硕士学历证书原版一模一样
1:1制作加拿大麦吉尔大学毕业证硕士学历证书原版一模一样1:1制作加拿大麦吉尔大学毕业证硕士学历证书原版一模一样
1:1制作加拿大麦吉尔大学毕业证硕士学历证书原版一模一样
qntjwn68
 
Unlock-the-Power-of-UAN-Your-Key-to-Secure-Retirement.pptx
Unlock-the-Power-of-UAN-Your-Key-to-Secure-Retirement.pptxUnlock-the-Power-of-UAN-Your-Key-to-Secure-Retirement.pptx
Unlock-the-Power-of-UAN-Your-Key-to-Secure-Retirement.pptx
cosmo-soil
 
International Sustainability Standards Board
International Sustainability Standards BoardInternational Sustainability Standards Board
International Sustainability Standards Board
Kumar Ramaiah
 
University of North Carolina at Charlotte degree offer diploma Transcript
University of North Carolina at Charlotte degree offer diploma TranscriptUniversity of North Carolina at Charlotte degree offer diploma Transcript
University of North Carolina at Charlotte degree offer diploma Transcript
tscdzuip
 
Bridging the gap: Online job postings, survey data and the assessment of job ...
Bridging the gap: Online job postings, survey data and the assessment of job ...Bridging the gap: Online job postings, survey data and the assessment of job ...
Bridging the gap: Online job postings, survey data and the assessment of job ...
Labour Market Information Council | Conseil de l’information sur le marché du travail
 
Tdasx: Unveiling the Trillion-Dollar Potential of Bitcoin DeFi
Tdasx: Unveiling the Trillion-Dollar Potential of Bitcoin DeFiTdasx: Unveiling the Trillion-Dollar Potential of Bitcoin DeFi
Tdasx: Unveiling the Trillion-Dollar Potential of Bitcoin DeFi
nimaruinazawa258
 

Recently uploaded (20)

Detailed power point presentation on compound interest and how it is calculated
Detailed power point presentation on compound interest  and how it is calculatedDetailed power point presentation on compound interest  and how it is calculated
Detailed power point presentation on compound interest and how it is calculated
 
快速制作美国迈阿密大学牛津分校毕业证文凭证书英文原版一模一样
快速制作美国迈阿密大学牛津分校毕业证文凭证书英文原版一模一样快速制作美国迈阿密大学牛津分校毕业证文凭证书英文原版一模一样
快速制作美国迈阿密大学牛津分校毕业证文凭证书英文原版一模一样
 
Independent Study - College of Wooster Research (2023-2024) FDI, Culture, Glo...
Independent Study - College of Wooster Research (2023-2024) FDI, Culture, Glo...Independent Study - College of Wooster Research (2023-2024) FDI, Culture, Glo...
Independent Study - College of Wooster Research (2023-2024) FDI, Culture, Glo...
 
Solution Manual For Financial Accounting, 8th Canadian Edition 2024, by Libby...
Solution Manual For Financial Accounting, 8th Canadian Edition 2024, by Libby...Solution Manual For Financial Accounting, 8th Canadian Edition 2024, by Libby...
Solution Manual For Financial Accounting, 8th Canadian Edition 2024, by Libby...
 
Applying the Global Internal Audit Standards_AIS.pdf
Applying the Global Internal Audit Standards_AIS.pdfApplying the Global Internal Audit Standards_AIS.pdf
Applying the Global Internal Audit Standards_AIS.pdf
 
falcon-invoice-discounting-a-premier-investment-platform-for-superior-returns...
falcon-invoice-discounting-a-premier-investment-platform-for-superior-returns...falcon-invoice-discounting-a-premier-investment-platform-for-superior-returns...
falcon-invoice-discounting-a-premier-investment-platform-for-superior-returns...
 
Tumelo-deep-dive-into-pass-through-voting-Feb23 (1).pdf
Tumelo-deep-dive-into-pass-through-voting-Feb23 (1).pdfTumelo-deep-dive-into-pass-through-voting-Feb23 (1).pdf
Tumelo-deep-dive-into-pass-through-voting-Feb23 (1).pdf
 
Economic Risk Factor Update: June 2024 [SlideShare]
Economic Risk Factor Update: June 2024 [SlideShare]Economic Risk Factor Update: June 2024 [SlideShare]
Economic Risk Factor Update: June 2024 [SlideShare]
 
falcon-invoice-discounting-a-strategic-approach-to-optimize-investments
falcon-invoice-discounting-a-strategic-approach-to-optimize-investmentsfalcon-invoice-discounting-a-strategic-approach-to-optimize-investments
falcon-invoice-discounting-a-strategic-approach-to-optimize-investments
 
FCCS Basic Accounts Outline and Hierarchy.pptx
FCCS Basic Accounts Outline and Hierarchy.pptxFCCS Basic Accounts Outline and Hierarchy.pptx
FCCS Basic Accounts Outline and Hierarchy.pptx
 
Who Is the Largest Producer of Soybean in India Now.pdf
Who Is the Largest Producer of Soybean in India Now.pdfWho Is the Largest Producer of Soybean in India Now.pdf
Who Is the Largest Producer of Soybean in India Now.pdf
 
The Impact of GST Payments on Loan Approvals
The Impact of GST Payments on Loan ApprovalsThe Impact of GST Payments on Loan Approvals
The Impact of GST Payments on Loan Approvals
 
Using Online job postings and survey data to understand labour market trends
Using Online job postings and survey data to understand labour market trendsUsing Online job postings and survey data to understand labour market trends
Using Online job postings and survey data to understand labour market trends
 
一比一原版(RMIT毕业证)皇家墨尔本理工大学毕业证如何办理
一比一原版(RMIT毕业证)皇家墨尔本理工大学毕业证如何办理一比一原版(RMIT毕业证)皇家墨尔本理工大学毕业证如何办理
一比一原版(RMIT毕业证)皇家墨尔本理工大学毕业证如何办理
 
1:1制作加拿大麦吉尔大学毕业证硕士学历证书原版一模一样
1:1制作加拿大麦吉尔大学毕业证硕士学历证书原版一模一样1:1制作加拿大麦吉尔大学毕业证硕士学历证书原版一模一样
1:1制作加拿大麦吉尔大学毕业证硕士学历证书原版一模一样
 
Unlock-the-Power-of-UAN-Your-Key-to-Secure-Retirement.pptx
Unlock-the-Power-of-UAN-Your-Key-to-Secure-Retirement.pptxUnlock-the-Power-of-UAN-Your-Key-to-Secure-Retirement.pptx
Unlock-the-Power-of-UAN-Your-Key-to-Secure-Retirement.pptx
 
International Sustainability Standards Board
International Sustainability Standards BoardInternational Sustainability Standards Board
International Sustainability Standards Board
 
University of North Carolina at Charlotte degree offer diploma Transcript
University of North Carolina at Charlotte degree offer diploma TranscriptUniversity of North Carolina at Charlotte degree offer diploma Transcript
University of North Carolina at Charlotte degree offer diploma Transcript
 
Bridging the gap: Online job postings, survey data and the assessment of job ...
Bridging the gap: Online job postings, survey data and the assessment of job ...Bridging the gap: Online job postings, survey data and the assessment of job ...
Bridging the gap: Online job postings, survey data and the assessment of job ...
 
Tdasx: Unveiling the Trillion-Dollar Potential of Bitcoin DeFi
Tdasx: Unveiling the Trillion-Dollar Potential of Bitcoin DeFiTdasx: Unveiling the Trillion-Dollar Potential of Bitcoin DeFi
Tdasx: Unveiling the Trillion-Dollar Potential of Bitcoin DeFi
 

WACC.ppt

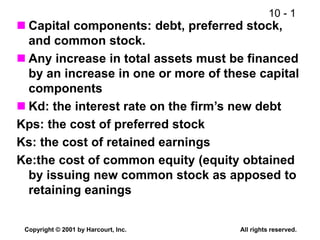
  • 1. 10 - 1 Copyright © 2001 by Harcourt, Inc. All rights reserved.  Capital components: debt, preferred stock, and common stock.  Any increase in total assets must be financed by an increase in one or more of these capital components  Kd: the interest rate on the firm’s new debt Kps: the cost of preferred stock Ks: the cost of retained earnings Ke:the cost of common equity (equity obtained by issuing new common stock as apposed to retaining eanings
  • 2. 10 - 2 Copyright © 2001 by Harcourt, Inc. All rights reserved. 1. The cost of debt Kd(1-T) is the after tax cost of debt. The relevant cost of new debt, taking into account the tax deductibility of interest. In effect, the government pays part of the cost of debt because interest is deductible. Note that the cost of debt is the interest rate on new debt, not the interest rate paid on existing or old debt.
  • 3. 10 - 3 Copyright © 2001 by Harcourt, Inc. All rights reserved. A 15-year, 12% semiannual bond sells for $1,153.72. What’s kd? 60 60 + 1,000 60 0 1 2 30 i = ? 30 -1153.72 60 1000 5.0% x 2 = kd = 10% N I/YR PV FV PMT -1,153.72 ... INPUTS OUTPUT
  • 4. 10 - 4 Copyright © 2001 by Harcourt, Inc. All rights reserved. Component Cost of Debt Interest is tax deductible, so kd AT = kd BT(1 – T) = 10%(1 – 0.40) = 6%.
  • 5. 10 - 5 Copyright © 2001 by Harcourt, Inc. All rights reserved. 2. The cost of preferred stock (Kp) The rate of return investors require on the firm’s preferred stock. Preferred stock is a perpetuity that pays a fixed dividend (Dp) forever. Kp = Preferred dividend / the current price of the preferred stock
  • 6. 10 - 6 Copyright © 2001 by Harcourt, Inc. All rights reserved. What’s the cost of preferred stock? Pp = $111.10; $10 dividend/share Use this formula: %. 0 . 9 090 . 0 10 . 111 $ 10 $ P D k p p p    
  • 7. 10 - 7 Copyright © 2001 by Harcourt, Inc. All rights reserved. Note: Preferred dividends are not tax deductible, so no tax adjustment. Just kp. Nominal kp is used. Our calculation ignores flotation costs.
  • 8. 10 - 8 Copyright © 2001 by Harcourt, Inc. All rights reserved. Why is there a cost for retained earnings? Earnings can be reinvested or paid out as dividends. Investors could buy other securities, earn a return. Thus, there is an opportunity cost if earnings are retained.
  • 9. 10 - 9 Copyright © 2001 by Harcourt, Inc. All rights reserved. Opportunity cost: The return stockholders could earn on alternative investments of equal risk. They could buy similar stocks and earn ks. So, ks is the cost of retained earnings. The rate of return required by stockholders on a firm’s common stock
  • 10. 10 - 10 Copyright © 2001 by Harcourt, Inc. All rights reserved. Three ways to determine cost of common equity, ks: 1. CAPM: ks = kRF + (kM – kRF)b. 2. The bond-yield plus risk-premium approach: Ks= bond yield + firm’s risk premium firms with risky, low-rated, and consequently high-interest-rate debt will also have risky, high- cost equity. The risk premium over a firm’s own bond yield has generally ranged from 3 to 5 percentage.
  • 11. 10 - 11 Copyright © 2001 by Harcourt, Inc. All rights reserved. 3. Discount Cash Flow model (Constant dividend growth model) Ks = (D1/Po) + g How to estimate g? g = (1- dividend pay out ratio)*ROE
  • 12. 10 - 12 Copyright © 2001 by Harcourt, Inc. All rights reserved. What’s the cost of common equity based on the CAPM? kRF = 7%, RPM = 6%, b = 1.2. ks = kRF + (kM – kRF )b. = 7.0% + (6.0%)1.2 = 14.2%.
  • 13. 10 - 13 Copyright © 2001 by Harcourt, Inc. All rights reserved. What’s the DCF cost of common equity, ks? Given: D0 = $4.19; P0 = $50; g = 5%. D1 P0 D0(1 + g) P0 $4.19(1.05) $50 ks = + g = + g = + 0.05 = 0.088 + 0.05 = 13.8%.
  • 14. 10 - 14 Copyright © 2001 by Harcourt, Inc. All rights reserved. Suppose the company has been earning 15% on equity (ROE = 15%) and retaining 35% (dividend payout = 65%), and this situation is expected to continue. What’s the expected future g?
  • 15. 10 - 15 Copyright © 2001 by Harcourt, Inc. All rights reserved. Retention growth rate: g = (1 – Payout)(ROE) = 0.35(15%) = 5.25%. Here (1 – Payout) = Fraction retained.
  • 16. 10 - 16 Copyright © 2001 by Harcourt, Inc. All rights reserved. Find ks using the own-bond-yield-plus- risk-premium method. (kd = 10%, RP = 4%.) This RP  CAPM RP. Produces ballpark estimate of ks. ks = kd + RP = 10.0% + 4.0% = 14.0%
  • 17. 10 - 17 Copyright © 2001 by Harcourt, Inc. All rights reserved. What’s a reasonable final estimate of ks? Method Estimate CAPM 14.2% DCF 13.8% kd + RP 14.0% Average 14.0%
  • 18. 10 - 18 Copyright © 2001 by Harcourt, Inc. All rights reserved. 1. When a company issues new common stock they also have to pay flotation costs to the underwriter. 2. Issuing new common stock may send a negative signal to the capital markets, which may depress stock price. Why is the cost of retained earnings (ks) cheaper than the cost of issuing new common stock (ke)?
  • 19. 10 - 19 Copyright © 2001 by Harcourt, Inc. All rights reserved. Two approaches that can be used to account for flotation costs: Include the flotation costs as part of the project’s up-front cost. This reduces the project’s estimated return. Adjust the cost of capital to include flotation costs. This is most commonly done by incorporating flotation costs in the DCF model.
  • 20. 10 - 20 Copyright © 2001 by Harcourt, Inc. All rights reserved. Ke = [D1/Po(1-F) ] + g F is the percentage flotation cost incurred in selling the new stock. So, Po (1-F) is the net price per share received by the company.
  • 21. 10 - 21 Copyright © 2001 by Harcourt, Inc. All rights reserved. New common, F = 15%: g ) F 1 ( P ) g 1 ( D k 0 0 e         %. 4 . 15 % 0 . 5 50 . 42 $ 40 . 4 $ % 0 . 5 15 . 0 1 50 $ 05 . 1 19 . 4 $      
  • 22. 10 - 22 Copyright © 2001 by Harcourt, Inc. All rights reserved.  Because of flotation costs, dollars raised by selling new stock must “work harder” than dollars raised by retaining earnings. Moreover, since no flotation costs are involved, retained earnings have a lower cost than new stock.  Therefore, the firms should utilize retained earnings to the extent possible to avoid the costs of new common stock.  However, if a firm has more good investment opportunities, issuing new common stock is necessary.
  • 23. 10 - 23 Copyright © 2001 by Harcourt, Inc. All rights reserved. The retained earnings breakpoint represents the total amount of financing that can be raised before the firm is forced to sell new common stock. Retained earnings breakpoint = addition to retained earnings/equity fraction
  • 24. 10 - 24 Copyright © 2001 by Harcourt, Inc. All rights reserved. E.g) Suppose a firm estimates its earnings to be $100M next year and has a payout ratio of 40%. Its capital structure consists of 45% debt, 2% preferred, and 53% equity. The break point will be $60M/0.53 = $113.2M; After the firm has raised total capital of $113.2M, the firm will be forced to issue new common stock.
  • 25. 10 - 25 Copyright © 2001 by Harcourt, Inc. All rights reserved. Comments about flotation costs: Flotation costs depend on the risk of the firm and the type of capital being raised. The flotation costs are highest for common equity. However, since most firms issue equity infrequently, the per-project cost is fairly small. We will frequently ignore flotation costs when calculating the WACC.
  • 26. 10 - 26 Copyright © 2001 by Harcourt, Inc. All rights reserved. 5. Weighted Average Cost of Capital (WACC) If all new equity will come from retained earnings: WACC = Wd [Kd(1-t)] + Wp(Kps) + Wc(Ks) Wd, Ws, Wc are the weights used for debt, preferred stock, and common equity. Assume that the firm has established such a target and will finance all new investments so as to maintain a constant target capital structure. Weights should be based on the market value.
  • 27. 10 - 27 Copyright © 2001 by Harcourt, Inc. All rights reserved. What’s the firm’s WACC (ignoring flotation costs)? WACC = wdkd(1 – T) + wpkp + wcks = 0.3(10%)(0.6) + 0.1(9%) + 0.6(14%) = 1.8% + 0.9% + 8.4% = 11.1%.
  • 28. 10 - 28 Copyright © 2001 by Harcourt, Inc. All rights reserved. The company has a target capital structure of 40 percent debt and 60 percent equity Bonds pay 10% coupon (semiannual), mature in 20 years and sell for $849.54 the company stock beta is 1.2 rf = 10%, market risk premium = 5% the company is a constant growth firm that just paid a dividend of $2, sells for $27 per share, and a growth rate of 8% marginal tax rate is 40%.
  • 29. 10 - 29 Copyright © 2001 by Harcourt, Inc. All rights reserved. What factors influence a company’s composite WACC? Market conditions. (the level of interest rates, tax rates…) The firm’s capital structure and dividend policy. The firm’s investment policy. Firms with riskier projects generally have a higher WACC.
  • 30. 10 - 30 Copyright © 2001 by Harcourt, Inc. All rights reserved. WACC Estimates for Some Large U. S. Corporations, Nov. 1999 Company WACC Intel 12.9% General Electric 11.9 Motorola 11.3 Coca-Cola 11.2 Walt Disney 10.0 AT&T 9.8 Wal-Mart 9.8 Exxon 8.8 H. J. Heinz 8.5 BellSouth 8.2
  • 31. 10 - 31 Copyright © 2001 by Harcourt, Inc. All rights reserved. Should the company use the composite WACC as the hurdle rate for each of its projects? NO! The composite WACC reflects the risk of an average project undertaken by the firm. Therefore, the WACC only represents the “hurdle rate” for a typical project with average risk. Different projects have different risks. The project’s WACC should be adjusted to reflect the project’s risk.
  • 32. 10 - 32 Copyright © 2001 by Harcourt, Inc. All rights reserved. Subjective adjustments to the firm’s composite WACC. Attempt to estimate what the cost of capital would be if the project/division were a stand-alone firm. This requires estimating the project’s beta. What procedures are used to determine the risk-adjusted cost of capital for a particular project or division?
  • 33. 10 - 33 Copyright © 2001 by Harcourt, Inc. All rights reserved. Find the division’s market risk and cost of capital based on the CAPM, given these inputs: Target debt ratio = 40%. kd = 12%. kRF = 7%. Tax rate = 40%. betaDivision = 1.7. Market risk premium = 6%.
  • 34. 10 - 34 Copyright © 2001 by Harcourt, Inc. All rights reserved. Beta = 1.7, so division has more market risk than average. Division’s required return on equity: ks = kRF + (kM – kRF)bDiv. = 7% + (6%)1.7 = 17.2%. WACCDiv. = wdkd(1 – T) + wcks = 0.4(12%)(0.6) + 0.6(17.2%) = 13.2%.
  • 35. 10 - 35 Copyright © 2001 by Harcourt, Inc. All rights reserved. How does the division’s market risk compare with the firm’s overall market risk? Division WACC = 13.2% versus company WACC = 11.1%. Indicates that the division’s market risk is greater than firm’s average project. “Typical” projects within this division would be accepted if their returns are above 13.2%.