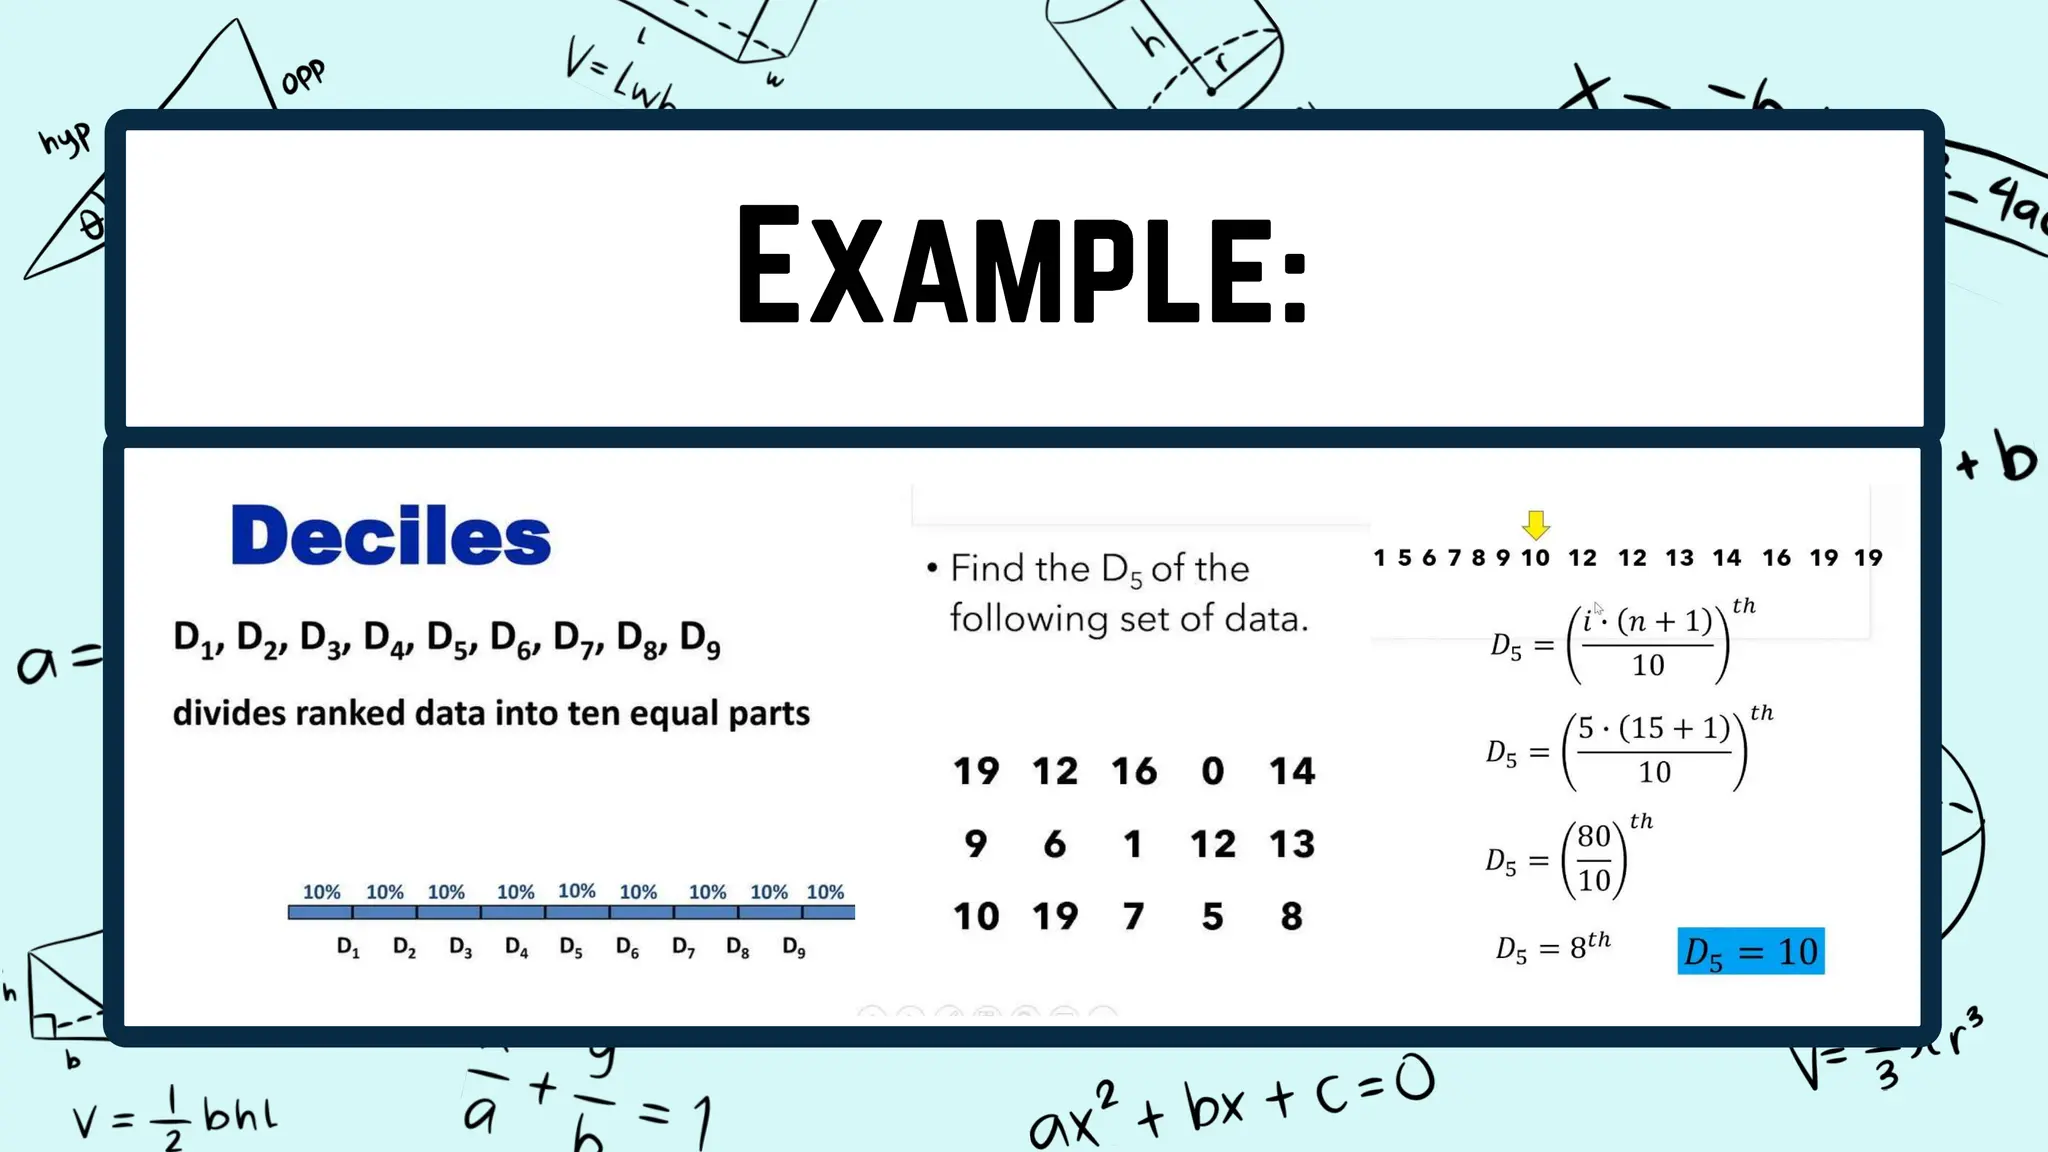
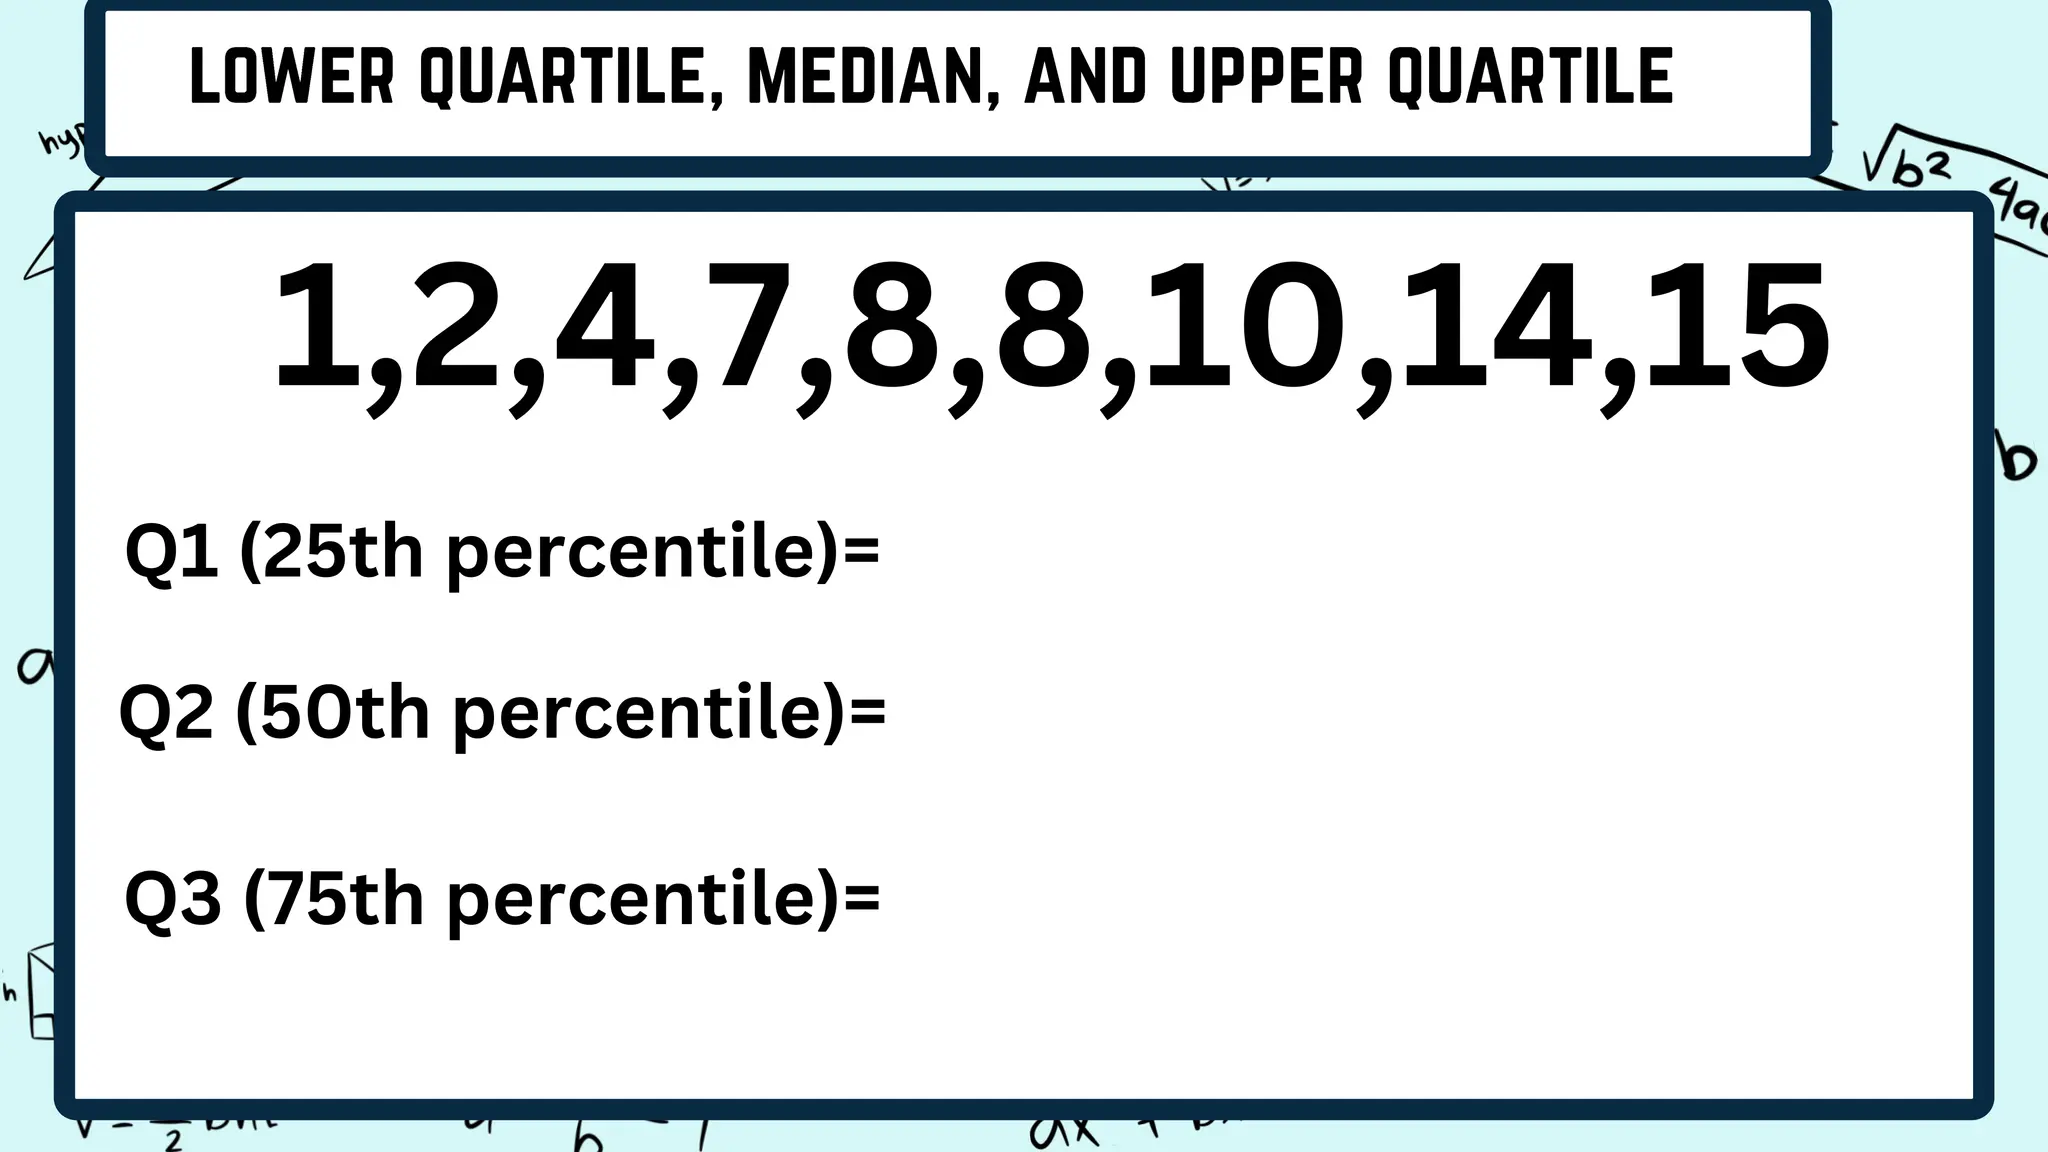
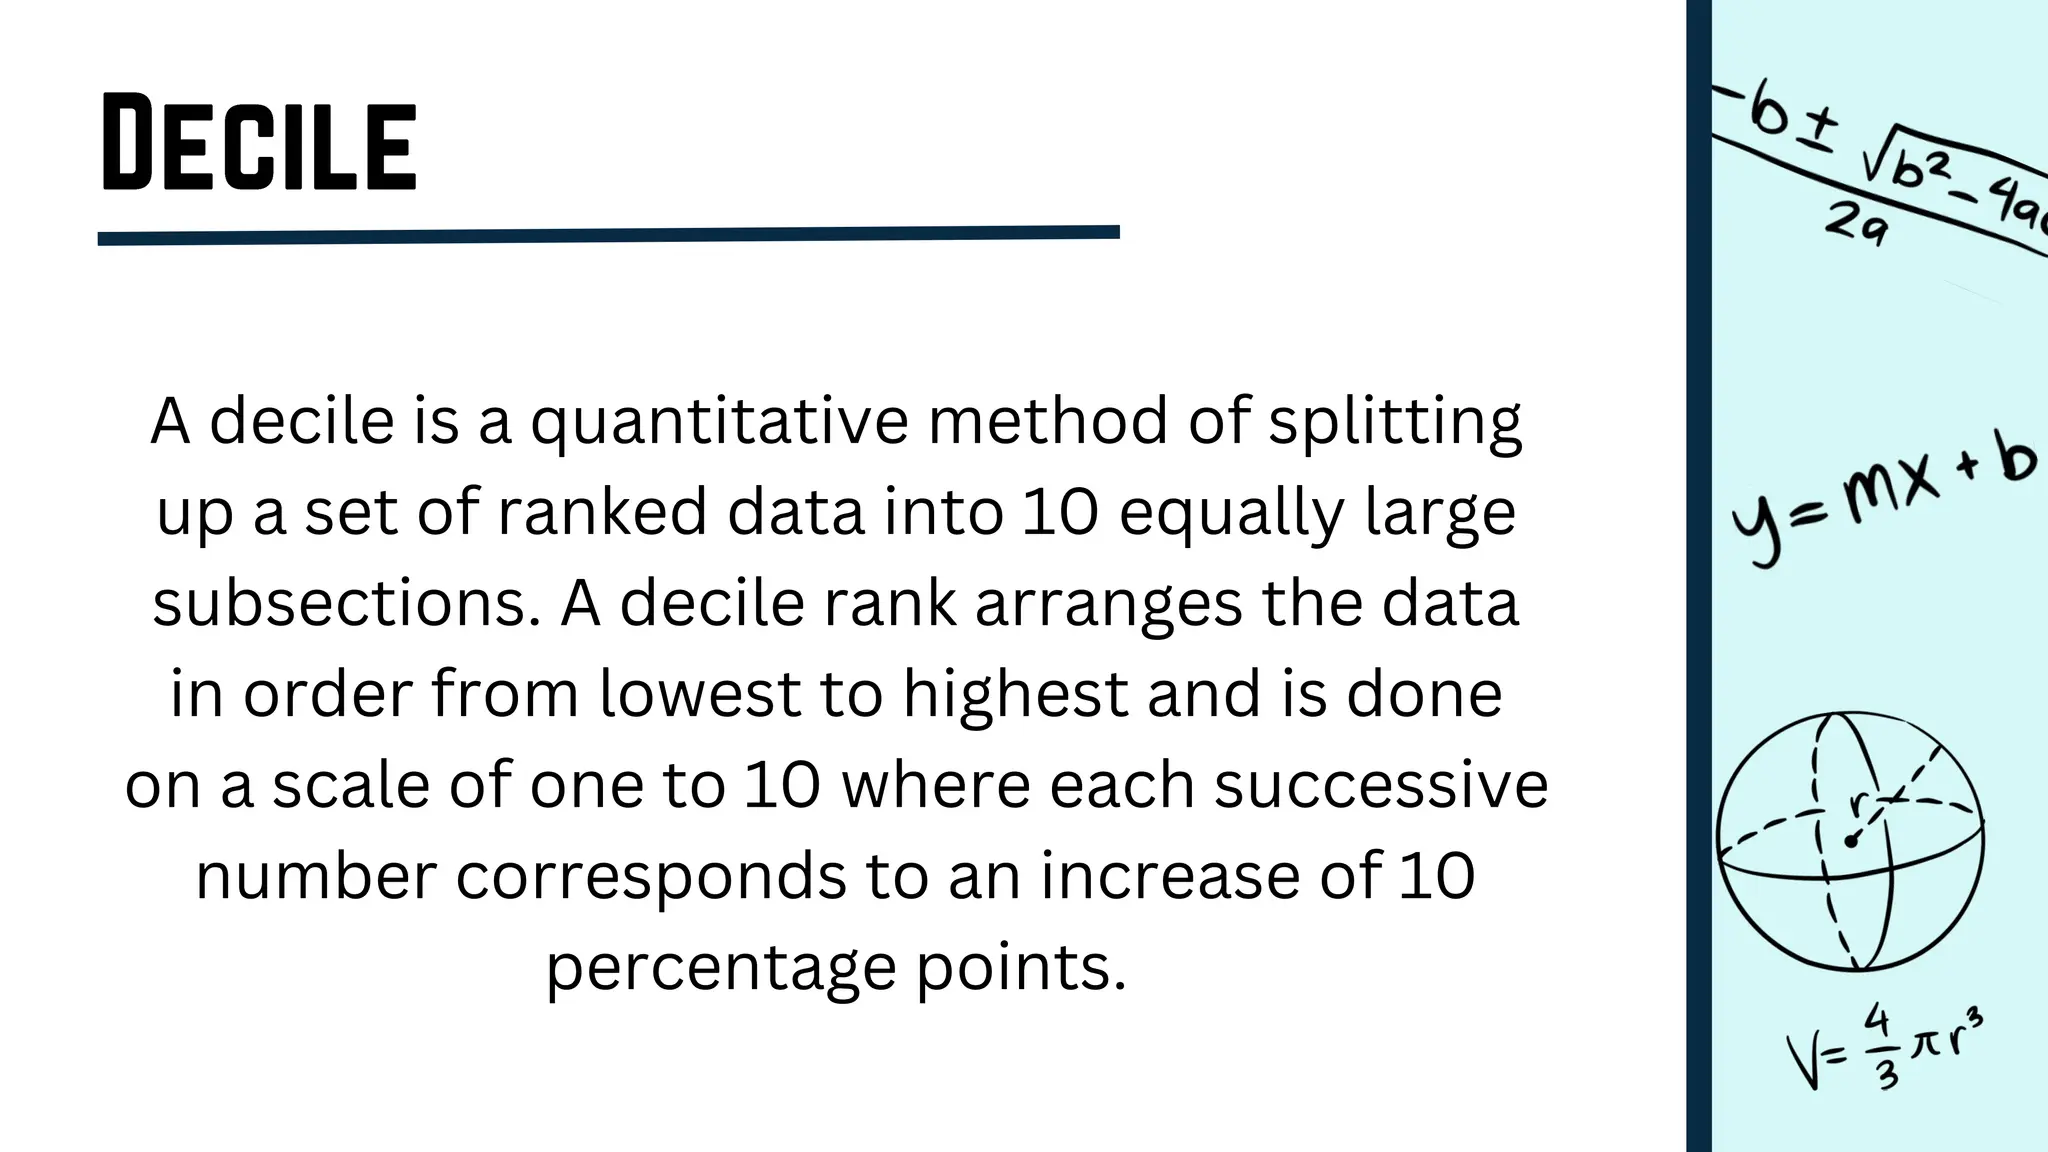
Quartiles divide a data set into four equal intervals based on the values and their comparison to the overall data set. The intervals are the lower quartile, median quartile, and upper quartile. A decile splits data into 10 equally large subgroups by ranking the data from lowest to highest on a scale of 1 to 10. Centiles, or percentiles, divide data into 100 equal parts with percentiles represented as P1 to P99, where P1 is the value below which 1/100 of the data falls.


![The formula to
calculate the decile is
as follows: D n = X [ n
10 × ( N + 1 ) ] , where
X is the sorted data
set, n is the decile (in
this case, 6), and N is
the number of data
points (in this case,
6). D 6 = X [ 6 10 × ( 6
+ 1 ) ] = X [ 4.2 ]dy text](https://image.slidesharecdn.com/interpretingnumericalexpressionsmathpresentationinlightbluemathdo202403021030300000-240305044310-f2bab1a9/75/quartile-decile-percentile-light-blue-math-do_20240302_103030_0000-pptx-23-2048.jpg)