Digital Transformation in the PLM domain - distrib.pdf
quantity discount final.pdf
1. 1
K K Aggarwal, Dept of OR, DU
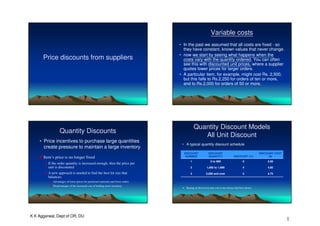
Price discounts from suppliers
Variable costs
• In the past we assumed that all costs are fixed - so
they have constant, known values that never change.
• now we start by seeing what happens when the
costs vary with the quantity ordered. You can often
see this with discounted unit prices, where a supplier
quotes lower prices for larger orders.
• A particular item, for example, might cost Rs. 2,500,
but this falls to Rs.2,250 for orders of ten or more,
and to Rs.2,000 for orders of 50 or more.
Quantity Discounts
• Price incentives to purchase large quantities
create pressure to maintain a large inventory
Item’s price is no longer fixed
If the order quantity is increased enough, then the price per
unit is discounted
A new approach is needed to find the best lot size that
balances:
Advantages of lower prices for purchased materials and fewer orders
Disadvantages of the increased cost of holding more inventory
Quantity Discount Models
All Unit Discount
• A typical quantity discount schedule
DISCOUNT
NUMBER
DISCOUNT
QUANTITY DISCOUNT (%)
DISCOUNT COST
($)
1 0 to 999 0 5.00
2 1,000 to 1,999 4 4.80
3 2,000 and over 5 4.75
Buying at the lowest unit cost is not always the best choice
2. 2
K K Aggarwal, Dept of OR, DU
Quantity Discount Models
• Total cost curve for the quantity discount model
TC Curve for
Discount 1
TC Curve for Discount 3
Total
Cost $
Order Quantity
0 1,000 2,000
TC Curve for Discount 2
EOQ for Discount 2
Quantity Discount Models
• Quantity discounts are commonly available
• The basic EOQ model is adjusted by adding in the
purchase or materials cost
Total cost = Material cost + Ordering cost + Holding cost
IC
Q
A
Q
C
2
cost
Total +
+
=
λ
λ
where
λ = annual demand in units
A = ordering cost of each order
C = cost per unit
IC = holding or carrying cost per unit per year
Quantity Discounts
• Unit holding cost (H=IC) is usually expressed as a
percentage of unit price
• The lower the unit price (C) is, the lower the unit holding
cost (H) is
The total cost equation yields U-shape total cost curves
There are cost curves for each price level
The feasible total cost begins with the top curve, then drops down, curve by curve,
at the price breaks
EOQs do not necessarily produce the best lot size
The EOQ at a particular price level may not be feasible
The EOQ at a particular price level may be feasible but may not be the best lot
size
3. 3
K K Aggarwal, Dept of OR, DU
Valid total cost curve
• The most common variation in cost occurs
when a supplier offers a reduced price on all
units for orders above a certain size. There is
often more than one discounted price, giving
the pattern of unit cost shown in Figure 4.1.
The basic unit cost is C1, but this reduces to
C2 for orders bigger than Qa, to C3, for orders
bigger than Qb, to C3 for orders bigger than Qc,
and so on.
• If we look at the most expensive unit cost, C1,
we can draw a graph of the total cost per unit
time against the order size, as we did to find
the economic order quantity. In this case,
though, the curve will only be valid for order
quantities in the range zero to Qa.
Valid total cost curve
4. 4
K K Aggarwal, Dept of OR, DU
Optimal Solution under All-Units
Discount
Finding the lowest valid cost
• The optimal value of Q that corresponds to the lowest
point on the valid cost curve.
0
2
o
A
Q
IC
λ
λ
λ
λ
× ×
× ×
× ×
× ×
=
=
=
=
i
o
C
I
A
Q i
×
×
×
=
λ
2
We also know that:
We can express the holding cost as a proportion, I, of the
unit cost, and for each unit cost Ci, the minimum point of
the cost curve comes with Qoi. For each curve with unit cost Ci this minimum is
either “Valid” or “invalid”:
• A valid minimum is within the range of valid
order quantities for this particular unit cost.
• An invalid minimum falls outside the valid
order range for this particular unit cost.
5. 5
K K Aggarwal, Dept of OR, DU
18
Finding Q with all units discount
Quantity
Total
Cost
3
3
2
IC
A
Q
λ
=
2
2
2
IC
A
Q
λ
=
1
1
2
IC
A
Q
λ
=
• Every set of cost curves will have at least one
valid minimum, and a variable number of
invalid minima, as shown in Figure 4.4.
6. 6
K K Aggarwal, Dept of OR, DU
• Two other interesting features in the valid cost
curve. First, the valid total cost curve always
rises to the left of a valid minimum. This
means that when we search for an overall
minimum cost it is either at the valid minimum
or somewhere to the right of it. Second, there
are only two possible positions for the overall
minimum cost: it is either at a valid minimum,
or else at a cost break point (as shown in Fig.
4.5).
To Prove that cost curve do not intersect each other
i.e. TCj+1(Q) < TCj (Q)
( ) ( ) ( ) ( )
2
-
2
)
(
)
( 1
1
1
+
+
+
+
=
− +
+
+ λ
λ
λ
λ
j
j
j
j
j
j C
A
Q
IC
Q
C
A
Q
IC
Q
Q
TC
Q
TC
( ) [ ]
j
j
j
j
j
j C
C
C
C
QI
Q
TC
Q
TC −
+
−
=
− +
+
+ 1
1
1
2
)
(
)
( λ
( ) j
j
j
j
j
j C
C
C
C
QI
Q
TC
Q
TC <
<
−
+
=
− +
+
+ 1
1
1 as
0
2
)
(
)
( λ
)
(
)
(
1 Q
TC
Q
TC j
j <
⇒ +
7. 7
K K Aggarwal, Dept of OR, DU
Two-Step Solution Procedure
Step 1. Beginning with lowest price, calculate the EOQ for
each price level until a feasible EOQ is found. It is
feasible if it lies in the range corresponding to its
price. Each subsequent EOQ is smaller than the
previous one, because C, and thus H, gets larger and
because the larger H is in the denominator of the
EOQ formula.
Step 2. If the first feasible EOQ found is for the lowest price level,
this quantity is the best lot size. Otherwise, calculate the
total cost for the first feasible EOQ and for the larger price
break quantity at each lower price level. The quantity with
the lowest total cost is optimal.
Algorithm for Q* in All Units Discount
Case
• Let q0 (≡0), q1, …., qk(=∞) be the price break
quantities. That is, in the price break range [qj-
1 – qj) the unit cost is Cj.
• For j= 1,2, …, k calculate
• Qj*= (2Aλ/Hj)1/2, where Hj = iCj.
• If qj-1 ≤ Qj* ≤ qj, then Qj* is valid. Then it is the
best Q in that range. Set
• TCj(Qj
*) = Cj λ + (2Aλ/Hj)1/2
Algorithm for Q* in All Units Discount
Case
1. Set Q* =0, TC(Q*) = ∞ and j=k.
2. Compute Qj*; If qj-1 ≤ Qj* ≤ qj, compute
TCj(Qj*) = Cj λ + (2Aλ/Hj)1/2. Go to Step 4.
Otherwise set Qj* = qj-1 and TCj(Qj*) =
A λ/Qj
* + Cjλ + HjQj
*/2
3. If TCj(Qj*) ≤ TC(Q*) set
TC(Q*) = TCj(Qj*) and Q* = Qj* , j←j-1.
If j ≠ 0 go to step 2. Else stop, optimal
solution is at hand.
4. If TCj(Qj
*) < TC(Q*) set Q* = Qj* and TC(Q*)
= TCj(Qj
*). Stop, optimal solution is at hand.
8. 8
K K Aggarwal, Dept of OR, DU
Find Q with Quantity Discounts
EXAMPLE 1
A supplier for St. LeRoy Hospital has introduced quantity discounts to
encourage larger order quantities of a special catheter. The price schedule
is
Order Quantity Price per Unit
0 to 299 60.00
300 to 499 58.80
500 or more 57.00
The hospital estimates that its annual demand for this item is 936 units, its ordering cost is
45.00 per order, and its annual holding cost is 25 percent of the catheter’s unit price. What
quantity of this catheter should the hospital order to minimize total costs? Suppose the
price for quantities between 300 and 499 is reduced to 58.00. Should the order quantity
change?
Find Q with Quantity Discounts
SOLUTION
Step 1: Find the first feasible EOQ, starting with the lowest price level:
=
=
H
Aλ
2
EOQ 00
.
57
( )( )
( )
units
77
00
.
57
25
.
0
00
.
45
936
2
=
A 77-unit order actually costs 60.00 per unit, instead of the 57.00 per unit used in the
EOQ calculation, so this EOQ is infeasible. Now try the 58.80 level:
=
=
H
Aλ
2
EOQ 80
.
58
( )( )
( )
units
76
80
.
58
25
.
0
00
.
45
936
2
=
This quantity also is infeasible because a 76-unit order is too small to qualify for the 58.80
price. Try the highest price level:
Find Q with Quantity Discounts
This quantity is feasible because it lies in the range corresponding to
its price = 60.00
=
=
H
Aλ
2
EOQ 00
.
60
( )( )
( )
units
75
00
.
60
25
.
0
00
.
45
936
2
=
Step 2: The first feasible EOQ of 75 does not correspond to the lowest price level.
Hence, we must compare its total cost with the price break quantities (300 and
500 units) at the lower price levels (58.80 and 57.00):
9. 9
K K Aggarwal, Dept of OR, DU
Find Q with Quantity Discounts
( ) ( ) λ
λ
C
A
Q
H
Q
TC +
+
=
2
( )( )
[ ] ( ) ( ) 284
,
57
936
00
.
60
00
.
45
75
936
00
.
60
25
.
0
2
75
75 =
+
+
=
C
( )( )
[ ] ( ) ( ) 382
,
57
936
80
.
58
00
.
45
300
936
80
.
58
25
.
0
2
300
300 =
+
+
=
C
( )( )
[ ] ( ) ( ) 999
,
56
936
00
.
57
00
.
45
500
936
00
.
57
25
.
0
2
500
500 =
+
+
=
C
The best purchase quantity is 500 units, which qualifies for the deepest discount
Find Q with Quantity Discounts
EXAMPLE 2
Order Quantity Price per Unit
0 < Q < 500 0.3
500 ≤ Q < 1000 0.29
1000 ≤ Q 0.28
Demand rate = 600 unit/yr
Ordering cost = Rs. 8 per order
I = 20%
Stock out cost = Rs. 1 per unit / unit time
Find Q with Quantity Discounts
SOLUTION
Step 1: Find the first feasible EOQ, starting with the lowest price level:
units
x
x
x
IC
A
414
28
.
0
20
.
0
600
8
2
2
EOQ 0.28 ≈
=
=
λ
this EOQ is infeasible. Now try the Rs. 0.29 level:
This quantity also is infeasible. Try the highest price level:
units
x
x
x
IC
A
406
29
.
0
20
.
0
600
8
2
2
EOQ 0.29 ≈
=
=
λ
Find Q with Quantity Discounts
This quantity is feasible because it lies in the range corresponding to
its price, P = Rs.0.30
Step 2: The first feasible EOQ of 400 does not correspond to the lowest price level.
Hence, we must compare its total cost with the price break quantities ( 500
and 1000 units) at the lower price levels (Rs. 0.29 and Rs. 0.28):
units
x
x
x
IC
A
400
3
.
0
20
.
0
600
8
2
2
EOQ 0.3 ≈
=
=
λ
10. 10
K K Aggarwal, Dept of OR, DU
Find Q with Quantity Discounts
( ) ( ) λ
λ
C
A
Q
IC
Q
TC +
+
=
2
( )( )
[ ] ( ) ( ) 8
.
200
.
600
28
.
0
8
1000
600
28
.
0
2
.
0
2
1000
1000 Rs
TC =
+
+
=
The best purchase quantity is 500 units, which qualifies for the discount
( )( )
[ ] ( ) ( ) 1
.
198
.
600
29
.
0
8
500
600
29
.
0
2
.
0
2
500
500 Rs
TC =
+
+
=
( )( )
[ ] ( ) ( ) 200
.
600
3
.
0
8
400
600
3
..
0
2
.
0
2
400
400 Rs
TC =
+
+
=
Stock outs are allowed
Here Q will be different
+
=
π
π
λ IC
IC
A
2
EOQ
Total cost is
Q
IC
IC
+
=
π
S
( ) ( )
Q
S
Q
S
Q
IC
C
A
Q
TC
2
2
)
( 2
2
π
λ
λ
+
−
+
+
=
Substituting S we get Total cost in terms of Q optimised for S
( ) Q
IC
IC
Q
IC
IC
C
A
Q
TC
2
2
2
2
+
+
+
+
+
=
π
π
π
π
λ
λ
Stock outs are allowed
SOLUTION
Step 1: Find the first feasible EOQ, starting with the lowest price level:
this EOQ is infeasible. Now try the Rs. 0.29 level:
This quantity also is infeasible. Try the highest price level:
units
x
x
x
x
IC
IC
A
425
1
1
28
.
0
2
.
0
28
.
0
20
.
0
600
8
2
2
EOQ 0.28 ≈
+
=
+
=
π
π
λ
units
x
x
x
x
IC
IC
A
418
1
1
29
.
0
2
.
0
29
.
0
20
.
0
600
8
2
2
EOQ 0.29 ≈
+
=
+
=
π
π
λ
Find Q with Quantity Discounts
This quantity is feasible because it lies in the range corresponding to
its price, P = Rs.0.30
Step 2: The first feasible EOQ of 411 does not correspond to the lowest price level.
Hence, we must compare its total cost with the price break quantities ( 500
and 1000 units) at the lower price levels (Rs. 0.29 and Rs. 0.28):
units
x
x
x
x
IC
IC
A
411
1
1
3
.
0
2
.
0
3
.
0
20
.
0
600
8
2
2
EOQ 0.3 ≈
+
=
+
=
π
π
λ
11. 11
K K Aggarwal, Dept of OR, DU
Find Q with Quantity Discounts
( ) ( ) ( ) ( )
( )
( ) ( )
( )
31
.
199
.
1
28
.
0
2
.
0
28
.
0
2
.
0
1000
1
2
1
1
28
.
0
2
.
0
1
1000
28
.
0
2
.
0
2
1
8
1000
600
600
28
.
0 2
2
2
2
1000 Rs
x
x
x
x
x
x
x
x
TC =
+
+
+
+
+
=
The best purchase quantity is 500 units, which qualifies for the discount
( ) Q
IC
IC
Q
IC
IC
C
A
Q
TC
2
2
2
2
+
+
+
+
+
=
π
π
π
π
λ
λ
( ) ( ) ( ) ( )
( )
( ) ( )
( )
3
.
197
.
1
29
.
0
2
.
0
29
.
0
2
.
0
500
1
2
1
1
29
.
0
2
.
0
1
500
29
.
0
2
.
0
2
1
8
500
600
600
29
.
0 2
2
2
2
500 Rs
x
x
x
x
x
x
x
x
TC =
+
+
+
+
+
=
( ) ( ) ( ) ( )
( )
( ) ( )
( )
3
.
214
.
1
3
.
0
2
.
0
3
.
0
2
.
0
411
1
2
1
1
3
.
0
2
.
0
1
411
3
.
0
2
.
0
2
1
8
411
600
600
3
.
0 2
2
2
2
411 Rs
x
x
x
x
x
x
x
x
TC =
+
+
+
+
+
=
Incremental Quantity Discounts
Quantity Alternative I
All units discount
Alternative II
Incremental discount
0 < Q ≤ 500 0.60Q 0.60Q
500 < Q ≤ 1000 0.58Q 0.6(500) + 0.58(Q-500)
1000<Q <∞ 0.56Q 0.6(500) + 0.58(500) +
0.56(Q-1000)
Graph of All Units Discount
.56
.60
500
.58
1000 Q
Cost of
Material
Graph of Incremental Discount
.56
.60
500
.58
1000 Q
Cost of
Material
.6(500)
.6(500)+.5
8(500)
12. 12
K K Aggarwal, Dept of OR, DU
Optimal Solution under
Incremental Quantity Discounts
<
−
+
≤
<
−
+
≤
<
−
+
≤
<
−
+
≤
<
=
−
+
Q
q
q
Q
C
R
q
Q
q
q
Q
C
R
q
Q
q
q
Q
C
R
q
Q
q
q
Q
C
R
q
Q
Q
C
Q
C
n
n
n
n
j
j
j
j
j
),
(
),
(
),
(
),
(
0
,
)
(
1
1
3
2
2
2
2
2
1
1
1
1
1
0
0 0 1
0 1 0 1 1 1 2
0 1 0 1 2 1 2 2 2 3
0 1 0 1 2 1 1
0
, 0
( ) ( ) ,
( ) ( ) ( ) ,
( )
( ) ( ) .. . ( ) ,
(
j j j j
C Q q Q q
C q q C Q q q Q q
C q q C q q C Q q q Q q
C Q
C q q C q q C Q q q Q q
C
+
+
+
+
= < ≤
= < ≤
= < ≤
= < ≤
− + − < ≤
− + − < ≤
− + − < ≤
− + − < ≤
− + − + − < ≤
− + − + − < ≤
− + − + − < ≤
− + − + − < ≤
=
=
=
=
− + − + + − < ≤
− + − + + − < ≤
− + − + + − < ≤
− + − + + − < ≤
1 0 1
) . .. ( ) ,
n n n
q q C Q q q Q
−
−
−
−
− + + − <
− + + − <
− + + − <
− + + − <
0
)
(
0
1
1
1
=
−
+
= −
−
−
R
q
q
C
R
R j
j
j
j
j
Incremental Discount
• In order to develop an algorithm for this case we
need to define unit cost. For this, we will define
average unit cost. For
qj < Q ≤ qj+1, let
∑
∑
∑
∑
=
=
=
=
−
−
−
− +
+
+
+
≤
≤
≤
≤
≤
≤
≤
≤
−
−
−
−
+
+
+
+
−
−
−
−
=
=
=
=
−
−
−
−
+
+
+
+
=
=
=
=
j
k
j
j
j
j
k
k
k
j
j
j
q
Q
q
q
Q
C
q
q
C
q
Q
C
R
Q
C
1
1 1
),
(
)
(
)
(
)
(
Then, average unit cost = C(Q)/Q and
Incremental Discount
• average unit cost = C(Q)/Q and
• Cost at jth price break
( ) Q
Q
Q
C
I
Q
Q
C
A
Q
TC j
+
+
=
)
(
2
)
(
λ
λ
( )
+
−
+
+
=
2
)
(
)
( Q
IC
Q
q
Q
C
R
A
Q
TC
j
j
j
j λ
λ
( ) ( )
)
(
2
)
(
j
j
j
j
j
j
j q
Q
C
R
I
Q
q
Q
C
R
A
Q
TC −
+
+
−
+
+
= λ
λ
Incremental Discount
( ) ( )
)
(
2
)
(
j
j
j
j
j
j
j q
Q
C
R
I
Q
q
Q
C
R
A
Q
TC −
+
+
−
+
+
= λ
λ
( ) Q
C
I
q
IC
R
I
C
q
C
R
A
Q
TC j
j
j
j
j
j
j
j
j
2
2
2
+
−
+
+
−
+
= λ
λ
( )
−
+
=
−
+
=
2
2
j
j
j
j
j
j
j
j
j
q
IC
R
I
C
b
q
C
R
A
a
Let
λ
13. 13
K K Aggarwal, Dept of OR, DU
Incremental Discount
Q
C
I
b
a
Q
TC j
j
j
j
2
+
+
=
λ
( )
j
j
j
j
j
j
j
j
j
IC
q
C
R
A
Q
IC
a
Q
IC
Q
a
Q
TC
λ
λ
λ
−
+
=
=
⇒
=
+
−
=
∂
∂
2
2
0
2
2
Diff w.r.t Q we get
Incremental Discount
( )λ
j
j
j
j IC
a
b
TC 2
+
=
Minimum Cost at jth price break
Average Annual Cost Function
for Incremental Discount Schedule
• Observe that TC(Q) is continuous
• The optimal Q is one of the valid Q(i)’s
Optimal Solution under
Incremental Quantity Discount
14. 14
K K Aggarwal, Dept of OR, DU
Incremental Discount
• Theorem: The minimum of TCj(Qj*) never occurs at
breakpoints. Thus, the optimal Qj in the interval qj <
Q ≤ qj+1 is then
( )
j
j
j
j
j
IC
q
C
R
A
Q
λ
−
+
=
2
• To see this note:
• Observe that TC(Q) is continuous i.e.
• Also, the slope of TCj at qj is less than the slope
of TCj-1 at qj
• Thus the total cost does not have a relative
minimum at qj therefore absolute minimum
cannot occur at qj
• The optimal Q is one of the realized Q(i)’s
Optimal Solution under Incremental Quantity
Discount
m
1,...,
j
),
(
)
(
1 =
=
− j
j
j
j q
TC
q
TC
Average Annual Cost Function
for Incremental Discount Schedule
Optimal Solution under Incremental Quantity
Discount
m
1,...,
j
),
(
)
(
1 =
=
− j
j
j
j q
TC
q
TC
To Prove
( ) ( ) ( )
j
j
j
j
j
j
j
j
j
j
j
j
j
j
j
j
j
j
j
j
j
j
C
C
q
I
b
b
a
a
q
q
C
I
b
a
q
q
C
I
b
a
q
q
TC
q
TC
−
+
−
+
−
=
+
+
−
+
+
=
−
−
−
−
−
−
−
−
1
1
1
1
1
1
1
2
2
2
)
(
)
(
λ
λ
λ
Next Consider
( ) ( )
( )
)
(
)
(
1
1
1
1
1
1
1
1
1
1
1
1
1
1
−
−
−
−
−
−
−
−
−
−
−
−
−
−
−
=
+
−
−
+
−
=
+
−
−
=
−
+
−
−
+
=
−
j
j
j
j
j
j
j
j
j
j
j
j
j
j
j
j
j
j
j
j
j
j
j
j
j
j
C
C
q
q
C
q
C
q
q
C
R
R
q
C
q
C
R
R
q
C
R
A
q
C
R
A
a
a
0
)
(
0
1
1
1
=
−
+
= −
−
−
R
q
q
C
R
R j
j
j
j
j
15. 15
K K Aggarwal, Dept of OR, DU
Optimal Solution under Incremental Quantity
Discount
m
1,...,
j
),
(
)
(
1 =
=
− j
j
j
j q
TC
q
TC
To Prove
Also
( )
−
−
=
−
+
−
−
+
=
−
−
−
−
−
−
−
λ
λ
λ
2
2
2
2
2
1
1
1
1
1
1
j
j
j
j
j
j
j
j
j
j
j
j
j
Iq
C
C
q
IC
R
I
C
q
IC
R
I
C
b
b
( ) ( )
( ) ( )
0
2
2
)
(
2
2
)
(
)
(
)
(
1
1
1
1
1
1
1
=
−
−
−
−
+
−
=
−
+
−
−
+
−
=
−
−
−
−
−
−
−
−
j
j
j
j
j
j
j
j
j
j
j
j
j
j
j
j
j
j
j
j
j
j
C
C
q
I
Iq
C
C
C
C
C
C
q
I
Iq
C
C
C
C
q
q
q
TC
q
TC
λ
λ
λ
λ
Substituting the above results we get
Optimal Solution under Incremental Quantity Discount
j
j
j
j
j
j
j
j
j
j
q
q
TC
q
q
TC
e
i
q
TC
q
TC
∂
∂
<
∂
∂
<
−
−
)
(
)
(
.
.
at
of
Slope
at
of
Slope
1
1
To Prove
1
1
2
1
1
1
1
2
2
2
)
(
2
2
)
(
−
−
−
−
−
−
+
−
=
+
+
∂
∂
=
∂
∂
+
−
=
+
+
∂
∂
=
∂
∂
j
j
j
j
j
j
j
j
j
j
j
j
j
j
j
j
j
j
j
j
j
j
j
j
C
I
a
q
q
C
I
b
a
q
q
q
q
TC
C
I
a
q
q
C
I
b
a
q
q
q
q
TC
λ
λ
λ
λ
Consider
1
1
1
1
2
1
1
2
1
as
0
2
)
(
)
(
2
)
(
)
(
2
)
(
)
(
)
(
−
−
−
−
−
−
−
<
<
+
−
=
−
+
−
=
−
+
−
−
=
∂
∂
−
∂
∂
j
j
j
j
j
j
j
j
j
j
j
j
j
j
j
j
j
j
j
j
j
j
C
C
I
q
C
C
C
C
I
C
C
q
q
C
C
I
a
a
q
q
q
TC
q
q
TC
λ
λ
λ
)
( 1
1 −
− −
=
− j
j
j
j
j C
C
q
a
a
Verbal Description of Incremental
Discount Algorithm
1. Determine an algebraic expression for the
average cost C(Q)/Q corresponding to each
price interval.
2. Substitute the expression in the TC(Q)
function. Obtain the Q* that minimizes this
TC(Q) for each interval.
3. Determine which minima obtained in Step 2
are realizable. Among them choose the one
with the smallest TC(Q*).
Incremental Discount
• Thus the algorithm is
• Set Q* = 0. TC(Q*)=∞, j=1.
• Step 1. Compute Qj using the formula in the previous
slide
• If qj-1 ≤ Qj ≤ qj compute TC(Qj). Else, set TCj(Qj)=∞
• Step 2. Set j= j+1, if j≤ k go to Step 1 (k is the no. of
price breaks)
• Step 3. Let TCb(Qb)=minj=1,2,..,k TCj(Qj)
• Then Q* = Qb, TC(Q*) = TCb(Q*)
16. 16
K K Aggarwal, Dept of OR, DU
Example: Quantity Discounts
Quantity Incremental Discount
Cost of item
qo = 0 < Q ≤ 200 100
q1 = 200 < Q ≤ 500 95
q2 = 500<Q <∞ 90
Demand is 1000/year. Fixed cost of placing an order is Rs. 100,
and holding costs are based on a 20% annual interest rate.
Compute EOQ
Example: Quantity Discounts
Compute
( ) ( ) 100
100
2
.
0
1000
100
0
0
100
2
2
0
0
0
0
0 =
−
+
=
−
+
=
x
x
IC
q
C
R
A
Q
λ
Q0 is in the range
( )
( ) 340
95
2
.
0
1000
200
95
10
2
100
2
)
200
(
100
0
)
(
R
2
4
0
1
0
0
1
1
1
1
1
1
≈
−
+
=
+
=
−
+
=
−
+
=
x
x
x
q
q
C
R
IC
q
C
R
A
Q
λ
Q1 is in the range
Example: Quantity Discounts
Q2 is in the range
( )
( ) 632
90
2
.
0
1000
500
90
48500
100
2
48500
)
300
(
95
20000
)
(
R
2
1
2
1
1
2
2
2
2
2
2
≈
−
+
=
=
+
=
−
+
=
−
+
=
x
x
q
q
C
R
IC
q
C
R
A
Q
λ
Now Compute ( )λ
j
j
j
j IC
a
b
TC 2
+
=
( )
( ) 3600
500
90
48500
100
1100
200
95
10
2
100
100
0
100
0
100
2
4
1
0
=
−
+
=
=
−
+
=
=
−
+
=
x
a
x
x
a
x
a
( )
−
+
=
−
+
=
2
2
j
j
j
j
j
j
j
j
j
q
IC
R
I
C
b
q
C
R
A
a
λ
93500
2
500
90
2
.
48500
2
2
.
90
1000
95100
2
200
95
2
.
20000
2
2
.
95
1000
100000
2
0
100
2
.
0
2
2
.
100
1000
2
1
0
=
−
+
=
=
−
+
=
=
−
+
=
x
x
x
x
b
x
x
x
x
b
x
x
x
x
b
Example: Quantity Discounts
( ) ( )
102000
2000
100000
1000
100
2
.
0
100
2
100000
2 0
0
0
0
=
+
=
+
=
+
= x
x
x
IC
a
b
TC λ
( ) ( )
101565.29
6465.29
95100
1000
95
2
.
0
1100
2
95100
2 1
1
1
1
=
+
=
+
=
+
= x
x
x
IC
a
b
TC λ
( ) ( )
101734.2
11384.2
90350
1000
90
2
.
0
3600
2
90350
2 2
2
2
2
=
+
=
+
=
+
= x
x
x
IC
a
b
TC λ
TC1 is the minimum. Thus EOQ = Q1 = 340
19. 19
K K Aggarwal, Dept of OR, DU
73
1. Determine an algebraic expression for C(Q)
corresponding to each price interval. Use that to
determine an algebraic expression for C(Q)/Q
2. Substitute the expression derived for C(Q)/Q into the
defining equation for G(Q). Compute the minimum value
of Q corresponding to each price interval separately.
3. Determine which minima computed in (2) are realizable
(that is, fall into the correct interval). Compare the values
of the average annual costs at the realizable EOQ values
and pick the lowest.
Incremental Discounts: Solution
Technique