Download to read offline


![International Journal of Scientific Research and Engineering Development-– Volume X Issue X, Year
Available at www.ijsred.com
ISSN : 2581-7175 ©IJSRED: All Rights are Reserved Page 177
III. EXISTING SYSTEM
An automatic soft computing approach
BRBFNN for identification and classification of
disease from plant leaves. The proposed method
uses Bacterial Foraging Optimization (BFO) to
assign optimal weight to Radial Basis Function
Neural Network (RBFNN) and to find the optimal
region for the different disease present on the plant
leaves. The efficiency of the Radial Basis Function
Neural Network is further enhanced by using region
growing method searching for seed points and
grouping them having similar attributes that help in
feature extraction process.[1]
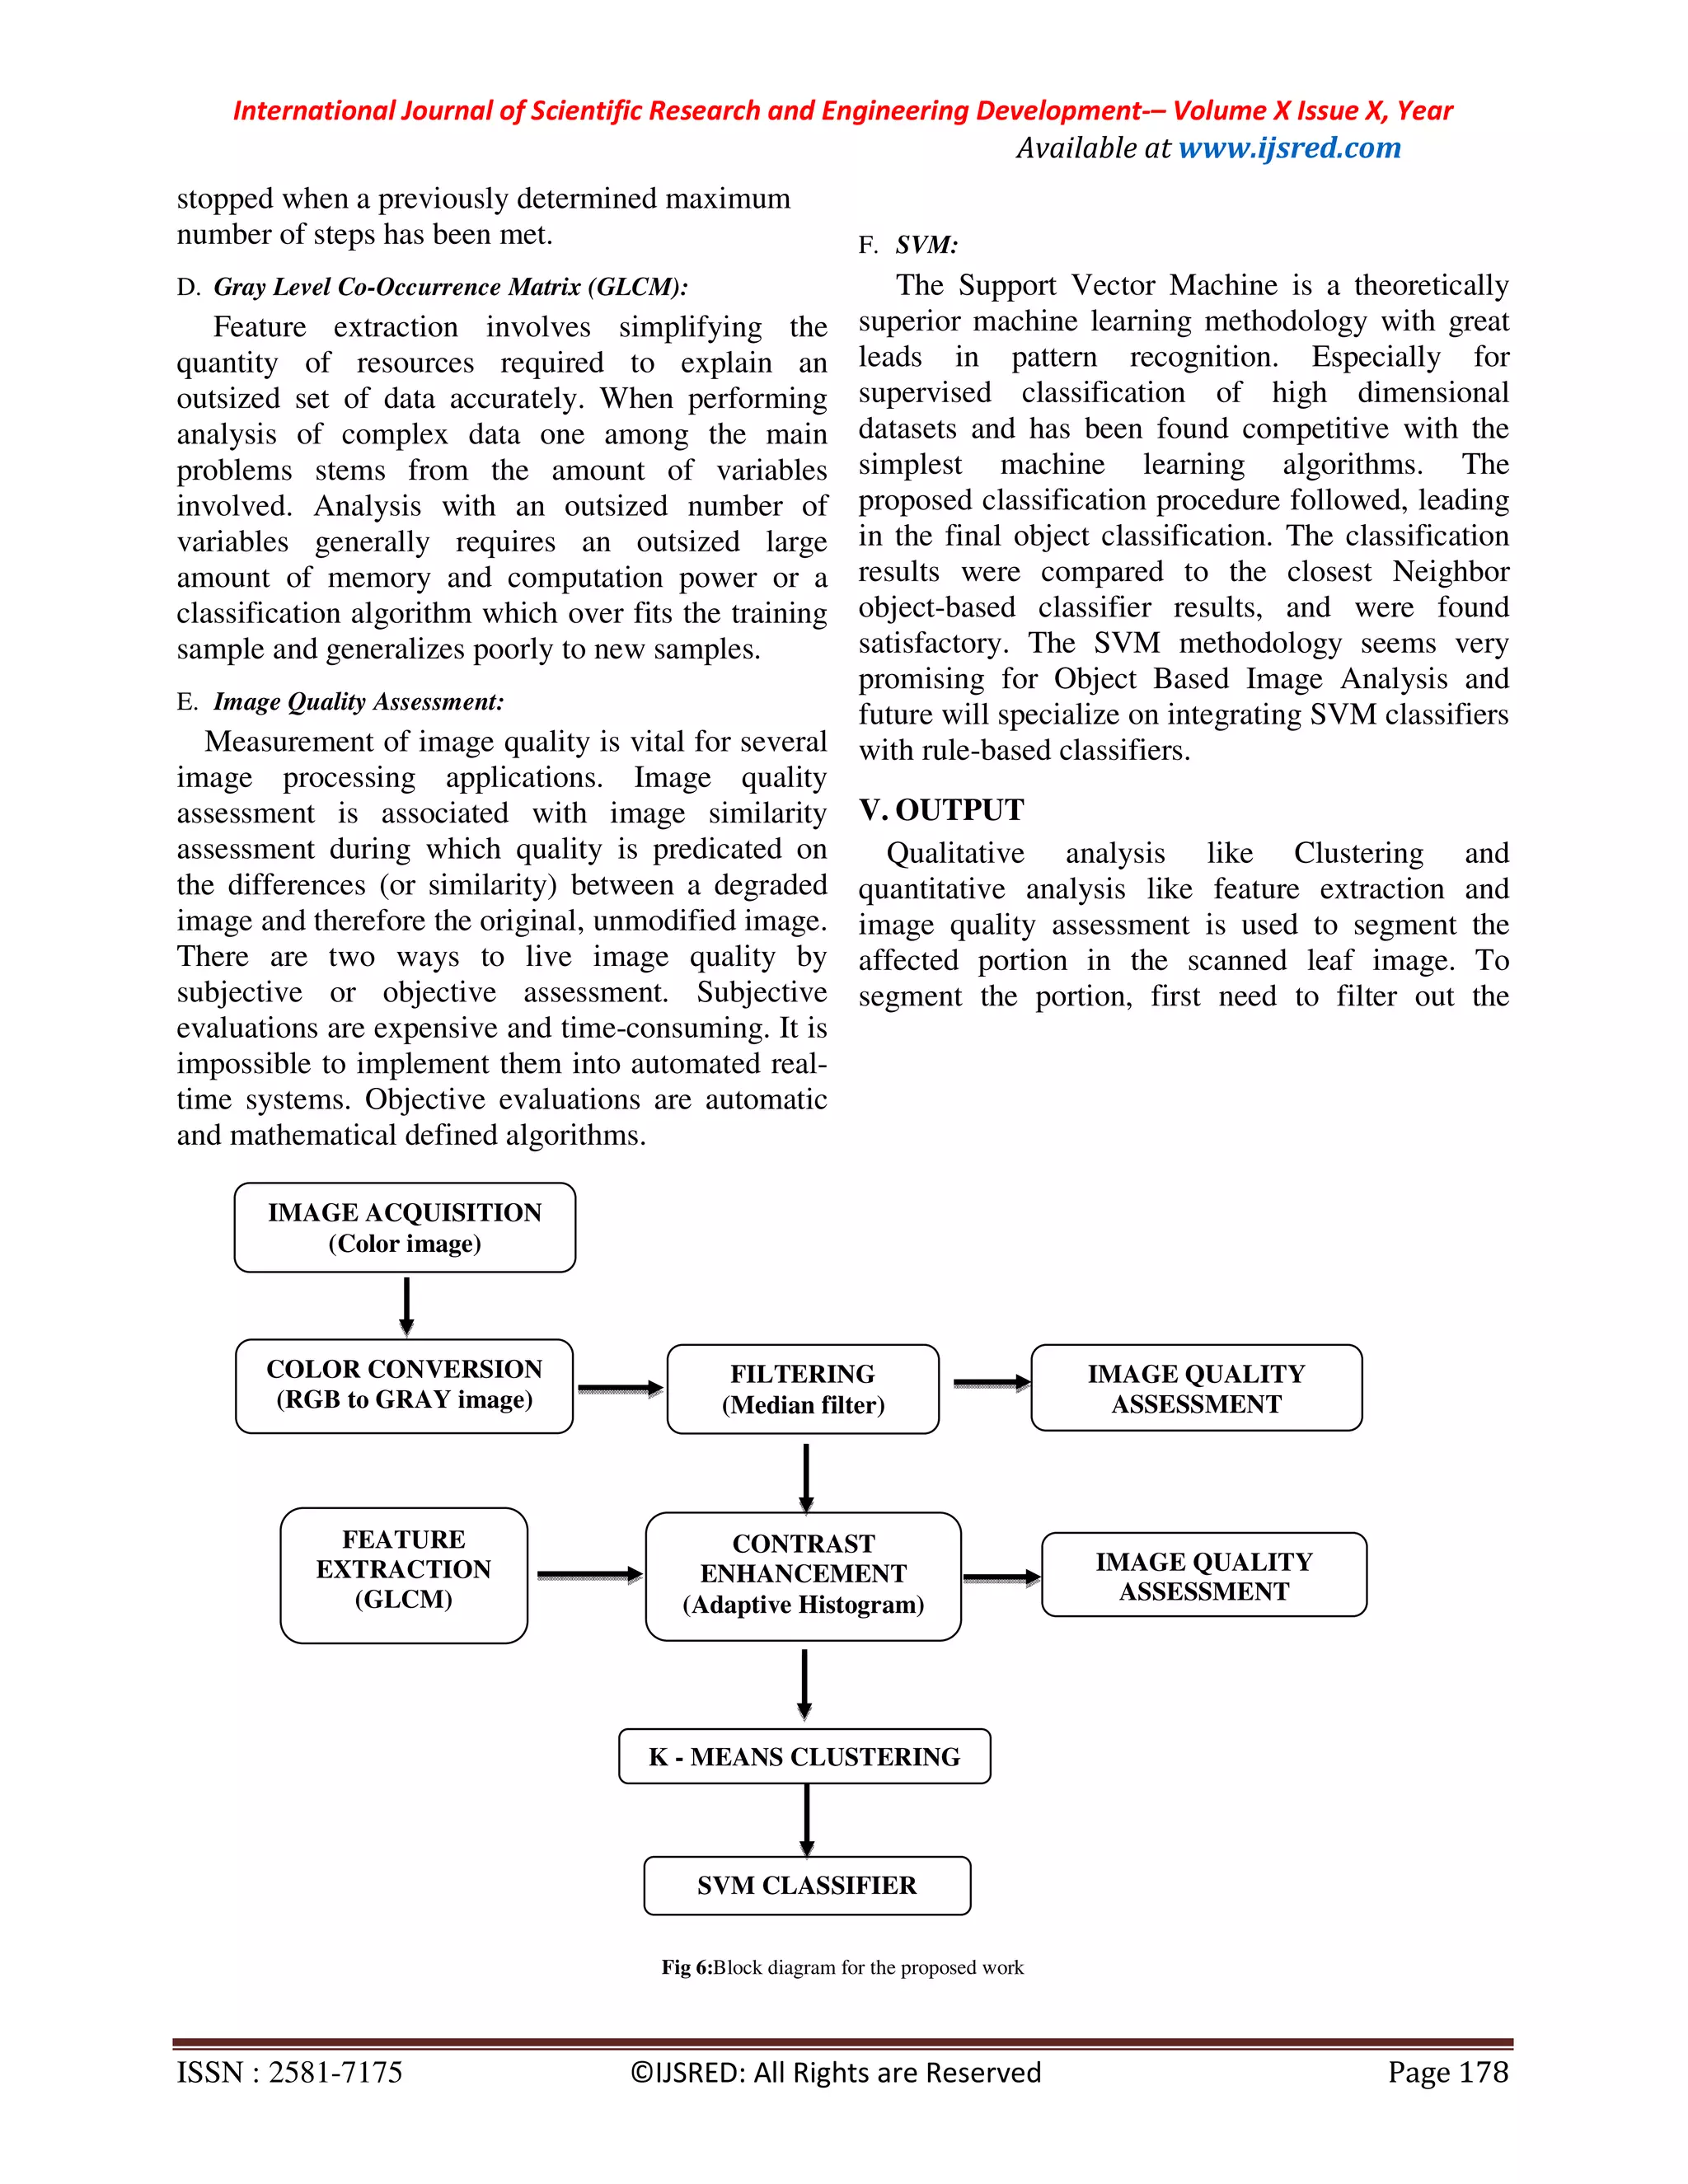
Fig. 5. Methodology for the existing work
IV. PROPOSED SYSTEM
The proposed method includes various
techniques such as changing image size, filtering of
noise, image conversion, enhancing image. K-means
clustering method partitions the images into clusters
in such a way that at least one part of cluster
contains an image with major area of affected part.
GLCM has been used extensively in the field of
image processing. It has been for texture analysis in
gray scale as well as color texture recognition. The
different methods implemented in this project within
MATLAB are been explained below.
A. Median filter
The input image is pre-processed by the median
filter for better results. The main idea of the median
filter is to run through the signal entry by entry,
replacing each entry with the median of
neighboring entries referred as window pattern.
B. Adaptive Histogram Equalization
AHE improves the local contrast and
enhances the definitions of edge in each region of
an image. AHE features a tendency to overamplify
noise in relatively homogeneous regions of an
image. A variant of adaptive histogram equalization
called contrast limited adaptive histogram
equalization (CLAHE) prevents this by limiting the
amplification. Each pixel is transformed supported
on the histogram of a square surrounding the pixel.
The transformation function is proportional to the
cumulative distribution function (CDF) of pixel
values in within the neighbourhood.
C. K Means Clustering:
K-Means starts by randomly defining k centroids.
From there, it works in iterative (repetitive) steps to
perform two tasks:
1. Assign each data point to the closest
corresponding centroid, using the standard
Euclidean distance. In layman’s terms: the
straight-line distance between the data point
and the centroid.
2. For each centroid, calculate the mean of the
values of all the points belonging to it. The
mean value becomes the new value of the
centroid.
Once step 2 is complete, all of the centroids
have new values that correspond to the means of all
of their corresponding points. These new points are
put through steps one and two producing yet one
more set of centroid values. This process is repeated
over and over until there is no change with in the
centroid values, meaning that they need been
accurately grouped. Or, the method are often](https://image.slidesharecdn.com/ijsred-v3i5p27-200919143321/75/Quantitative-and-Qualitative-Analysis-of-Plant-Leaf-Disease-3-2048.jpg)
![International Journal of Scientific Research and Engineering Development-– Volume X Issue X, Year
Available at www.ijsred.com
ISSN : 2581-7175 ©IJSRED: All Rights are Reserved Page 180
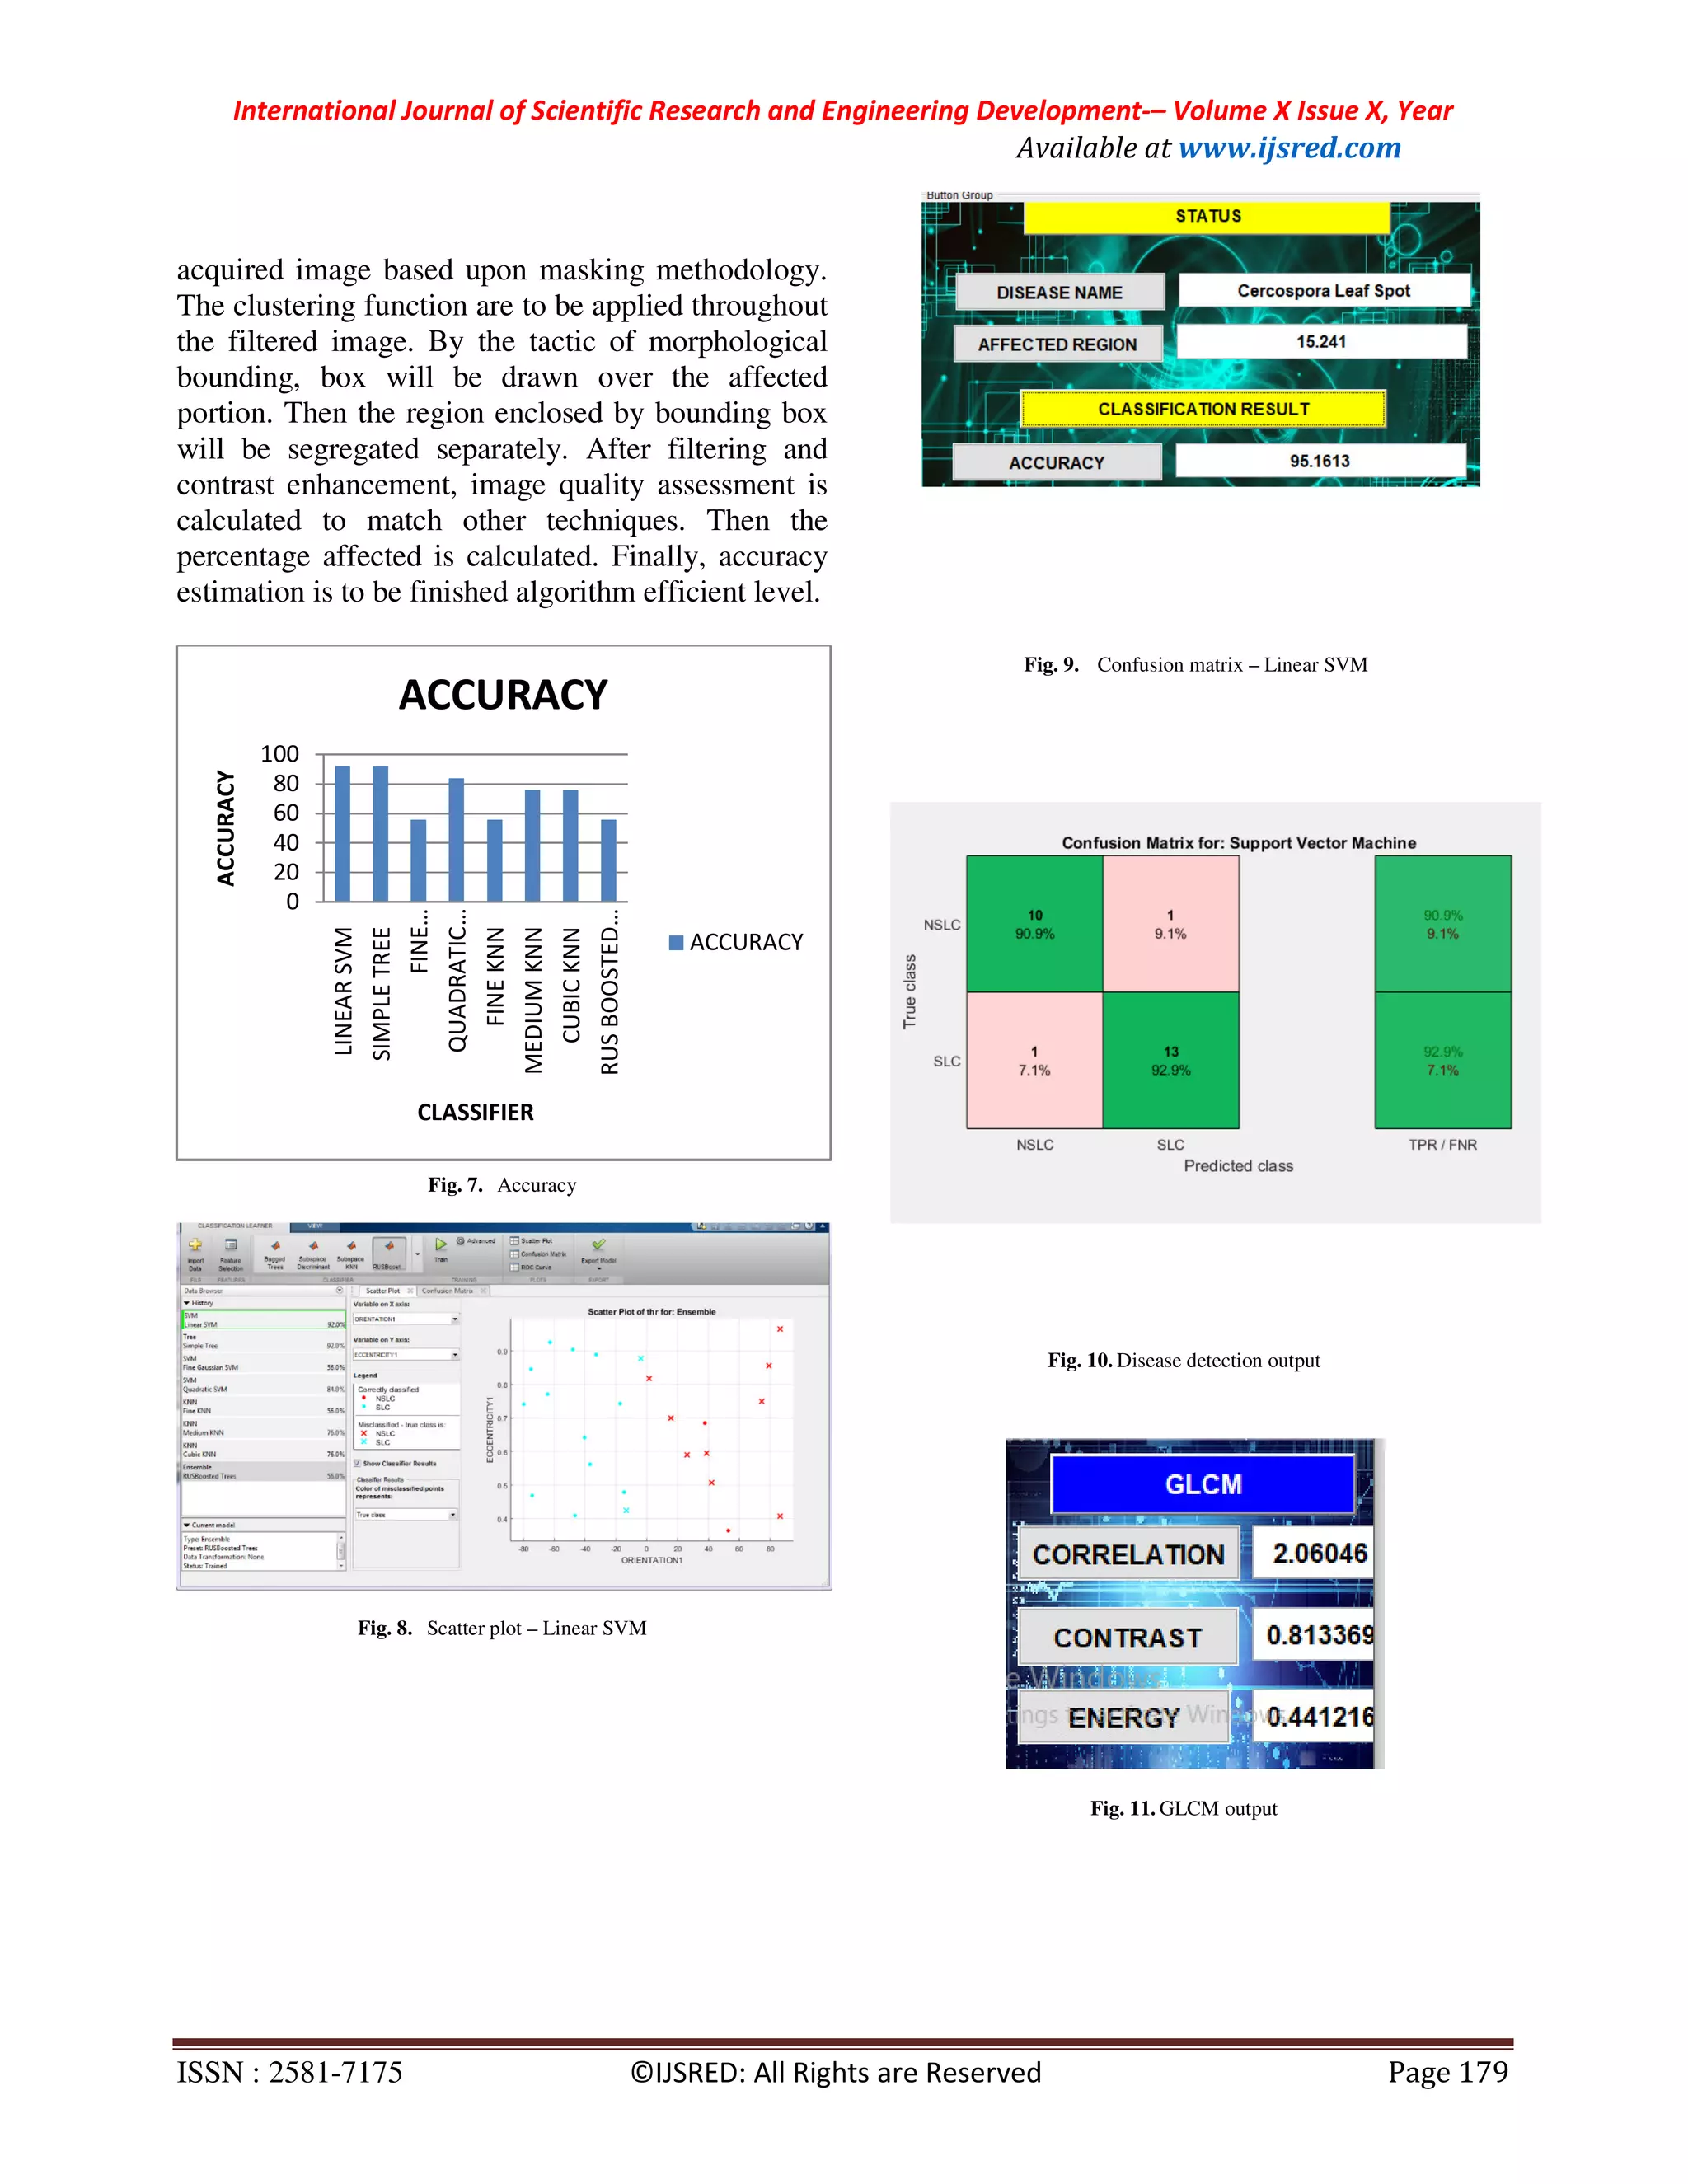
Fig. 12. Image quality assessment results
VI. CONCLUSION
In this paper, the detection and classification
of plant leaf disease is made by means if KNN
techniques, segmentation and detection by means of
intensity computation, thresholding and features
extraction. The diseases are classified with the help
of SVM and were able to distinguish between four
different types of grading level with an average
accuracy of 94.17%. As an extension of our work, it
is suggested to identify and classify various stages
of plant diseases and different diseases caused by
bacteria and virus.
REFERENCES
[1] Siddharth Singh Chouhan, Uday Pratap Singh, Sanjeev Jain. (2018),
“Bacterial foraging optimization based Radial Basis Function Neural
Network (BRBFNN) for identification and classification of plant leaf
diseases: An automatic approach towards Plant Pathology”, IEEE, Vol.
06, pp 8852 – 8863.
[2] Arivazhagan, S., R. Newlin Shebiah, S. Ananthi, and S. Vishnu Varthin.
“Detection of unhealthy region of plant leaves and classification of plant
leaf diseases using texture features.” Agriculture Engineering
International: CIGR Journal 15, No.1 (2013): 211–217.
[3] Xihai zhang, Yue qiao, Fanfeng meng.(2018), “Identification Of Maize
AND Leaf Diseases Using Convolutional Neural Network”, IEEE, Vol.
06, pp 30370 – 30377.
[4] Sushil R. Kamlapurkar. (2016), “Detection of Plant Leaf Disease Using
Image Processing Approach”, IJSRP, Vol. 6, No. 02, pp 73 – 76.
[5] Ayesha .L Tilwani , Prof. Devang G. Jani.(2017), “Disease Detection in
Leaves using Image Processing Techniques”, IRJET, Vol 04, pp 1639 –
1642.
[6] Mr. Sanjay Mirchandani, Mihir Pendse, Prathamesh Rane, Ashwini
Vedula.(2018), “Plant disease detection and classification using image
processing and artificial neural networks”, IRJET, Vol. 05, No.06.
[7] Dr. S. K. Jayanthi, C.Lalitha. (2017), “Betel Leaf Disease Detection
Using Histogram of Oriented Gradients and Multiclass SVM”, IRJET,
Vol. 05, No.08.
[8] N.Neelaveni, S. Rajeswari. (2016), “Paddy Leaf Disease Detection
Classification and Remedy Finder Using K means Clustering and Image
Mining”, Vol. 04 No 12.
[9] Shweta.S. Kothawale, S.R.Barbade, Pradnya .P.Mirajkar. (2018),
“Grape Leaf Disease Detection Using SVM Classifie”, IRJET, Vol. 06,
No.04.
[10] Nikhil Govinda Dhakad, Umesh Shyamkant Yewale, Tejal Yuvraj Patil,
Gayatri Avinash Deore, (2018), “Leaf disease detection using Image
Processing”, IRJET, Vol.05, No.12.](https://image.slidesharecdn.com/ijsred-v3i5p27-200919143321/75/Quantitative-and-Qualitative-Analysis-of-Plant-Leaf-Disease-6-2048.jpg)

This document discusses a technique for detecting plant leaf diseases using image processing. It begins with an introduction to plant pathology and the importance of identifying plant diseases. Common plant leaf diseases like Alternaria Alternata, Anthracnose, Bacterial blight, and Cercospora Leaf Spot are described along with their symptoms. The existing methods of disease identification are discussed. The proposed method uses various image processing techniques like filtering, histogram equalization, k-means clustering, and Gray Level Co-occurrence Matrix (GLCM) feature extraction to detect diseases. Image quality is then assessed to identify the affected regions of the leaf.