


![© eG Innovations, Inc. | www.eginnovations.com
Response Time = Latency
24
• RT = Wt + Qt [ Wt = Wait Time, Qt = Queuing
Time ]
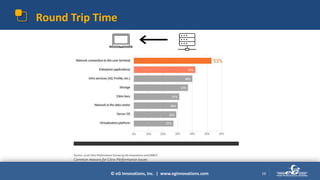
• Try to keep Response time to less than 250ms
• Includes Latency of any protocol:
– ICA
– EDT
– PCoIP
– Blast
– TCP](https://image.slidesharecdn.com/wendyhowarddatacon2020-201104005107/85/Quantifying-Genuine-User-Experience-in-Virtual-Desktop-Ecosystems-24-320.jpg)


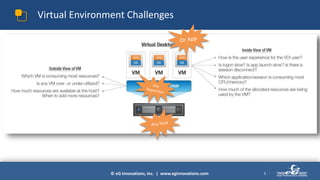
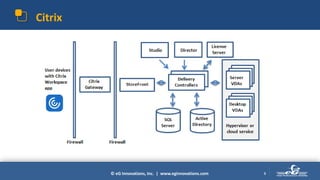
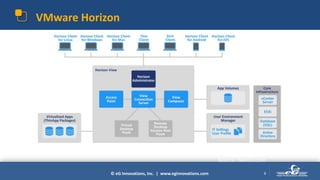
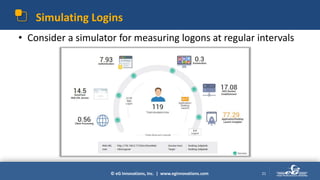
The document discusses the challenges of managing user experience in virtual environments, highlighting the complexity of identifying performance issues stemming from various factors such as latency, bandwidth, and response times. It outlines key metrics for measuring user experience, including logon times and connection quality, while providing guidelines for effective monitoring practices. Additionally, it presents solutions offered by eg innovations for monitoring user experience across platforms like VMware Horizon and Citrix.