Quantifying Effects of EU Antidumping Duty on Vietnam Footwear.pdf
1. UNIVERSITY OF ECONOMICS INSTITUTE OF SOCIAL STUDIES
HO CHI MINH CITY ERASMUS UNIVERSITY ROTTERDAM
VIETNAM THE NETHERLANDS
VIETNAM - NETHERLANDS
PROGRAMME FOR M.A IN DEVELOPMENT ECONOMICS
Quantifying Effects of EU Antidumping Duty on
Vietnam Footwear
By NguyễnTrườngToan
A thesis submitted in partial fulfilment of the requirements for the degree of
Master of Arts in Development Economics
Under the Supervision of:
Assoc.Prof. Dr.PhạmHoàngVăn and Assoc.Prof. Dr.NguyễnTrọngHoài
HO CHI MINH CITY, April 2014
2. ii
DECLARATION
This is to certify that this thesis entitled “Quantifying effects of EU antidumping
duty on Vietnam footwear”, which is submitted by me in fulfillment of the requirements for
the degree of Master of Art in Development Economic to the Vietnam – The Netherlands
Programme. The thesis constitutes only my original work and due supervision and
acknowledgement have been made in the text to all materials used.
Nguyễn Trường Toan
3. iii
ACKNOWLEDGEMENT
I would never have been able to finish my dissertationwithout the help and support of
people surrounding me.
First and foremost, I would like to express my gratitude tomy mentors Assoc. Prof.
Dr. PhạmHoàngVăn, and Assoc. Prof. Dr. NguyễnTrọngHoài for the continuous support of
my M.A. study and research; for their patience, encouragement, erudite knowledge. Their
excellent guidance encouraged me in all the time of doing this study. I have been strikingly
lucky to have supervisors who cared so much my thesis, and answered to all my questions
and queries punctually. I could not have imagined having better supervisors and advisors for
my research.
Besides my mentors, I would like to thank Dr Pham Khánh Nam and Prof Jame
Riedel for their thorough comments and worthy ideas that help to enhance my thesis’s value.
My sincere thanks also goes toall the lecturers at the Vietnam –
NetherlandsProgram for their knowledge of all the courses, during the time I studied
at theprogram.I would like to offer my special thanks to Dr. LêVănChơn, Dr,
TrươngĐăngThụy, Dr. Lorenzo pellegrini who help me significantly in the courses and
thesis writing processes. In addition, I would like to express my great appreciation to my
friends for their motivations.
Last but not the least;I owe a very important debt tomy family: my parents
NguyễnVănTố and Đỗ Thị Liễu, for giving birth to me at the first place and supporting me
spiritually throughout my life.
Hồ Chí Minh city, April 2014
NguyễnTrườngToan
4. iv
ABBREVIATIONS
AD Antidumping Duties
GATT General Agreement on Tariffs and Trade
WTO World Trade Organization
EU European Union
U.S United States
EC European Commission
C.I.F cost.insurance. freight
CN8 8-digit Combined Nomenclature code
HTS Harmonized Tariff Schedule
F.O.B Free on Board
GSO Vietnam General Statistics Office
BTA Bilateral Trade Agreement
USITC United States International Trade Committee
EUROSTAT European Commission Statistic Office
W.P.T wood and wooden, papers and textiles
5. v
ABSTRACT
This paper examines effect of EU antidumping on Vietnam footwear firms. We find
that EU AD causes a 52.8% decline of Vietnam targeted export products, at least. Besides
value, there is 42.2% reduction of the least affected scenario. For the most impacted images,
it leads to a fall of 105.6% and 107,1% for value and volume in five years after AD,
respectively. This paper also indicates that there is no association between AD and price of
Vietnam export. We find very little evidence that Vietnam footwear firm’s revenue, labor
payroll and jobs have association with AD. It is only small firms decline revenue, but small
firms contribute only 1.65% total revenue of footwear. And, there is no evidence that
footwear firm discharge their employees because of AD. We find the explanation for this
interesting phenomenon from trade diversion story. There is no evidence of product
diversion of Vietnam firms to EU. But, it is strongly evident that Vietnam firms significantly
diverse their markets toward U.S.
Keywords: Antidumping, Vietnam Footwear
6. vi
LIST OF FIGURES
Figure 2.1. Home Import Demand ................................................................................................................. 7
Figure 2.2. Foreign Export Supply Curve....................................................................................................... 8
Figure 2.3. Impact of tariff on import price and volume ................................................................................. 9
Figure 2.4. Effect of tariff on social welfare in case of large country ............................................................ 11
Figure 2.5. Effect of tariff on Home demand in case of small country .......................................................... 11
Figure 2.6. Effect of export subsidy on export country................................................................................. 13
Figure 2.7. Infant Industry Protection .......................................................................................................... 14
Figure 2.8. Impact of reciprocal dumping on welfare ................................................................................... 18
Figure 2.9. Conceptual framework............................................................................................................... 24
Figure 3.1. Top five Vietnamese export goods exclude oil in 2004............................................................... 26
Figure 3.2.Top five footwear exporters to EU .............................................................................................. 27
Figure 3.3. EU import Vietnam AD footwear and non-AD footwear ............................................................ 29
Figure 4.1. Difference in Difference Method................................................................................................ 41
Figure 4.2. Trend of export value, quantity, price of Vietnam AD Footwear and control groups to EU ......... 44
Figure 4.3. Some main Vietnamese export goods......................................................................................... 55
Figure 4.4. Trend of export value, quantity, price of Vietnam Non-AD Footwearand control groups to EU .. 64
Figure 4.5. Trend of export value, quantity, price of Vietnam Footwear and control groups to USA ............. 70
LIST OF TABLE
Table 1.1. Merchandise exports by selected economy (USA, Canada, Mexico, Brazil, Argentina, China,
Japan, India, Australia and New Zealand, South Africa, Germany, United Kingdom, France, Italia) in billion
USD.............................................................................................................................................................. 1
Table 1.2. Vietnam Merchandise Trade in percent over GDP ......................................................................... 3
Table 1.3. Vietnam export to EU in million USD........................................................................................... 4
Table 3.1. EU AD on Vietnam and People Republic China Footwear........................................................... 28
Table 3.2.Vietnam AD footwear export value, volume, price to US compareto control groups ..................... 30
Table 3.3.Vietnam Non- AD footwear export value, volume, price to US compareto control groups ............ 32
Table 3.4. Descriptive Statistics of Vietnam Firms Characteristics ............................................................... 33
Table 3.5.Vietnam footwear export value, volume, price to US compareto control groups............................ 37
Table 4.1.Vietnam AD footwear export value to EU compares to control groups ......................................... 46
Table 4.2.Vietnam AD footwear export volume to EU compares tocontrol groups ....................................... 47
Table 4.3. Vietnam AD footwear export price to EU compare tocontrol groups............................................ 48
Table 4.4. Footwear firm’s revenue compares to Apparel over period 2004-2006......................................... 50
Table 4.5 Footwear firm’s revenue compares to Apparel over period 2003-2007.......................................... 51
Table 4.6.Footwear firm’s revenue compare to W.P.Tover period 2004-2006 .............................................. 52
Table 4.7.Footwear firm’s revenue compare to W.P.Tover period 2003-2007 .............................................. 54
Table 4.8.Footwear labor’spayrollcompare to Apparelover period 2004-2006.............................................. 57
Table 4.9. Footwear labor’spayrollcompare to W.P.Tover period 2004-2006 ............................................... 58
7. vii
Table 4.10. Footwear firm’s sizecompare to Apparelover period 2004-2006 ................................................ 60
Table 4.11. Footwear firm’s sizecompare to W.P.Tover period 2004-2006................................................... 61
Table 4.12.Vietnam non-AD footwear export value to EU compares to control groups................................. 65
Table 4.13. Vietnam non-AD footwear export volume to EUcompares tocontrol groups .............................. 67
Table 4.14.Vietnam non-AD footwear export price to EU compares to control groups ................................. 68
Table 4.15. US Import value of Vietnam footwear compares tocontrol groups ............................................. 72
Table 4.16.US Import volume of Vietnam footwear compares tocontrol groups ........................................... 73
Table 4.17.US Import price of Vietnam compares tocontrol groups ............................................................. 74
Table A.1Footwear labor’spayrollcompare to Apparelover period 2003-2007 .............................................. 87
Table A.2. Footwear labor’s payroll compare to W.P.T over period 2003-2007............................................ 87
Table A.3 Footwear firm’s size compare to Apparel over period 2003-2007 ................................................ 88
Table A.4Footwear firm’s sizecompare to W.P.Tover period 2003-2007...................................................... 89
8. viii
Contents
Chapter 1: Introduction.................................................................................................................................. 1
1.1 Research context and problem statement ........................................................................................ 1
1.2 Research objectives:....................................................................................................................... 4
1.3 Research questions:........................................................................................................................ 4
1.4 Research methodology, data and scope........................................................................................... 5
1.5 Thesis structure.............................................................................................................................. 5
Chapter 2: Literature Review......................................................................................................................... 6
2.1 Theoretical Review ........................................................................................................................ 6
2.1.1 Market analysis in context of Trade in a single industry .......................................................... 6
2.1.2 Effect of a tariff...................................................................................................................... 8
2.1.3 Export subsidies ................................................................................................................... 12
2.1.4 Dumping .............................................................................................................................. 13
2.1.5 Antidumping Duties ............................................................................................................. 18
2.2 Empirical Review......................................................................................................................... 21
2.3 Conceptual Framework ................................................................................................................ 23
Chapter 3: An overview of Vietnamese Footwear Industry........................................................................... 26
3.1 EU tax rising on Vietnamese footwear.......................................................................................... 26
3.2 Data Description .......................................................................................................................... 29
3.2.1 EU Import 8-digit (CN8) Data .............................................................................................. 29
3.2.2 Vietnam Enterprise Survey Data........................................................................................... 33
3.2.3 US Import 10-digit (HTS10) Data......................................................................................... 36
Chapter 4: Model Estimation and Research Findings ................................................................................... 39
4.1 Double Difference Approach........................................................................................................ 39
4.2 Double Difference in Multiple Years............................................................................................ 41
4.3 Estimation Impact of EU Antidumping on Vietnam Footwear Export........................................... 42
4.4 Estimation Impact of EU Antidumping on Vietnam Footwear Firms............................................. 49
4.4.1 Firm revenue ........................................................................................................................ 49
4.4.2 Firm size and labor payroll ................................................................................................... 56
4.5 Trade Diversion ........................................................................................................................... 62
4.5.1 Product Diversion................................................................................................................. 62
4.5.2 Market Diversion.................................................................................................................. 68
9. ix
Chapter 5: Discussion and Conclusion......................................................................................................... 76
5.1 Conclusion Remarks .................................................................................................................... 76
5.2 Policy implications....................................................................................................................... 77
5.3 Limitation and future direction ..................................................................................................... 77
References................................................................................................................................................... 79
Appendix 1.................................................................................................................................................. 83
Appendix 2.................................................................................................................................................. 87
10. 1
Chapter 1: Introduction
1.1 Research context and problem statement
Trade has been growing significantly in recent decades. Basic statistics given by
World Trade Organization (WTO) demonstrates undoubted evidence of impressive upward
trend in export and import merchandises products (Table 1.1). Consequently, international
economics study is getting more and more important. Some economists indicate trade as
momentum of growth (Frankel & Romer, 1999; Irwin & Terviö, 2002; Wacziarg & Welch,
2008) . This might be explained by some main channels. Firstly, labor division could lead to
efficiency gains. In addition, trade growth lead to larger market; thus, firms could get more
benefit from economy of scale. Also, contract with foreign partners could import modern
technology while competition creates more motivations to enhance skills and performance.
Trade openness could bring capital investment to low-capital countries as well. Why trade
expands? Causes of trade openness were examined by (Baier & Bergstrand, 2001; P.
Krugman, Cooper, & Srinivasan, 1995).They points out technology improvements, leading
to cutting transportation cost and communication cost, are one of reason for trade
enhancement. Furthermore, governments has been changing policies which aims to more
integrated instead of bounded off; for example, joining bilateral trade agreement and
multilateral trade agreement; boost international trade. Although, general trend of policies
target to more opened for trade. Nations exercise more temporary barriers such as
Antidumping (AD) or technology barriers to bring up domestic producers in short-term.
Table 1.1. Merchandise exports by selected economy (USA, Canada, Mexico, Brazil,
Argentina, China, Japan, India, Australia and New Zealand, South Africa, Germany, United
Kingdom, France, Italia) in billion USD
1948 1953 1963 1973 1983 1993 2003 2011
58.5 83.82 156.77 578.79 1837.563 3675.596 7376.506 17816.37
62.25 85.06 163.6 593.71 1881.53 3785.863 7694.738 15076.52
11. 2
Source: author collected from WTO report
Antidumping duties (AD) were not common in 1960s. According to (Schott, 1994),
there are 10 cases per year in average. However, this number increases rapidly in 1970s and
1980s since countries prefer AD than tariff. As AD rules of GATT/WTO is more flexible to
interpret than other tariff rising(Blonigen & Prusa, 2001). It is recorded over 1600s AD
petitions in 1980s (Finger & Artis, 1993).ADs used by members of WTO has promoted
triply between beginning of 1980s and end of 1990s (Prusa, 2005).Moreover, since the world
crisis happened in 2008, it causes the developed countries have trend to use AD as protection
to domestic producers (Kee, Neagu, & Nicita, 2010). There are several motivations of AD.
Firstly, it is unambiguous GATTWTO rules to eliminate tariff or at least reduce them.
Besides that, number of countries joins bilateral trade agreements (BTA) or multi-lateral
trade agreements have been augmenting significantly in recent decades. Those agreements
have constrains which limit bring up tariffs. Also, those lead to an increase of import and
then raise tensions of domestic suppliers. Secondly, there is lack of solutions to protect
instead of AD. In addition, GATT/WTO or preferential trade agreements conditions to raise
AD are flexible and easy to interpret (Hansen & Prusa, 1995).
There are many studies focus on impact of Antidumping on target countries site.
(Prusa, 1994) find that the AD will push pressure on foreign firm to increase their prices in
the first stage of process of petition’s tax. (Cuyvers & Dumont, 2005) proves Asian export
goods to EU are significant lower in both quantity and value after petition files. In addition,
74% of EC petition investigations lead to either tax rising or price undertaking in period
1981-2001. In addition, Antidumping is an outstanding case to study microeconomics issues
and concepts (Blonigen & Prusa, 2001) such as: signaling, moral hazard, adverse selection,
pricing theory, optimal tariff theory and practice, political economy of rent-seeking,
comparative advantages. AD discriminates “named” and “non-named” countries in “named”
products. Thus, it might reduce comparative advantages of “named” firms while increase
advantages of non-AD firms. Also, firms will adjust their price policy to adapt with tax
rising. In addition, it is evident AD has effects on well-fare surplus. When government
12. 3
believes applying AD could benefit to producers, economists argued it lower consumer
surplus as well. For example, “non-AD” firms have ability to sell more even quality is lower
than “AD” products. . That is, government must have optimal tax for AD to keep balance
between the two groups. Furthermore, effect of AD could be seen even as phase of
announcement an investigation since it is such a “signaling” for exporter and importer to
adjust their behaviors. For those reasons, there is a huge number of empirical researches refer
to this. For instance, (Brambilla, Porto, & Tarozzi, 2012) find the spillover effects of United
States duties on catfish on Vietnamese household income. (Moore & Zanardi, 2009) argued
that the applying of AD might lead to the less liberalize of trade.
This paper answers the question how do enterprises in developing countries response
to AD from developed countries? Case of European Union (EU) duty on Vietnam footwear
is studied in this paper as core evidence of this question. Vietnam reformed their economy
since 1986. From this point, trade between Vietnam and world soar rapidly (Table 1.2).
However, this nation is target of many AD cases on its key export products. Until 2011,
Vietnam has suffered over 40 Antidumping investigations with one third has tax imposing.
For example, US rises AD on catfish in 2002, shrimp in 2003; According to Vietnam
General Statistics Office (GSO) EU imposes tax on bicycles in 2004. EU is one of main
partners of Vietnam besides US, China and Asia. As mentioned in table 1.3, export of VN to
EU increases extremely from 1995 to 2004. Two Vietnam main products are Textile and
footwear. In 7/2005 EU announces the initiation of antidumping duty on China and Vietnam
footwear with outer soles and uppers of rubber or of plastics, those products have code 6403
in (CN8) (553/2006). Tax rate imposes from 4.2% in April 2006 and reaches to 16.8% at
September same year. For this reason, the export of footwear to EU has significantly
reduced. This research focuses on the adjustment of firm’s behaviors to reduce the negative
impact of the tax rising.
Table 1.2. Vietnam Merchandise Trade in percent over GDP
1986 1988 1991 1995 2000 2003 2007 2012
13. 4
11.18% 14.92% 46.03% 65.61% 96.63% 114.80% 156.65% 161.20%
Source: author collected from World Bank Data Indicators
Table 1.3. Vietnam export to EU in million USD
1995 1998 2001 2004 2006 2007 2010 2011
664,2 2079,0 3002,9 4968,4 7094,0 9096,4 11385,5 16541,3
Source: author collected from Vietnam General Statistics Office
The Vietnamese footwear is the typical case to study the adjustment of firms in
developing countries under anti duties. Firstly, EU accounts for 65% of total footwear export
of Vietnam. Besides that, Vietnam footwear is one of the main industry sectors of Vietnam.
It is the significant sector contributing to Vietnam export, create jobs, etc. As given by (P.
Krugman et al., 1995), quantifying effects of protectionism such as tariff or AD is usually
hard since it has issues to interpret ex-post data. However, this is ideal case since the
samples of firm-level data is collected by GSO in 2003, 2004, and 2006, 2007. It is the
period of before and after investigation period and tax imposition for both “control” and
“treatment” group. In addition to firm-level data, we also have sufficient products level data
at 8-digit CN codes and 10 digit HTS codes level from Eurostat and USITC, respectively.
On those given, it would be concluded that unique and ideal opportunity to identify the
firm’s adjustments under antidumping case.
1.2Research objectives:
Explore how the Vietnam footwear industry and Vietnam footwear firms response to
antidumping duty from EU.
1.3 Research questions:
1. How much does EU AD alleviate to export value, quantity and price of Vietnam
footwear industry?
2. How much does EU AD reduce revenue of Vietnam footwear firms?
14. 5
3. How much does AD effect on the firm’s input decision: firm’s size and labor payroll?
4. How protectionist measure in EU can adversely affect another economy (US)?
1.4 Research methodology, data and scope
Double differences (DD) method is applied to estimate effect of AD on Vietnam
footwear. DD is frequently used for evaluate impact of a policy or program. It compares
“control” and “treatment” group before and after intervention of policy. It has advantages in
eliminating time-invariant. We have some adjustments in adding firm characteristics to deal
with potential sources of selection biases. Also, we chose control group of footwear as light
manufacture industries such as: textiles, papers and wood, etc. Those help to satisfy parallel
assumption of DD approach. Vietnam Enterprise Surveys are used as data for this research.
This dataset is collected by Vietnam General Statistics Office (GSO) and its sub-institutions
in provinces. In addition to firm-level data, we also employ products level data at 8-digit CN
codes and 10 digit HTS codes level from Eurostat and USITC. Since investigation of AD
begin in 2005 and tax is rising in 2006, we use panel data of ex-ante and ex-post period as
detail discuss in Chapter 3.
1.5 Thesis structure
This paper is organized as following. At first, chapter I provides introduction to of this
paper. It offers objective and research questions of research. Also, it demonstrates
importance of this research. Chapter II summarizes researches including: theory and
empirical background. Following is chapter III, which gives overview of EU AD rising on
Vietnam footwear, and illustrates summarize of data. Chapter IV demonstrates research
methodology results while chapter V gives a brief summary of this paper.
15. 6
Chapter 2: Literature Review
This chapter will survey literature on trade protection and its effects, especially
antidumping. There are three main parts. The first part reviews theoretical background. The
second section provides summary of previous empirical researches. The last part of chapter
describes a construction of conceptual framework for this study.
2.1 Theoretical Review
Free trade is good as a whole; however, at the same time there are always winners and
losers. Thus, some countries have been applying policies to protect their industries or gain
their targets. The targets might be not only economic goals but also political goals. We
summarize most important trade policies that have been adopted in recent decades. They are,
for instance, import tariffs, export subsidies, dumping. In addition, there is a very crucial
policy in context of world trade organization that helps to secure local producers in short
time, it is antidumping duty.
2.1.1 Market analysis in context of Trade in a single industry
This paper bases on the theory of partial equilibrium (Feenstra, 2003; P. R. Krugman &
Obstfeld, 2008). Let’s assume there are only two markets, Home and Foreign. It is supposing
both markets have producers and consumers for a single product A. In addition, prices of A
are quoted by Home currency. Also, it is assumed that price in Home country, denoted by P,
is higher than price in Foreign, P*. Hence, It leads to Home import product A from Foreign.
To have transparent view, we use supply and demand curve as figure 1.
Figure 1a demonstrates demand and supply curve of Domestic market. Figure 1b
shows Home import demand curve MD which is derived from figure 1a. In particularly,
Home import demand is measured by Home demand subject to Home supply. At price P0,
demand is D0 and domestic supply is S0. Hence, there is a quantity demand for import good,
D0 – S0. When price increase from P0 to P1 , Home demand falls to D1 while Home supply
increase to S1. It causes Home import demand declines to D1 - S1. In general, import
demand curve has negative slope since the quantity demand decrease when price goes up.
16. 7
Import demand is equal to zero at the equilibrium price of Domestic supply and demand, PE,
At this price, Home country does not need to import goods.
Figure 2.1. Home Import Demand
Foreign export supply curve is describes in figure 2. Figure 2b is derived from figure
2a. At P0 Foreign suppliers produces S0 while Foreign demand is D0. There is a need to
export D0f – S0f. When the price surge to p1, Foreign consumes lower at D1 while the supply
produce more at S1. Abundant product for export is D1f – S1f. On those given, it might
conclude export supply curve XS has positive slope, since the price increase Foreign
producers have trend to export more. At price PE, they do not have motivation for export and
all goods are consumed by Foreign consumers. Quantity of product for export is equal to
zero.
PE
P1
P0
S0 S1 D0 D1 Quantity, Q
Price,P
D
S
MD
Quantity, Q
Price,P
D1 - S1
E
a b
D0 - S0
17. 8
Figure 2.2. Foreign Export Supply Curve
2.1.2 Effect of a tariff
2.1.2.1 Effects of tariff on Volume and Price
Given assumption Home government imposes a specific tax (t) per unit import of
product A. Without tariff, price of product A in Domestic country is equal to world price PE
as illustration in middle of figure 2.3. Within the participation of tariff t, Mediators will not
have incentive to move products from Foreign to Home unless the gap between the two
prices is greater than or at least equal to t. Consequently, there is an excess supply in Foreign
and shortest supply in Home. This phenomenon makes an adjustment in Home and Foreign
prices. There is an increase in Home price as well as a decrease in Foreign price until the
difference between the two is t.
P1f
D0f
D1f Quantity, Q
Price,P
XS
Quantity, Q
Price,P
E
a b
Df
Sf
S0f - D0f S1f - D1f
S0f S1f
P0f
PEf
18. 9
Figure 2.3. Impact of tariff on import price and volume
Looking at figure 2.3, a tariff t makes price in Home increase to Pt that is greater than
original price P. at Price Pt, Home producers incline to produce more. Besides that, there is
less demand on import; in middle panel of figure 2.3, import move from point E to point A
after introducing tariff. In Foreign, price is lower from P to Pf = Pt – t. As a result, Foreign
supplier alleviate export from point E to point B on XS curve. In addition, there is more
demand in Foreign since price is lower. In short, traded quantity is reduced from Qe to Qt.
The new equilibrium point of Home import demand and Foreign export supplied is
established at Qt. At this point, Home price is higher than Foreign t. It is noticed that Pt – Pf
= t≥Pt – P > 0. Hence, there are two cases: 1) Home country is small country, 2) It is large
country. The standard to classify a country is large or small is quite abstract. That is, one
country is small for product A if its demand does not impact on the world price. On the
contrary, if its demand has impact on world price it will be seen as large country. Next
section will brief influence of a tariff on social welfare.
2.1.2.2 Consumer surplus and producer surplus
As mentioned in section 2.1.2.1, a tariff would make change of price in both
Domestics and Foreign. In particularly, the price in Domestic will be raised after tariff while
there is a decrease of price of Foreign. Thus, Home consumers will take loss while Home
S
D
XS
MD
Sf
Df
Home Market World Market Foreign Market
Price, P Price, P Price, P
Quantity, Q Quantity, Q Quantity, Q
Pt
P
E
A
B
Qt Qe
t
Pf
19. 10
producers will be benefitted by tariff. From view of Foreign, consumers will have benefit
while producers take loss since Foreign price might be lower. To compare cost and benefit of
tariff on separate groups, there is a demand to quantify them. Consequently, we might need
to use terms consumer and producer surplus that is well-known in micro-economics.
First of all, we define consumer and producer surplus. Consumer surplus is the
amount that consumer gains since they purchase product less than price they are willing to
pay. For instance, client would have been willing to spend 100$ for a couple of shoes, but the
price at shopping is 80$. Then 20$ is counted for consumer surplus. Producer surplus is the
gap that producer gain when they sell product higher than price that they are willing to sell.
A product might be sold with 15$ while manufacturer is willing to sell with 12$, then 3$ is
producer surplus. Total consumer surplus and producer surplus is called as social welfare.
2.1.2.3 Effects of tariff on Social welfare
Let’s start to review impact of tariff on social welfare of importing country in case of
it is big market. The tariff will promote price in Home from P to Pt. Besides that, price of
Foreign will be reduced to Pf. Consequently, Home suppliers increase their volume from S1
to S2, as described in figure 2.4. In addition, Home demand declines from D1 to D2. As we
can see, producer surplus is area that above supply curve and below price curve. Hence,
when price boost from P to Pt, Producers gain area a. on the stark contrary, price enhance
makes loss for consumers. Consumer surplus is defined as the area above the price and
below demand cure. Thus, there is (a + b + c + d) decrease of consumer surplus.
Government has benefit because of collecting tariff. The amount of government’s revenue is
(D2-S2)*t = c + e. Let’s assume that government will use tax revenue to finance public
services. The net social welfare is : producer benefit + government tariff revenue – consumer
loss = a + (c + e) – (a + b + c + d) = e – (b + d). The rectangle e reflects the term of trade
gains that appear since Home is big market and has market power. The two triangles b, d
stands for efficiency loss since market is distorted by tariff.
20. 11
Figure 2.4. Effect of tariff on social welfare in case of large country
Figure 2.5 describes the case import country is small country. Then, its tariff can’t affect
world price. Consequently, Home price is P0 + t. with P0 is original price before tax. Term of
trade gains is equal to zero and there is only efficiency loss (b + d). Consequently, net
welfare of small importing country is equal to - (b + d).
Figure 2.5. Effect of tariff on Home demand in case of small country
Home S
Home D
Price, P
Quantity, Q
Pt
P
Pf
S1 S2 D2 D1
c
b
a d
e
t
Pt
P0
Quantity, Q
Price,P
D
S
MD
Quantity, Q
Price,P
Dt D0
a b
Home Market World Market
b d
a c
21. 12
In addition to theory of trade, (J Brander & Spencer, 1992; J. A. Brander & Spencer,
1984; Dixit, 1984) argues Home price will be higher after government imposes tariff in any
of specific or ad valorem. Also, they prove that if the Home country is large enough, tax
might pass-through a part to Home customers and the rest for Foreign producers. Besides
that, (P. R. Krugman, 1979) gives evidence for the case of monopolistic. Those researches
bolster for theoretical background of this paper.
2.1.3 Export subsidies
Export subsidy is amount that governments give to enterprises or organizations to
encourage export. A subsidy might be in form of specific or ad valorem. Figure 2.6
demonstrates effect of export subsidy on exporting country. Export subsidy can be seen as
the inverse of tariff. Thus, it raises price in exporting country from P to Ps while lower price
in importing country from P to Psf. The gap between Ps and Psf is exactly equal to amount of
subsidy. We can see consumers lose (a + b). Producer gain is (a + b + c). Government spends
(b + c + d + e + f + g) for subsidy. In short, net welfare is – ( b + d + e+ f + g). In which, (b
+d) is efficiency loss since the export subsidy distort producers and consumers behaviors.
Besides that, if exporting country can affect world price, the export subsidy might lead to fall
of world price. Then, term of trade loss is ( e + f + g). In case of small countries, this is equal
to zero.
22. 13
Figure 2.6. Effect of export subsidy on export country
2.1.4 Dumping
2.1.4.1 Infant industry protection
We consider labor Ricardian model which focuses on labor productivity and
comparative advantages (Akerlof & Yellen, 1986; Feenstra, 2003). Firstly, we denote aias
labor productivity in industry i of Home country while ai* is as same as ai but in Foreign
countries. We use w and w* to indicate wage in Home country and Foreign respectively. As
such, w/ai is unit labor cost of industry i in Domestic. Thus, Home has comparative
advantages in industry i if and only if w/ai< w*/ai*.
S
D
Price, P
Quantity, Q
Ps
P
Psf
c
b
a d
subsidy
e f g
export
23. 14
Figure 2.7. Infant Industry Protection
Figure 2.7 provides an illustration of infant industry protection. People believe in infant
industry protection since they believe in learning by doing concept. That is, Firms can get
more efficient with experience. Consequently, it is said that a short-term tariff might help
firms get more experience and can increase efficiency. As a result, Home comparative
advantages will be increased. A more detail of infant industry protection theoretical model is
described in work of (Dale, 1980) and recently (Feenstra, 2003). Besides that, (P. Krugman,
1984) proves that import protection can be seen as export promotion by using model of
reducing marginal cost, an generalization of infant industry protection. However, there is a
very worth empirical is given by (Krueger & Tuncer, 1982). They used two samples: (1) set
of 92 firms and (2) two-digit industry level data. Both come from Turkey. They found that
there is no systematic evidence of high-protection get high growth rate than less-protection
firms.
1/a*
i
0i
1/a
1/a
1i
Q
0
Q
Unit Cost
1 Quantity, Q
24. 15
2.1.4.2 Dumping
According to summary of (Feenstra, 2003), there are three main types of dumping: (1)
predatory dumping, (2) continuous dumping, (3) reciprocal dumping. (Hartigan, 1996)
developed a theoretical model of predatory dumping. Firstly, predatory dumping could be
defined as phenomenon of Foreign firms lower their price in a period to push Domestic firms
out of market. This model assumes that capital market is imperfect that might opposes
Domestics firms issue debts to survive in duration of negative profit. In addition to predatory
dumping, long-run dumping is notified by (Viner, 1966) as cited by (Feenstra, 2003). This
dumping might exist with oligopolistic competition and excess capacity. Its purpose is to
preserve the production without cutting price in Foreign of Foreign monopolist. He observed
German companies agonized US antidumping law in section 800-801 of Revenue Act of
1916 and found that most of them are cartels and in highly preserved industries of Germany.
In 1983, Brander and Krugman(James Brander & Krugman, 1983) developed a
framework of reciprocal dumping case. Their work is an generalization of (J. A. Brander,
1981). They model reciprocal dumping with a typical example of Cournot duopoly. Let’s
assume that both Home and Foreign are producing product z. There is transportation cost
between the two. Firstly, let’s assume that Home cost is c while cost of 1 unit export is cT. T
is greater than 1 since there is transportation cost. The crucial concept is that (1) market is
segmentation; (2) firms behave as Cournot. That is, firms can choose quantity to maximize
their profits in each market separately. And, their competitions will keep constant output.
Let’s define price of Foreign firm in Foreign market is Pf. The dumping in Domestic appears
if p/T < pf. It is supposed that both markets have constant marginal cost of producing, c.
However, since there is transportation cost, the marginal cost of an exporting product from
Foreign to Home is c*T. Domestic firm exports xf to Foreign and produces x for Home
market. Correspondingly, Foreign firm produce yf for Foreign and y for export. Let’s denote
foreign country by small f. The profit function of Home and Foreign firm can be described as
2.1 and 2.2 respectively. ∝ is fixed cost.
𝜋 =xP(z) + xfPf(zf) – c( x + xfT) - ∝ (2.1)
25. 16
𝜋f =yP(z) + yfPf(zf) – c( yf + yT) - ∝f (2.2)
We only need to solve the case of Home market since Foreign and Home are symmetric. The
necessary condition to maximize profit is first-order should be equal to zero.
𝜋′x = xp’ + p – c = 0 (2.3)
𝜋′yf =yp’ + p – cT = 0 (2.4)
The contingent of Foreign enterprise in Domestic y/z is denoted by 𝜔 while –p/zp’ , the
elasticity of Home market, is called as 𝛽. Solving equations 2.3 and 2.4 we have
P = c𝛽/( 𝛽 + 𝜔 − 1)(2.5)
P = c𝛽𝑇/(𝛽 − 𝜔 ) (2.6)
Or
P = c𝛽(𝑇 + 1)/(2 𝛽 − 1) (2.7)
𝜔 = [𝛽(1 − 𝑇) + 𝑇]/(𝑇 + 1) (2.8)
The sufficient condition is
𝜋′′xx = xp’’ + 2p’ < 0 (2.9)
𝜋′′yy(f) = yp’’ + 2p’ < 0 (2.10)
In addition, we suppose that firm’s marginal revenue will diminish if other enterprises raise
output. In other words, the reaction function has downward sloping.
𝜋′′xy= xp’’ + p < 0 and 𝜋′′yx (f) = yp’’ + p’ < 0 (2.11)
The condition of two-way trading is positive value of p and 𝜔. It implies that <
𝑇
𝑇−1
. Besides
that, the condition of having root for system equation 2.3 and 2.4 is 𝛽 > (1 − 𝜔)and > 𝜔 .
26. 17
From (2.7), condition p > 0 leads to 𝛽 > 1/2 and from 2.8 we have <
1
2
. It could be inferred
that, at equilibrium, firms has smaller fraction of its domestic market is higher than export
market. With the constant demand and firms sell in both markets, it is derived from (2.3)
and (2.4) that p = c/(1+ 𝛽) and pf = cT/(1+ 𝛽). That means the marginal revenue in export
market is expected to higher than in Domestic and that higher is consistent with the cost.
Reciprocal dumping occurs if and only if p/T < pf and pf/T < p.
2.1.4.3 Impact of reciprocal dumping on Welfare
The effect of reciprocal dumping on global welfare is noticed in figure 2.8. Zo is
output before trade of monopolized product. Po is price before trade, c is marginal cost. After
two-way trading, consumers buy more to Z1 since price falls down to p1. Thus, dumping
generate Z1 – Z0 of consumption. However, Domestic producers lose Z0 – x for imported
product. Let’s assume the utility function is U = U(z) + Ck. Where, Ck is consumption of
numerate goods. Firstly, starting with an extreme transportation cost which prohibit totally
trade. Global welfare might be demonstrated as.
W = 2( U(z) – cZ - 𝜑𝑦) - ∝f - ∝ (2.12)
𝜑 represents for cost of transportation per unit. That means 𝜑 = c*(T-1). Taking first-order
of 2.12, we have:
dW/d𝜑 = 2[(p - c) dZ/d𝜑 - 𝜑dy/d𝜑 - y (2.13).
Without trade, p = c+ 𝜑 and y = 0; thus, dZ/d𝜑 = dx/d𝜑 + dy/d𝜑. When 𝜑 reduces a little,
leading to trade appearance.
dW/d𝜑 = 2(p- c) dx/d 𝜑 = 2𝜑dx/d𝜑> 0 (2.14).
27. 18
Figure 2.8. Impact of reciprocal dumping on welfare
As given in figure 2.8, the reduction of transportation cost might lead to shrinkage of x; thus,
making dW/d𝜑> 0. As a result, welfare will decline with decrease of transportation cost.
There are three possible influence of decline of transportation cost. First, cost of importation
decrease, that is benefit. Second, consumption enhances; it is a gain. Thirdly, the import
goods have higher cost than domestic goods, thus, the replacement cause a loss. When 𝜑
reduces very small, the first two effects are relatively small to the last. Thus, we see the loss.
However, (James Brander & Krugman, 1983) also argue that the free trade will lead to
welfare gain in overall.
2.1.5 Antidumping Duties
The imposition of antidumping duty (AD) was first agreed in 1947 by General
Agreement on Tariffs and Trade (GATT). GATT is precursor of WTO. Dumping is defined
as (1) product is sold less than fair value and (2) it causes a material injury to Home
0
P
Z
0
z
D
1
Quantity, Q
P1
cT
c
x
y
Loss
Gain
a
b
28. 19
producers. In 1979, first condition was broadened in Tokyo Round. The term “less than fair
value” was not only price discrimination, but also below cost of production. Although, there
are many antidumping duties were imposed by many countries, most of them relied on
guidelines of WTO. In general, antidumping is imposing a high tariff in short term to protect
domestic producers. Thus, effect of antidumping is identical with effect of tariff in section
2.1.2. This section provides special characteristics of antidumping duties in addition to
section 2.1.2. According to (Feenstra, 2003; Staiger & Wolak, 1994), Antidumping could be
dived by several phases. We will scrutinize in two of them (1) the period of launching
investigation (2) the period of continuing investigation.
2.1.5.1 Initial investigation
This period is first stage, we call period 1, of antidumping; trade committee of Home
countries relies on claimers to announce an investigation on import. The f.o.b (free on board)
price of Foreigners, p/T will be compared to Foreign price, pf. Then, if p/T < pf, we might
conclude that there is “less than fair value” in price. In addition to compare price, method of
compare cost with an indicated country that is familiar with target country is also common.
As discussed by (Feenstra, 2003), 95% of the cases give conclusion that 1 + 𝛾2=
𝑝𝑓
(
𝑝
𝑇
)
> 1. It is
noticed that value of 𝛾2 in period 1 will be used to calculate tax of period 2. Thus, pricing
behaviors of Foreign should be seen as endogenous in this period. In particularly, exporters
will promote their price to lower duty they might be charged in period 2. This increase
causes Home consumers welfare loss. (Staiger & Wolak, 1992) proved that period 1 cause
one half of as much reduction as appeared in period 2. This result also implies that import
price increase. It is reminded that there are two requirements of impose tax after period 1,
that is (1) less than fair value (2) material injury. As discussed by (Prusa, 1992), there is 150
cases, about one half of cases, are rejected in US in 1980-198 and 150 cases are accepted to
levy duty.
29. 20
2.1.5.2 Continuing Investigation
Let’s assume that antidumping duty was imposed and Foreign price now is pt. This price
included tariff. It is presumed that committee reassess price to see whether there is a
dumping in this period or not. Then, they drop out transportation cost and tariff. In other
word, the f.o.b price of foreigner now is considered as pt/[T(1+ 𝛾)]. It satisfies condition of
less than fair value if pt/[T(1+ 𝛾2)] < pf . We have 1 + 𝛾3 =
𝑝𝑓
𝑝𝑡/[T(1+ 𝛾2)]
> 1 (2.15) , then duty
𝛾3 would be imposed. (2.15) is equivalent to 1 + 𝛾3 = (1+ 𝛾2)
𝑝𝑓
𝑝𝑡/T
. If firm chosen pt in period
2 at pt = pfT, it is still said that have pricing behavior less than fair value and continue to be
imposed tariff 𝛾3 = 𝛾2 . To escape tariff, firm must rise its price up to pt/[T(1+ 𝛾2)] ≥ pf
.Since dumping is raised if p/T < pf ; Thus, pt≥ pf[T(1+ 𝛾2)] > p(1+ 𝛾2). In combination with
section 2.1.2, we can see that two periods of antidumping cause a loss of customer welfare in
import country. Also, antidumping cause an substantial declines of quantity and revenue of
export country’s industry.
2.1.5.3 Effect of antidumping duties on firm’s input of production
The collapse of export quantity and revenue of Foreign industry might cause a decline
of Foreign input factors to industry which is faced tariff. There are two scenarios after Home
levy a tariff on Foreign. First, Foreign companies might have strategy to restrict negative
effects of tariff. It is reasonable to believe that firms might diversify markets or change their
products to avoid tariff. Second, Firm’s revenue and output are significant impacted since
they cannot adapt with tax. This section discusses effect of antidumping duties on firm size
and labor payroll in second scenario. It is assumed that firm will suffer and extreme collapse
in quantity because of tariff. Starting with Cobb-Douglas production function (Mankiw,
2012).
Y = A.Kα
Lβ
(2.16)
Y is output that firm yields in one year. K is capital input which is defined as real value of all
equiments, buildings, etc. L is total worked hours in one year. 𝛼 and 𝛽 are output elasticities
30. 21
of capital and labor, correspondingly. Thus, Y declines causes declines in labor input. That
is, firms will fire their employees since they have abundant labor forces. We will review
effect of antidumping duties on labor payroll by look at profit function.
𝜋 =xP*(x) + yP(y) – C(x+y) (2.17)
Where x and p*(x) are the volume and price that Foreign export to Home, respectively.
Similarly, y and p(y) are the volume and price Foreign sells to its own Domestic market .
C(x, y) is the cost function. As a tariff, antidumping will cause a lower price of Foreign if
importers have market power or at least price is unchanged in case of small market. Thus,
revene will be alleviated. Consequently, Firms adjust cost to keep its profit. Looking at cost
function, we can assume that
C(x+y) = rK + wL (2.18)
In which, r indicates renting fees of captial while w indicates labor payroll. Hence, when
firms adjust their cost, they might reduces compensation of employees and also number of
workers. As such, we have proved that if there is a significant decline in firm output might
caused by tariff, it could be believed that labor payroll and firm size are reduce.
2.2 Empirical Review
There are many previous empirical studies on topic antidumping. It is even have a
summary of previous empirical work written by (Blonigen & Prusa, 2001). (Pierce, 2011)
shows that antidumping will lower the physical productive in host country. It helps to extend
the lifetime of low-productivity firms. Consequently, the efficiency of using resources will
be decreased.(Egger & Nelson, 2011) applies panel data from 1948 to 2001 to evaluate the
impact of Antidumping on volume of trade and welfare in the context of GATT/WTO. Their
results demonstrate that even though the effect is negative, it is quite modest. It is also the
evident that number of antidumping duties levied on East Asia region is higher than all other
regions (Prusa, 2006).(Anderson, Schmitt, & Thisse, 1995) bases on Bertrand-Cournot
model to give evidences that antidumping reduce consumer surplus and increase domestic
31. 22
producer surplus. Hence, consumers have trend to lobby against antidumping law while
producers lobby to raise the duty. Additionally, the government aim to maximize total
domestic surplus and world surplus might be increased with antidumping laws.
Searching determinants of AD is also one of interesting topics. There are several
researches examine motivations of AD. Firstly, it is unambiguous GATTWTO rules to
eliminate tariff or at least reduce them. This leads to an increase of import and then raises
tensions of domestic suppliers. Secondly, there is lack of solutions to protect instead of AD.
In addition, GATT/WTO conditions to raise AD are flexible and easy to interpret (Hansen &
Prusa, 1995), As discussed by (Blonigen & Prusa, 2001; Herander & Schwartz, 1984; Sabry,
2000), there are three main factors determine AD filing: injured sector employment, capital
intensive of this sector and invasion of Foreign product. Paper of (Blonigen & Prusa, 2001)
is a reviewed paper that summaized previous studies; and the rest two apply industry level
data and single equation to to get their findings.
Other studies focused by the economist are impact of Antidumping on foreign site.
(Prusa, 1994) find that the AD will push pressure on foreign firm to increase their prices in
the first stage of process of petition’s tax. (Cuyvers & Dumont, 2005) proves Asian export
goods to EU are significant lower in both quantity and value after petition files. In addition,
74% of EC petition investigations lead to either tax rising or price undertaking in period
1981-2001. (Brambilla et al., 2012) study AD of USA imposes on Vietnam catfish. They use
panel household level data with Double Differences methodology. Two years after tax,
import catfish from Vietnam was reduced 85%. Consequently, income of catfish households
reduces from 36.7% to 74% depends on ratio of catfish in ex-ante income. Consistently,
farm’s investment on catfish falls -28.3% to -61.9%. Besides that, (Prusa, 2003) proved that
AD causes a 30-50% declines of import. In general, previous studies are quite consistent in
belief that AD might harm import.
Since AD is discrimination between named and non-named countries. It is argued that
petition usually accompany with trade diversion. For instance, in the case of EU, the
32. 23
diversion is mostly to non-EU firms (Brenton, 2001). In addition, (Ganguli, 2008) examine a
considerable fall of import to India of named countries while there are increase of import
value from non-named countries. Consistently, (Park, 2009) studies case of China and gives
a strong evidence of trade depress and trade diversion. Those researches indicate reason for
this phenomenon is increase price of “dumped” products. For USA, researches of (Krupp &
Pollard, 1996; Prusa, 1996) find strong evidences of trade diversion. On the contrary,
(Konings, Vandenbussche, & Springael, 2001) illustrate a limitation of trade diversion
caused by EU with data in period of 1985-1990. However, this result seems not strong when
(Konings & Vandenbussche, 2005) use panel data from four thousands producers in EU
before and after filing duty. Then, if the trade diversion is small, AD will have significant
positive impact on domestic firm markup. Although, there are vast of studies on import
diversion; there are few researches on export diversification of “named” countries. It is
logical to think about this phenomenon since AD is discrimination based on products and
market, Home country. Thus, Foreign country can either diversify its product to bypass those
products code under tax or vary its markets to escape Home country.
On those bases, economists agree the negative impact of AD on foreign countries and
in most cases they are developing countries. It is common that AD will cause higher price of
Foreign named products, even in investigation period. Thus, leads to lower demand on those
products. Besides that, benefit of AD for Home firms are not obvious. They vary depends on
diversion of trade. However, those previous studies mostly use aggregate data or data at
industry-level. There is a lack of studies on impact of AD on Foreign country enterprises at
firm-level data. This paper uses a unique of ex-ante and ex-post Enterprise Survey from
Vietnam to verify impact of AD from EC on Vietnam footwear industry, thus, fits well this
gap. Besides that, there is very few researches mention the market diversion effect of AD.
Our analysis also estimates how protectionist measure in one economy (EU) can adversely
affect another economy (US).
2.3 Conceptual Framework
Given theories and empirical studies indicate a conceptual framework, which is
demonstrated in figure 1.9, for this study.
33. 24
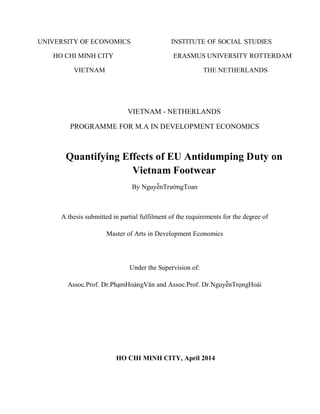
Figure 2.9. Conceptual framework
Antidumping duties cause a decline of export of Foreign in targeted industries. There
are evidences in both theory and practical for this argument. From theory views, As
mentioned in section II.1.2, (Akerlof & Yellen, 1986; Feenstra, 2003) gave excellent
explanations for questions how do antidumping duties effect on “named” industries export.
In addition to volume, economists also agree with impact of AD on import price. (Akerlof &
Yellen, 1986; J Brander & Spencer, 1992; J. A. Brander, 1981; J. A. Brander & Spencer,
1984; Dixit, 1988; Feenstra, 2003) consistently divided two cases: (1) import countries are
Antidumping
Duties
Direct Effects
Quantity Export to
Market 1 declines
Price Export to
Market 1 increases
Value Export to
Market 1 decreases
Indirect Effects
Quantity Export to
Market 2 increases
Price Export to
Market 2 declines
Value Export to
Market 2 increases
Total export to
market 1 and market
2 might decline
Effect on Vietnamese
Footwear Firms
Firm revenue declines
Employment and
payroll decrease
34. 25
small countries (2) import countries are large countries. AD might have no effect on Foreign
price in first case. However, if import countries are large countries, it might cause a tumble
of import price. Those argument are supported by many empirical studies, for instance
(Brambilla et al., 2012; Cuyvers & Dumont, 2005; Prusa, 1994, 1996, 2003).
The collapse of import quantity might lead to some actions of Foreign firms. Firstly,
firms might diversify their markets or products to avoid tariff. There is not many studies on
this phenomenon. But, there are an enormous number of studies relates to trade diversion
toward non targeted countries (Brenton, 2001; Ganguli, 2008; Park, 2009). AD causes an
increase market share of non-named countries in Home country. Then, we can believe that
AD might cause a diversion of targeted firms toward new markets or new products that are
similar but not suffer to tariff to avoid AD. Besides that, if firm cannot find new markets for
their products, they must suffer declines in output and revenue. (Mankiw, 2012)
demonstrated that output are significant highly correlates with input. Thus, when output
decreases, firm might cut their input of production such as: firm size and labor wages to
maximize their profit.
35. 26
Chapter 3: An overview of Vietnamese Footwear Industry
3.1 EU tax rising on Vietnamese footwear
Footwear is one of largest contributors to export of Vietnam. As given data by
Vietnam general statistics office, footwear export value is two thousands and a half of
million US Dollars in 2004. That is the third after Textile and Rice (Figure 3.1).According to
Vietnam Ministry of Industry and Trade, there are approximately a half of million labors
working directly in footwear industry. Those labors majorly come from Agriculture sectors.
They mostly do not have college degree and receives low salary. Footwear Enterprises
crowds in three cities: Ha Noi, Ho Chi Minh, Da nang and areas around them (source
Vietnam Ministry of Industry and Trade). Vietnam can produce variety of footwear products
includes leather shoes, sport shoes, etc. In general, they have good quality as well as low
price since labor cost is cheap. Thus, this product is largely accepted in EU, US, and Japan.
Figure 3.1. Top five Vietnamese export goods exclude oil in 2004
Source: author collected data from Vietnam General Statistics Office
0
500
1000
1500
2000
2500
3000
3500
4000
4500
5000
Textile, sewing
products
Rice Footwear Fishery
products
Wood and
wooden
products
36. 27
Figure 3.2.Top five footwear exporters to EU
Source: author collected data from EU Trade market access database
EU is the largest importer of Vietnam footwear with 2198294 thousands of Euros in
2004(source http://madb.europa.eu/madb/statistical_form.htm#.). Referring to US/EUR
exchange rate 1US$/ 1.243 EUR(source European Central Bank), the number is nearly 1.77
million US$. That is 68% of all footwear export value. EU commission Trade data shows
Vietnam is the second exporter after China. However, Vietnam faces with strong competition
from China, India, Indonesia, and Tunisia (Figure 3.2). In addition, mostly material and
machines serves for this industry are imported. One of Vietnam major product footwear is
footwear with outer soles of leather or upper leather which have code 6403 in 8-digit
Combined Nomenclature (CN8).
On July 7, 2005, EC announces the notice of launching of anti-dumping inspect on
Vietnam and China leather shoes based on claim of European Confederation of the footwear
industry (“CEC”) (C166/14/2006).At that time, CEC represents for 40% of EU suppliers. Its
claim bases on Article 5 of European Regulation 384/96 (384/96) last amended in EC No
384/96(461/2004). As such, footwear contains leather declared by CN8 codes 64032000,
64033000, 64035111, 64035115, 64035119, 64035191, 64035195, 64035199, 64035911,
0
500000
1000000
1500000
2000000
2500000
3000000
3500000
China ,People's
Republic of
Vietnam India Indonesia Tunisia
2002
2003
2004
37. 28
64035931, 64035935, 64035939, 64035991, 64035995, 64035999, 64039111, 64039113,
64039116, 64039118, 64039191, 64039193, 64039196, 64039198, 64039911, 64039931,
64039933,64039936, 64039938, 64039991, 64039993, 64039996, 64039998 and 64051000
are scrutinized. The investigation period is from 01 April 2004 to 31 March 2005. There are
eight Vietnam firms and twelve China firms are chosen as sample of 163 and 86 respondents
of the two respectively. Results were publicized in (EC) No 553/2006 (553/2006). In overall,
tax is imposed as table 3.1.
Table 3.1. EU AD on Vietnam and People Republic China Footwear
Countries 7-Apr-2006 to 1-
Jun- 2006
2-Jun-2006 to 13-
Jul-2006
14-Jul-2006 to
14-Sept-2006
After 15-Sept-
2006
Vietnam 4,2% 8,4% 12,6% 16,8%
China 4,8 % 9,7 % 14,5% 19,4%
Source (553/2006)
Tax requisition has strong effect on export of the two countries to EU. As described in
Figure 3.3, products which are under investigation of EU have decreased significantly from
year 2005. The year 2003 shows VN AD Footwear export to EU soar 15% in value and
35.5% in quantity. This trend is continued in 2004 with 9, 2% and 15, 8%. However, after
EU launches notice of AD, value’s increase falls to 0% in 2005, -8.5% in 2006 and -13.8%
in 2007. Those years see changing in quantity -5.5%, -12.78% and -13.05% respectively.
These changes are consistent with theory findings of(Dale, 1980; Feenstra, 2003; Staiger &
Wolak, 1994).It is not only consistent with theory but also empirical of (Brenton, 2001;
Messerlin, 1989). In addition, it is similar to (Prusa, 2003)when he gives evidences of fall of
30% to 50% of AD products import to US. This is support by (Brenton, 2001)to the decrease
of 20% in the first year after tax initiate.
38. 29
Figure 3.3. EU import Vietnam AD footwear and non-AD footwear
Source: author collected data from http://epp.eurostat.ec.europa.eu/newxtweb/
3.2 Data Description
My analysis bases on three dataset: EU import data, Vietnam Enterprise Survey and
US import data. This section gives a description for each dataset.
3.2.1 EU Import 8-digit (CN8) Data
Data for EU import footwear is retrieved from European Commission StatisticsOffice
(EUROSTAT) website (http://epp.eurostat.ec.europa.eu/newxtweb/). It contains all export
and import data of EU members with intra and extra partners. EU here is defined as EU25
including:Belgium (BE), Denmark (DK), France (FR), Germany (DE), Greece (EL), Ireland
(IE), Italy (IT), Luxembourg (LU), Netherlands (NL), Portugal (PT), Spain (ES) and United
Kingdom (UK) , Austria (AT), Finland (FI) and Sweden (SE), Cyprus (CY), Czech Republic
(CZ), Estonia (EE), Hungary (HU), Latvia (LV), Lithuania (LT), Malta (MT), Poland (PL),
Slovakia (SK) and Slovenia (SI). In this paper, we are using 8-digit Combined Nomenclature
(CN8) data since EU used CN8 code classified antidumping products.Import information on
value (in Euro) and quantity (in Kilograms) are obtained. Value does not include tariff,
39. 30
freight, insurances and other surcharges. I calculated price by dividing value and volume.
Data is available from 1999 to 2012.
Table 3.2.Vietnam AD footwear export value, volume, price to US compareto control groups
Groups Obs Mean Std.dev Min Max Growth
Value
in
thousand
Euro
Vietnam
1999-2004 193 26559 55817.6 7.0 241902
8.2%
2006-2011 193 28842 54511.3 1.3 248755
Thailand
1999-2004 192 4122 9036.8 .01 53158
47.6%
2006-2011 192 6086 13350.7 .0 88265
Indo
1999-2004 193 9276 21019.6 .7 96393
77.8%
2006-2011 192 16500 31545.7 5.0 149469
India
1999-2004 193 9559 22000.1 33.1 159676
146.6%
2006-2011 193 23578 42383.0 367.5 258426
Vietnam
Apparel
1999-2004 2564 1694 8832.6 0 191904
91.5%
2006-2011 2557 3247 10023.2 0 139126
Quantity
in
100
kg
Vietnam
1999-2004 193 22571 49698.1 2 319418
-6.2%
2006-2011 193 21164 40840.6 0 207291
Thailand
1999-2004 192 2477 5355.5 0 29435
44.7%
2006-2011 192 3585 8175.2 0 57206
Indo
1999-2004 193 9966 39275.1 0 426232
21.8%
2006-2011 192 12139 25332.7 0 127433
India
1999-2004 193 8167 20187.2 23 155399
104.8%
2006-2011 193 16728 33724.8 246 211403
Vietnam
Apparel
1999-2004 2564 1554 6201.8 0 90419
134.4%
2006-2011 2557 3644 11874.1 0 234763
Price
in
Euros
over
kg
Vietnam
1999-2004 193 12.93 6.45 1.46 81.747
24.1%
2006-2011 192 16.06 6.81 7.18 73.25
40. 31
A descriptive statistics of import value, volume and price to EU from Vietnam AD
footwear, its relative from Thailand, Indonesia, and Vietnam Apparel export to EU is given
in table 3.2.We take average for two period, the first is 2004 and before; the second is 2006
and after. Since announcement of tax is noticed in July 2005 and AD is lifted at the end of
2011, we eliminate year 2005 and year 2012. In overall, an 8-digit product of Vietnam AD
footwear export value is 26559 thousand euro in 1999 to 2004, while it is 28842 thousand
euro in 2006 to 2011. That is only 8.2% increase. For Thailand, growth rate is 47.6% while
Indonesia record 77.8% promotion. India, country that EU uses as control to assess
Vietnam,goes up 146.6%.In addition, averagegrowth rate of 8-digit apparel, a similar product
to footwear, is 91.5%. Trend on volume is similar to value. It is recorded that Vietnam AD
footwear quantity falls -6.2% while the others demonstrates a significant growth. In
precisely, Thailand is 44.7% while Indonesia is 21.8%, India is 104.8% and 134.4% for
Vietnam apparel. For price effects, Vietnam AD footwear soars 24.1% and is the highest
growth one. On those given, general trend in 8-digit data shows Vietnam AD footwear
volume and value export to EU is significantly fall in relatively with the others countries and
apparel industry.
Instead of giving information on Vietnam-AD footwear such as table 3.2, table 3.3
reveals information on Vietnam Non-AD products and its corresponding from India,
Indonesia and Thailand. It is reminded that EU announce petition and raised tax on 31 lines
Thailand
1999-2004 190 18.19 9.11 .99 67.81
1.8%
2006-2011 185 18.52 11.21 2.18 128.42
Indo
1999-2004 192 16.37 14.51 1.37 194.38
15.0%
2006-2011 191 18.84 8.28 5.14 63.64
India
1999-2004 193 12.68 3.90 5.90 49.93
20.1%
2006-2011 193 15.23 3.50 9.17 37.92
Vietnam
Apparel
1999-2004 2407 15.46 17.29 .07 225.07 -2.5%
2006-2011 2557 15.07 15.33 .09 303.03
41. 32
while footwear contains 75 lines of products at 8-digit level. That is, 44 lines are not in list of
penalty. It could be seen that value export of Vietnam Non-AD footwear had increased 6.6%
after duty. In comparison, Thailand declines 60.8% whilea decrease of 21.8% and 0.6% are
recorded to Indonesia and India respectively. On the contrary to value, quantity and export
price of Vietnamdrop 15.5% and 37.2% correspondingly. In same period, it is observed that
export quantity of Thailand and Indonesia narrow 61.3% and 35.3% but India goes 2.6% up.
For price, both India and Indonesia have slight increase 9.9% and 6.5% appropriately while
Thailand reduces a small number 5.3%.
Table 3.3.Vietnam Non- AD footwear export value, volume, price to US compareto control
groups
Groups Obs Mean Std.dev Min Max Growth
Value
in
thousand
Euro
Vietnam
1999-2004 280 22675.4 49214.1 0 253894
6.6%
2006-2011 279 24176 52882.2 .10 303368
Thailand
1999-2004 286 3576.8 10072.3 .13 75904
-60.8%
2006-2011 264 1400.3 3739.6 .04 27466.3
Indo
1999-2004 277 7308.8 17010.0 .11 119344
-21.8%
2006-2011 266 5716.2 13882 .01 127025
India
1999-2004 268 5863.8 30064.3 .01 257844
-0.6%
2006-2011 274 5827.6 25441.9 0 201102
Quantity
in
100
kg
Vietnam
1999-2004 280 26922.0 63162.5 0 521117
-15.5%
2006-2011 279 22747.2 52875.1 0 350310
Thailand
1999-2004 286 2929.5 7092.4 0 50717
-61.3%
2006-2011 264 1132.0 2861.5 0 20340
Indo
1999-2004 277 6256.7 17018.1 0 203249
-35.3%
2006-2011 266 4048.1 9938.1 0 89584
India
1999-2004 268 3066.4 10930.4 0 81785
2.6%
2006-2011 274 3146.3 10244.9 0 68153
42. 33
3.2.2 Vietnam Enterprise Survey Data
To evaluate impact of AD on Vietnam footwear firm, we employ panel Vietnam
Enterprise Survey. The dataset is collected by Vietnam General Statistics Office (GSO) and
its provincial sub-institution. First, this paper uses panel data of two years 2004 and 2006.
Survey of 2004 has 91755 observations while Survey 2006 has 131347 firms. It has 329
footwear firms are observed in 2004. And, there are 369 occurrences of treatment in sample
of 2006. Samples include data of firm’s revenue, labor information, capital information, etc.
For robustness, we enhance data sample by include two years 2003 and 2007 to our sample.
One obstacle occurs when combine data of 2006, 2007 with 2003. 2004. As Survey is
collected base on Vietnam business category which is changed in 2006, then we must
concord code of year 2006 and year 2007 with code of 2004 and 2005.
Table 3.4. Descriptive Statistics of Vietnam Firms Characteristics
Year Variables Groups No.obs Mean Std.dev Minimum Maximum
2003 Revenue Footwear 242 95028.78 327708.6 52 3943890
Apparel 938 24044.61 77079.69 5 1316961
W.P.T 3009 20334.77 71681.73 5 1316961
Payroll Footwear 242 12.04516 7.937063 .738 66.72803
Apparel 938 20.59294 177.8277 .7717391 5382
W.P.T 3009 15.34298 111.246 .2686567 5382
Price
in
Euros
over
kg
Vietnam
1999-2004 266 2.18 10.26 .07 119.44
-37.2%
2006-2011 272 1.37 .98 .27 10.59
Thailand
1999-2004 269 1.52 2.36 .07 36.88
-5.3%
2006-2011 244 1.44 .91 .13 7.02
Indo
1999-2004 264 1.53 1.59 .06 15.73
6.5%
2006-2011 250 1.63 1.27 .05 9.17
India
1999-2004 255 1.21 .84 .09 8.08
9.9%
2006-2011 268 1.33 .64 .33 4.92
45. 36
Apparel 2013 .717194 .171154 .0714286 1
W.P.T 6320 .5224489 .2598486 .0108108 1
We are not using all business category of Survey but we uses only apparel products as
control group and footwear as treatment group. This Survey is constructed based on SITC 4-
digit. Thus, we use footwear as proxy for firms under AD. For robustness, we change control
group by enhancing control group totextile, paper & wooden products.Data description of
variables related to our analysisis demonstratedin table 4. As given in table, we can see
mean, standard deviation, maximum, minimum and number of observations of each group
over years 2003, 2004, 2006 and 2007. Revenue, Payroll is measured in millions of Vietnam
Dong in one year; capital is measured in millions of Vietnam Dong. Female ratio is
calculated by fraction of number of female employee over total employees. Firm‘s size
represents for labor. There are three groups, one treatment and two controls. Footwear
implies footwear firms while Apparel indicates enterprises works in apparel sectors. The
word W.P.T is acronym of wood and wooden, papers and textiles products.
3.2.3 US Import 10-digit (HTS10) Data
US import 10-digit (hts10) data is collected from US international trade commission
website (at http://dataweb.usitc.gov/). Import and export from all countries to and from US
are recorded by the commission. We are using import data which is categorized by
Harmonized Tariff Schedule number.Data at 10-digit level is available and it is smallest unit,
hence, we will adopt this for our research. Values are disclosed in thousand US dollars, the
quantities are reported in units. The units depend on lines of product. For example, some
lines of footwear are measured by dozen while some measured in kilograms. Price
mentioned in table is average price and is measured by USD per unit. Although, there is
difference in unit, table 4.4 demonstrates a description of US import data. In overall, average
export value of Vietnam footwear export increases 629.6% while its volume accelerates
422.8%. It is only Vietnamese apparel has same speed with 657.8% and 483% respectively
to value and volume. It is also recorded that India footwear has considerably promotion of
46. 37
63.7% and 38.2% corresponding to the twos. On the contrary, Indonesia and Thailand report
a 35% fall in value and 30% in quantity for each country. In another view, price of Vietnam
footwear, Thailand, Indonesia, India and even Vietnam apparel have same trend in rising
with 66.9%, 52.7%, 75.2%, 81.9%, 70.4% respectively to each group .
Table 3.5.Vietnam footwear export value, volume, price to US compareto control groups
Groups Obs Mean Std.dev Min Max Growth
Value
in
thousand
USD
Vietnam
Footwear
1996-2004 3834 437.1 3363.2 0 73491.9
629.6%
2006-2011 2556 3189.7 17878.5 0 294644.7
Thailand
1996-2004 3744 773.0 3917.7 0 64392.8
-37.3%
2006-2011 2496 484.6 2707.4 0 52683.1
Indo
1996-2004 3780 1820.6 10281.3 0 122866
-33.2%
2006-2011 2520 1216.2 7427.4 0 10831.1
India
1996-2004 3420 280.4 2998.6 0 61967.7
63.7%
2006-2011 2280 459.09 4108.7 0 81569.2
Vietnam
Apparel
1996-2004 1485 403.69 4937.4 0 270285.3
657.8%
2006-2011 9906 3059.5 20105.5 0 738191.1
Quantity
in
1000
Units
Vietnam
Footwear
1996-2004 3834 37.15 273.1 0 5769.5
422.8%
2006-2011 2556 287.0 1427.9 0 19986.4
Thailand
1996-2004 3744 66.60 304.9 0 5224.5
-33.7%
2006-2011 2496 37.41 202.1 0 3849.0
Indo
1996-2004 3780 175.5 920.2 0 16660.9
-28.3%
2006-2011 2520 106.8 659.2 0 10831.1
India
1996-2004 3420 19.94 190.5 0 3937.4
38.2%
2006-2011 2280 27.55 226.9 0 5210.1
Vietnam
Apparel
1996-2004 14859 16.63 278.99 0 18119.7
483%
2006-2011 9906 96.96 738.78 0 23785.4
48. 39
Chapter 4: Model Estimation and Research Findings
4.1 Double Difference Approach
This research applies Double Difference (DD) method to estimate effects of
antidumping (AD) footwear. DD measures impacts of a policy by comparing treatment and
control group over time of before and after intervention. Let separate ex-ante and ex-post
period by variable YEAR_t which is equal to 0 or 1 respectively for the two periods. Thus,
YEAR_t controls for year fixed effects. . It includes exchange rate effects, inflation effects,
etc, in general, it represent for macroeconomics factors changes over period of before and
after tax rising. YTt and YCt are outcome of interest of treatment and control group, for
example revenue, profit, cost, labor payroll, firm size,etc, in year t. According to (Khandker
et al., 2010), effect of AD could be seen as
DD = E(YT1 – YC1|T1 =1) – E(YT0- YC0|T0 = 0) (4.1)
Where T1 =1 stands for “named” AD group after intervention while T0 =0 represents
for “non-named” AD group. This DD assumes unobserved heterogeneity is time-invariant.
As describes in (1), it is E(YT0- YC0|T0 = 0), and is eliminated in DD formula. This
assumption is weaker than assumption of conditional erogeneity. However, it is better than
before-after method since it can eliminate time-invariant bias. DD regression could be
demonstrated as
Yit = α + β*Ti1*YEAR_t + 𝜌 ∗ 𝑇i1+ 𝜔 ∗ 𝑌𝐸𝐴𝑅_t + εit (4.2)
Substitute T1 = 1 and T1 = 0 into (4.2),
E(YT1 – YC1|T1 =1) = (α + β + 𝜌 + 𝜔) - (α + 𝜔)
E(YT0- YC0|T0 = 0) = (α + 𝜌) – α
As such, equation (4.1) could be equal to
DD = (α + β + 𝜌 + 𝜔) - (α + 𝜔) - [(α +𝜌) – α] = β (4.3)
49. 40
On these given, DD is combination of YEAR_t and treated group. In other words,
Coefficient β is interpreted as the effect of policy on year t on individual i of group T. In
addition, one of most important assumption for DD methods is Cov(Ti1*YEAR_t,εit) = 0.
That is, bias is time-invariant. To satisfy this assumption, control group should have the
common characteristics with the “treatment” group. Besides that, Difference-In-Difference
model might be modified as (Brambilla et al., 2012).
LnYit = α + Ai + β*Ti*YEAR_t + 𝜌 ∗ 𝑇i+ 𝜔 ∗ 𝑌𝐸𝐴𝑅_t + 𝛿*lnxit + εit (4.4)
xit represents for the vector of individual’s characteristic such as firm‘s age, firm‘s size and
firm’s capital per employee, location of firms, etc which changes over time. Ai is fixed
effects of individuals. By adding individuals characteristics and individuals fixed effects, we
can control for observed biases.
An illustration of DD method could be seen as figure 11. We reveal case of Appling
DD method to measure effect of Antidumping Duty (AD) on revenue of Vietnam footwear
Firm. Let divide time period of before and after intervention. At beginning, it is assumed
enterprise’s revenue of Vietnam Footwear Firms is YiAwhereas YiB is revenue of control
group. After AD, revenue of footwear and Apparel are YiA2 and YiB1 respectively.
50. 41
Figure 4.1. Difference in Difference Method
YiA1 is expected revenue of footwear enterprise without AD which is never observed in
practice. DD approach assumes (YiA – YiB) is equal to (YiA1 – YiB1).Thus, effect of EU AD
on Vietnam footwear firm’s revenue is: (YiA2 – YiA) – ( YiB1- YiB) . This can derives
similarly to evaluate effect of AD on footwear firm in: profit, labor payroll, and firm’s size,
etc.
4.2 Double Difference in Multiple Years
Model (4.4) could be generalized for multiple years as described in (Blanchflower,
Oswald, & Sanfey, 1996)
Tải bản FULL (99 trang): https://bit.ly/3JOQnje
Dự phòng: fb.com/TaiHo123doc.net
51. 42
LnYit = α + Ai + β*Ti*YEAR_t+𝜔_𝑡 ∗ 𝑌𝐸𝐴𝑅_t + 𝛿*lnxit+ εit (4.5)
YEAR_t stand for year fixed effects. There is a little difference between value of YEAR_t in
(4.5) and in (4.4). Instead of having only two values 0 and 1 as in (4.4), in (4.5) YEAR_t is
range of years that have data fulfill. We take first difference for both left and right hand site
of equation. Source of time-invariant heterogeneity is different out as (Ai – Ai) that is equal
to zero. Xit represents for the control of time-variant individuals characteristics while
𝑌𝐸𝐴𝑅_t controls for year fixed effects. As such, β is estimation of influence of policy on
outcome of interest Yit. We customize 4.5 to our research. We adjust covariate
β*Ti*YEAR_t to be β*Ti*AfterAD_t. AfterAD_t have only two values 0 and 1 respectively
for before and after policy intervention. We also add control for country fixed effects
Countrys. To compare Vietnam footwear with other countries, 4.5 could be rewritten as. Ai is
control for industry fixed effect.
LnYst = α +Ai+ Countrys+ ω_t*YEAR_t + β * Countrys* AfterAD_t + δ*Xst + εst (4.6)
Besides that, to make our results stronger, we also run regression for only VN industries as
described in 4.6b. Footwear is treatment; other industries are control.
LnYit = α + Ai+ ω_t*YEAR_t + β * Industry_i * AfterAD_t + δ*X_it + εit(4.6b)
Industry_i is dummy variable control industry which is equal to 1 if industry is footwear;
otherwise it takes value of zero.
4.3 Estimation Impact of EU Antidumping on Vietnam Footwear Export
To evaluate influence of EU AD on Vietnam footwear Export at industry level, we
employ equation4.6 with a slight adjustment. To assess AD effects on value import 4.7 is
modified as
LogValueist= α + Ai+ Vn+ β*ddVN+ 𝜔_𝑡 ∗ 𝑌𝐸𝐴𝑅_t +εit (4.7)
Tải bản FULL (99 trang): https://bit.ly/3JOQnje
Dự phòng: fb.com/TaiHo123doc.net
52. 43
LogValueist is logarithm of value import to EU in industry i from country s in year t. Vn is
country-fixed effects. That is, it will take value of one for Vietnam and 0 for the others.
ddVNis binary variable which is interaction of industry i and country s (Tis ) and AfterAD_t.
Whereas, Tis is equal to 1 if industry is in EU “named” AD list and from country Vietnam,
otherwise it is zero. YEAR_t, AfterAD_t, εit are defined as 4.7.In equation 4.8, 4.9, 4.10,
ddVN takes role of DD variable. Ai is industry time-invariant fixed effects. A similar
equation with 4.8 is applied to evaluate impact of AD on quantity export to EU from VN.
LogQuantiyist= α + Ai + Vn+ β*ddVN+ 𝜔_𝑡 ∗ 𝑌𝐸𝐴𝑅_t + εit (4.8)
LogQuantiyist represents for log of quantity import to EU in industry i from country s in year
t. This research also verifies impact of EU AD on price of AD footwear from Vietnam. This
is reflex in equation 4.10
LogPriceist= α + Ai + Vn+ β*ddVN+ 𝜔_𝑡 ∗ 𝑌𝐸𝐴𝑅_t+ εit(4.9)
LogPriceist stands for log of price import to EU in industry i from country s in year t. In short,
a summary for variables and their definitions was illustrated in table1 of Appendix A
Figure4.2 describes information of Vietnamese AD footwear, Thailand, Indonesia,
India, and Vietnam Apparel export to EU. The terms Thailand, Indonesia, India indicates
footwear of those countries corresponding to Vietnam AD footwear. We review the trend of
those groups on log of value, volume and price before 2004 to choose control group. As
given graphs, India is group that the most close to Vietnamese footwear in period 1999-2004
in value, quantity and price. Also, it is country, which EC used as control to evaluate claims
on Vietnam footwear price. For value, Thailand footwear export has felt down since 2007. It
might come from politics instability after a prime minister was overthrown in Sept 2006.
Period 2001-2004 revealed a significant decline of Indonesia, Thailand and Vietnam Apparel
value in comparing to treatment group. For quantity, Indonesia has risen rapidly from period
200-2002 before falling down quickly in 2002-2004 while Thailand, again, down
significantly after 2007. For Price, Indonesia and Vietnam Apparel expose notably drop in
6677557