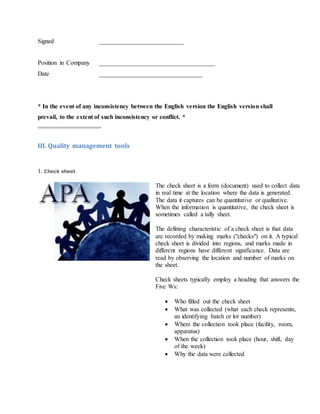
This document discusses quality management system questionnaires. It provides information on quality management system questionnaire forms, tools, and strategies. It also lists additional useful resources for quality management including ebooks, forms, templates, key performance indicators, and interview questions. The main body includes a sample quality management system questionnaire for a company to complete. It requests information on the company, certification details, quality management tools used, and management systems. Included are sections on applicant information, certification information, and four common quality management tools - check sheets, control charts, Pareto charts, and scatter plots.
![2. Control chart
Control charts, also known as Shewhart charts
(after Walter A. Shewhart) or process-behavior
charts, in statistical process control are tools used
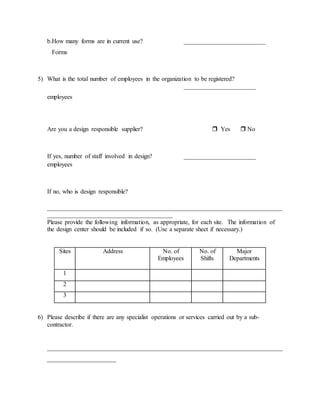
to determine if a manufacturing or business
process is in a state of statistical control.
If analysis of the control chart indicates that the
process is currently under control (i.e., is stable,
with variation only coming from sources common
to the process), then no corrections or changes to
process control parameters are needed or desired.
In addition, data from the process can be used to
predict the future performance of the process. If
the chart indicates that the monitored process is
not in control, analysis of the chart can help
determine the sources of variation, as this will
result in degraded process performance.[1] A
process that is stable but operating outside of
desired (specification) limits (e.g., scrap rates
may be in statistical control but above desired
limits) needs to be improved through a deliberate
effort to understand the causes of current
performance and fundamentally improve the
process.
The control chart is one of the seven basic tools of
quality control.[3] Typically control charts are
used for time-series data, though they can be used
for data that have logical comparability (i.e. you
want to compare samples that were taken all at
the same time, or the performance of different
individuals), however the type of chart used to do
this requires consideration.
3. Pareto chart](https://image.slidesharecdn.com/qualitymanagementsystemquestionnaire-150215192013-conversion-gate01/85/Quality-management-system-questionnaire-7-320.jpg)
![A Pareto chart, named after Vilfredo Pareto, is a type
of chart that contains both bars and a line graph, where
individual values are represented in descending order
by bars, and the cumulative total is represented by the
line.
The left vertical axis is the frequency of occurrence,
but it can alternatively represent cost or another
important unit of measure. The right vertical axis is
the cumulative percentage of the total number of
occurrences, total cost, or total of the particular unit of
measure. Because the reasons are in decreasing order,
the cumulative function is a concave function. To take
the example above, in order to lower the amount of
late arrivals by 78%, it is sufficient to solve the first
three issues.
The purpose of the Pareto chart is to highlight the
most important among a (typically large) set of
factors. In quality control, it often represents the most
common sources of defects, the highest occurring type
of defect, or the most frequent reasons for customer
complaints, and so on. Wilkinson (2006) devised an
algorithm for producing statistically based acceptance
limits (similar to confidence intervals) for each bar in
the Pareto chart.
4. Scatter plot Method
A scatter plot, scatterplot, or scattergraph is a type of
mathematical diagram using Cartesian coordinates to
display values for two variables for a set of data.
The data is displayed as a collection of points, each
having the value of one variable determining the position
on the horizontal axis and the value of the other variable
determining the position on the vertical axis.[2] This kind
of plot is also called a scatter chart, scattergram, scatter
diagram,[3] or scatter graph.
A scatter plot is used when a variable exists that is under
the control of the experimenter. If a parameter exists that](https://image.slidesharecdn.com/qualitymanagementsystemquestionnaire-150215192013-conversion-gate01/85/Quality-management-system-questionnaire-8-320.jpg)
![5.Ishikawa diagram
Ishikawa diagrams (also called fishbone diagrams,
herringbone diagrams, cause-and-effect diagrams, or
Fishikawa) are causal diagrams created by Kaoru
Ishikawa (1968) that show the causes of a specific
event.[1][2] Common uses of the Ishikawa diagram are
product design and quality defect prevention, to identify
potential factors causing an overall effect. Each cause or
reason for imperfection is a source of variation. Causes
are usually grouped into major categories to identify these
sources of variation. The categories typically include
People: Anyone involved with the process
Methods: How the process is performed and the
specific requirements for doing it, such as policies,
procedures, rules, regulations and laws
Machines: Any equipment, computers, tools, etc.
required to accomplish the job
Materials: Raw materials, parts, pens, paper, etc.
used to produce the final product
Measurements: Data generated from the process
that are used to evaluate its quality
Environment: The conditions, such as location,
time, temperature, and culture in which the process
operates
6. Histogram method](https://image.slidesharecdn.com/qualitymanagementsystemquestionnaire-150215192013-conversion-gate01/85/Quality-management-system-questionnaire-10-320.jpg)
![A histogram is a graphical representation of the
distribution of data. It is an estimate of the probability
distribution of a continuous variable (quantitative
variable) and was first introduced by Karl Pearson.[1] To
construct a histogram, the first step is to "bin" the range of
values -- that is, divide the entire range of values into a
series of small intervals -- and then count how many
values fall into each interval. A rectangle is drawn with
height proportional to the count and width equal to the bin
size, so that rectangles abut each other. A histogram may
also be normalized displaying relative frequencies. It then
shows the proportion of cases that fall into each of several
categories, with the sum of the heights equaling 1. The
bins are usually specified as consecutive, non-overlapping
intervals of a variable. The bins (intervals) must be
adjacent, and usually equal size.[2] The rectangles of a
histogram are drawn so that they touch each other to
indicate that the original variable is continuous.[3]
III. Other topics related to Quality management system questionnaire (pdf
download)
quality management systems
quality management courses
quality management tools
iso 9001 quality management system
quality management process
quality management system example
quality system management
quality management techniques
quality management standards
quality management policy
quality management strategy
quality management books](https://image.slidesharecdn.com/qualitymanagementsystemquestionnaire-150215192013-conversion-gate01/85/Quality-management-system-questionnaire-11-320.jpg)