Download to read offline

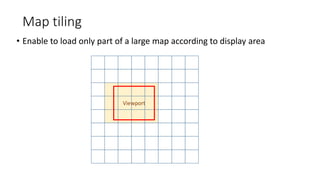

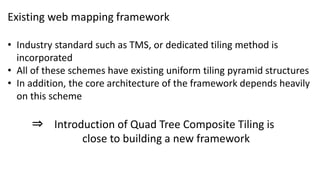
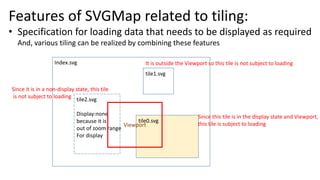
![Pyramid of Quad Tree Tiling [Quad Tree Composite Tiling]
Zoom=0 Zoom=1 Zoom=2 Zoom=3
Vector tile generation: Always use this vector tile at zoom levels higher than this zoom level
Raster tile generation: Use this tile at this zoom level only
Note: thinned out or summarized vector tiles are also acceptable
No tile generation: Use Vector Tiles at a lower zoom levels than it](https://image.slidesharecdn.com/quadtreecompositetilingen-180831042121/85/Quad-Tree-Composite-Tiling-for-Web-Mapping-in-English-10-320.jpg)
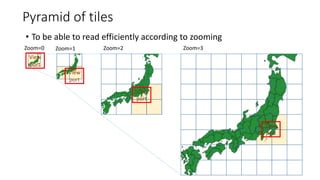
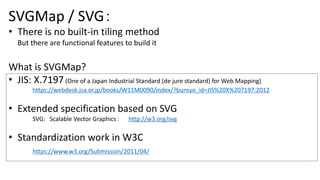
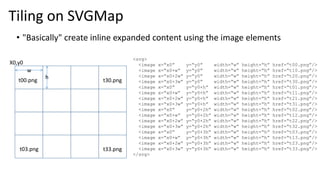
![Zoom=0 Zoom=1 Zoom=2 Zoom=3
Viewport
For this part, the
generated vector tile
at the lower zoom
level is used
Vector tile generation: Always use this vector tile at zoom levels higher than this zoom level
Raster tile generation: Use this tile at this zoom level only
Note: thinned out or summarized vector tiles are also acceptable
No tile generation: Use Vector Tiles at a lower zoom levels than it
Pyramid of Quad Tree Tiling [Quad Tree Composite Tiling]](https://image.slidesharecdn.com/quadtreecompositetilingen-180831042121/85/Quad-Tree-Composite-Tiling-for-Web-Mapping-in-English-11-320.jpg)
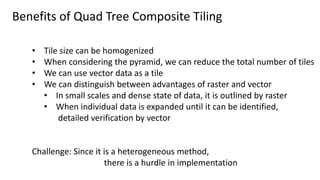

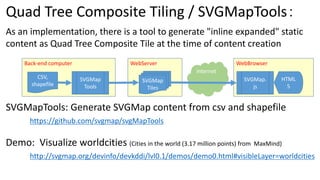

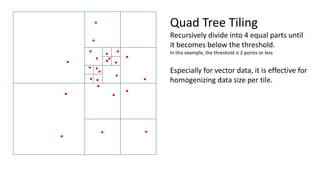
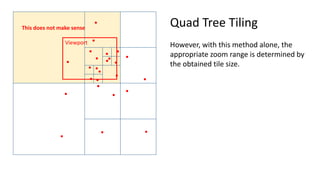
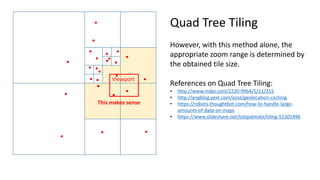
The document discusses quad tree composite tiling, an effective method for mixing vector and raster map tiles. It addresses issues with traditional tiling approaches for vector data as scale changes. A quad tree recursively subdivides tile space to homogenize tile size. Composite tiling creates a tile pyramid with vector tiles at higher zooms and raster at lower zooms. SVGMap enables this by embedding tiles within SVG and controlling tile visibility by zoom level. Tools generate static SVG quad tree composite tiles from GIS data.