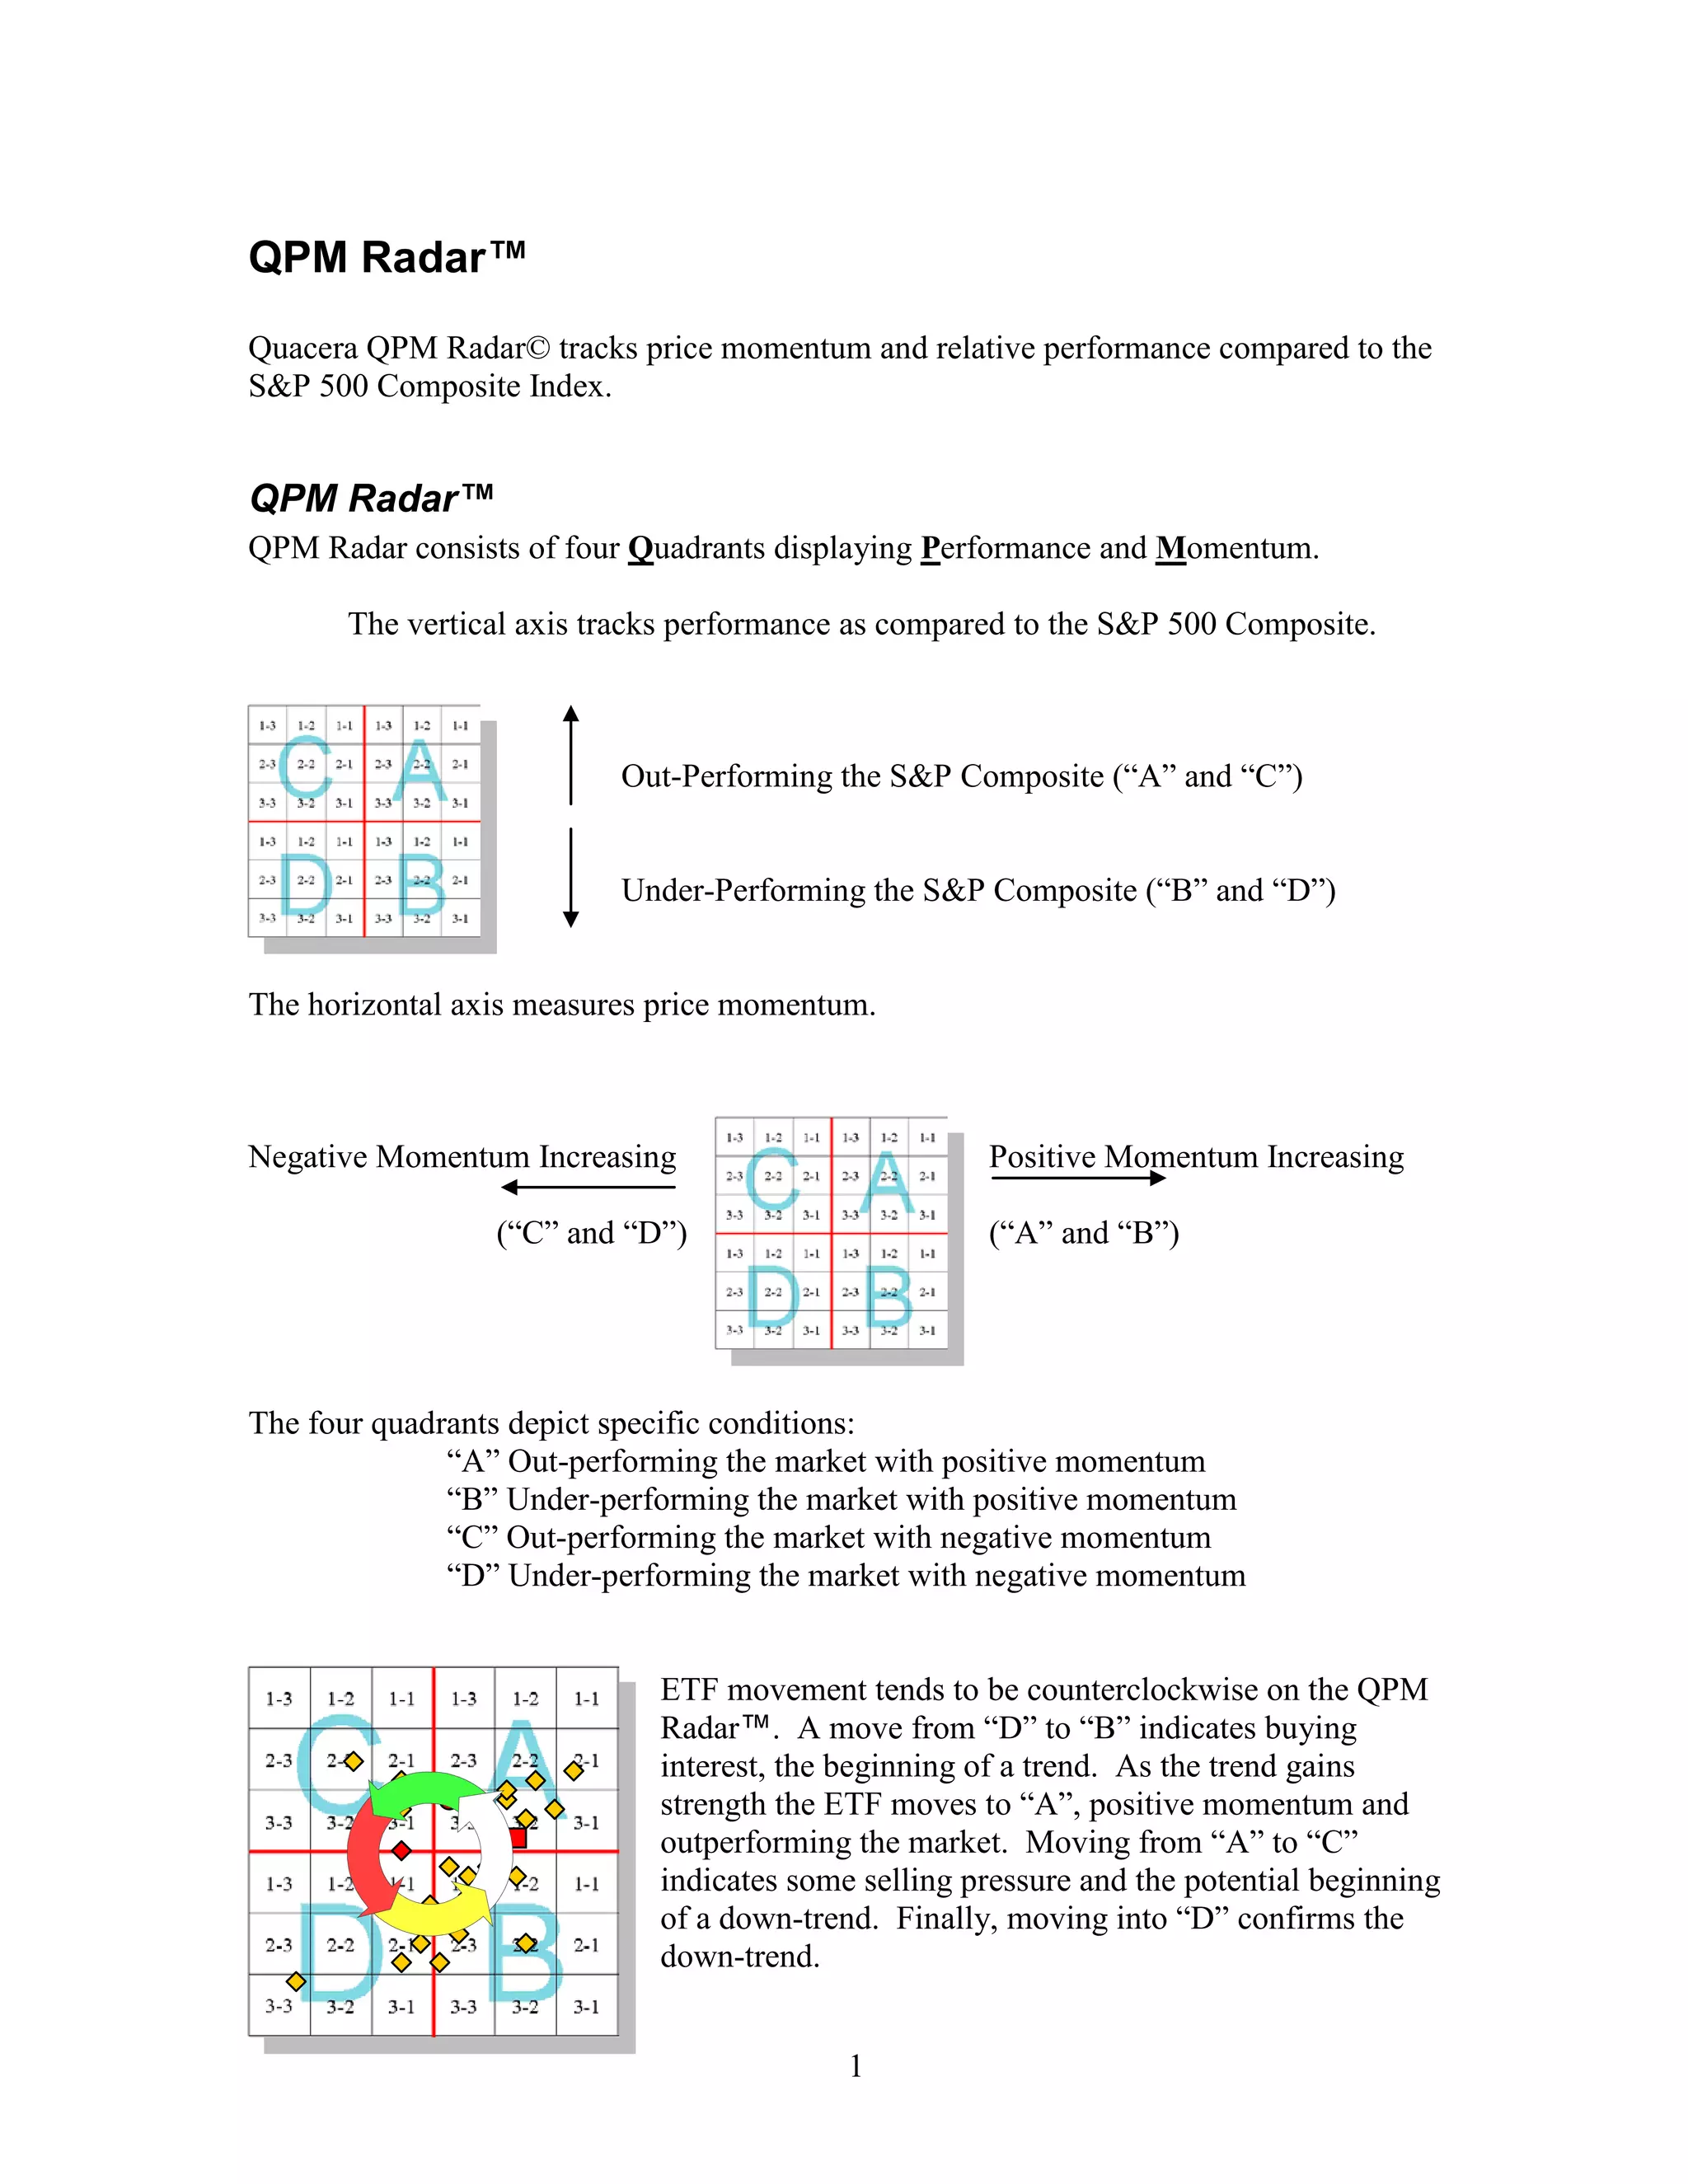
QPM Radar™
Quacera QPM Radar© tracks price momentum and relative performance compared to the
S&P 500 Composite Index.


QPM Radar™
QPM Radar consists of four Quadrants displaying Performance and Momentum.

      The vertical axis tracks performance as compared to the S&P 500 Composite.


                          Out-Performing the S&P Composite (“A” and “C”)


                          Under-Performing the S&P Composite (“B” and “D”)


The horizontal axis measures price momentum.


Negative Momentum Increasing                        Positive Momentum Increasing

                 (“C” and “D”)                      (“A” and “B”)


The four quadrants depict specific conditions:
              “A” Out-performing the market with positive momentum
              “B” Under-performing the market with positive momentum
              “C” Out-performing the market with negative momentum
              “D” Under-performing the market with negative momentum


                            ETF movement tends to be counterclockwise on the QPM
                            Radar™. A move from “D” to “B” indicates buying
                            interest, the beginning of a trend. As the trend gains
                            strength the ETF moves to “A”, positive momentum and
                            outperforming the market. Moving from “A” to “C”
                            indicates some selling pressure and the potential beginning
                            of a down-trend. Finally, moving into “D” confirms the
                            down-trend.


                                          1
2

Qpm radar explanation

  • 1.
    QPM Radar™ Quacera QPMRadar© tracks price momentum and relative performance compared to the S&P 500 Composite Index. QPM Radar™ QPM Radar consists of four Quadrants displaying Performance and Momentum. The vertical axis tracks performance as compared to the S&P 500 Composite. Out-Performing the S&P Composite (“A” and “C”) Under-Performing the S&P Composite (“B” and “D”) The horizontal axis measures price momentum. Negative Momentum Increasing Positive Momentum Increasing (“C” and “D”) (“A” and “B”) The four quadrants depict specific conditions: “A” Out-performing the market with positive momentum “B” Under-performing the market with positive momentum “C” Out-performing the market with negative momentum “D” Under-performing the market with negative momentum ETF movement tends to be counterclockwise on the QPM Radar™. A move from “D” to “B” indicates buying interest, the beginning of a trend. As the trend gains strength the ETF moves to “A”, positive momentum and outperforming the market. Moving from “A” to “C” indicates some selling pressure and the potential beginning of a down-trend. Finally, moving into “D” confirms the down-trend. 1
  • 2.