QNBFS Weekly Market Report February 03, 2022
•
0 likes•130 views

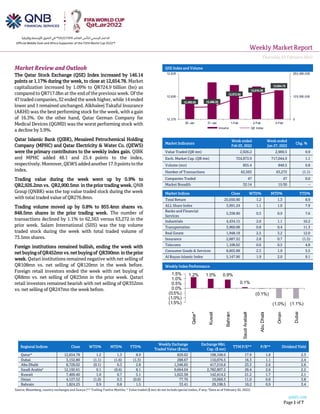
The Qatar Stock Exchange (QSE) Index increased by 146.14 points or 1.17% during the week, to close at 12,654.78

Recommended
Recommended
More Related Content
What's hot
What's hot (20)
Similar to QNBFS Weekly Market Report February 03, 2022
Similar to QNBFS Weekly Market Report February 03, 2022 (20)
More from QNB Group
More from QNB Group (20)
Recently uploaded
Recently uploaded (20)
QNBFS Weekly Market Report February 03, 2022
- 1. Weekly MarketReport Thursday,03February2022 qnbfs.com Page 1 of 7 Regional Indices Close WTD% MTD% YTD% Weekly Exchange Traded Value ($ mn) Exchange Mkt. Cap. ($ mn) TTM P/E** P/B** Dividend Yield Qatar* 12,654.78 1.2 1.3 8.9 826.02 198,108.0 17.9 1.8 2.3 Dubai 3,152.80 (1.1) (1.6) (1.3) 288.67 110,076.5 16.3 1.1 2.4 Abu Dhabi 8,728.02 (0.1) 0.3 2.8 1,546.65 417,510.6 23.3 2.6 2.6 Saudi Arabia# 12,192.61 0.1 (0.6) 8.1 9,664.04 2,782,007.2 26.4 2.6 2.2 Kuwait 7,400.40 1.0 0.7 5.1 1,022.58 142,414.2 21.2 1.7 2.1 Oman 4,127.52 (1.0) 0.3 (0.0) 77.76 19,069.3 11.0 0.8 3.8 Bahrain 1,824.25 0.9 0.8 1.5 33.41 29,198.5 10.2 0.9 3.4 Source: Bloomberg, country exchanges and Zawya (** Trailing Twelve Months; * Value traded ($ mn) do not include special trades, if any; #Data as of February 02, 2022) Market Review and Outlook QSE Index and Volume The Qatar Stock Exchange (QSE) Index increased by 146.14 points or 1.17% during the week, to close at 12,654.78. Market capitalization increased by 1.09% to QR724.9 billion (bn) as compared to QR717.0bn at the end of the previous week. Of the 47 traded companies, 32 ended the week higher, while 14 ended lower and 1 remained unchanged. Alkhaleej Takaful Insurance (AKHI) was the best performing stock for the week, with a gain of 16.3%. On the other hand, Qatar German Company for Medical Devices (QGMD) was the worst performing stock with a decline by 5.9%. Qatar Islamic Bank (QIBK), Mesaieed Petrochemical Holding Company (MPHC) and Qatar Electricity & Water Co. (QEWS) were the primary contributors to the weekly index gain. QIBK and MPHC added 48.1 and 25.4 points to the index, respectively. Moreover,QEWS addedanother 17.9points tothe index. Trading value during the week went up by 0.9% to QR2,926.2mn vs. QR2,900.5mn in the prior trading week. QNB Group (QNBK) was the top value traded stock during the week with total traded value of QR276.8mn. Trading volume moved up by 0.8% to 855.4mn shares vs. 848.5mn shares in the prior trading week. The number of transactions declined by 1.1% to 62,563 versus 63,272 in the prior week. Salam International (SIIS) was the top volume traded stock during the week with total traded volume of 73.5mn shares. Foreign institutions remained bullish, ending the week with netbuyingofQR452mnvs. netbuyingof QR390mn intheprior week. Qatari institutions remained negative with net selling of QR108mn vs. net selling of QR120mn in the week before. Foreign retail investors ended the week with net buying of QR8mn vs. net selling of QR23mn in the prior week. Qatari retail investors remained bearish with net selling of QR352mn vs. net selling of QR247mn the week before. Market Indicators Week ended Feb 03, 2022 Week ended Jan 27, 2022 Chg. % Value Traded (QR mn) 2,926.2 2,900.5 0.9 Exch. Market Cap. (QR mn) 724,873.9 717,044.9 1.1 Volume (mn) 855.4 848.5 0.8 Number of Transactions 62,563 63,272 (1.1) Companies Traded 47 47 0.0 Market Breadth 32:14 15:30 – Market Indices Close WTD% MTD% YTD% Total Return 25,050.90 1.2 1.3 8.9 ALL Share Index 3,991.24 1.1 1.0 7.9 Banks and Financial Services 5,338.90 0.3 0.9 7.6 Industrials 4,434.15 2.0 1.1 10.2 Transportation 3,960.08 0.8 0.4 11.3 Real Estate 1,948.18 2.5 3.2 12.0 Insurance 2,687.52 2.8 0.7 (1.5) Telecoms 1,108.02 0.6 0.5 4.8 Consumer Goods & Services 8,665.88 2.3 1.9 5.5 Al Rayan Islamic Index 5,147.96 1.9 2.0 9.1 Weekly Index Performance 12,495.00 12,498.20 12,572.55 12,610.29 12,654.78 0 125,000,000 250,000,000 12,375 12,600 12,825 30-Jan 31-Jan 1-Feb 2-Feb 3-Feb Volume QE Index 1.2% 1.0% 0.9% 0.1% (0.1%) (1.0%) (1.1%) (1.5%) (1.0%) (0.5%) 0.0% 0.5% 1.0% 1.5% Qatar* Kuwait Bahrain Saudi Arabia# Abu Dhabi Oman Dubai
- 2. qnbfs.com Page 2 of 7 Economic, Market & Company News Biden to notify Congress of designating Qatar as a major non- NATO ally – Amir HH Sheikh Tamim bin Hamad Al Thani and President of the United States of America HE Joe Biden discussed the strong bilateral strategic relations between the two countries and ways of enhancing and promoting them in various fields. During the meeting held at the White House yesterday, the two sides also discussed the most prominent regional and international developments. In a statement at the outset of the meeting, HE the US President welcomed HH the Amir, saying: “Today I am honoured to be here with a good friend with whom we have had a wonderful relationship since I have been President, and then before. HH the Sheikh I want to welcome you to the White House.”President Biden highlighted 50 years of partnership between the two countries, noting that the past year, the partnership has been central to many of the most vital US interests: Relocating tens of thousands of Afghans; maintaining stability in Gaza and providing lifesaving assistance to the Palestinians; deterring threats across the Middle East; and a lot more. President Biden noted that he will discuss with the Amir many issues including the security in the Gulf and in the broader Middle East, ensuring the stability of global energy supplies, continuing the work together to support the people of Afghanistan, and strengthening commercial and investment cooperation between the two countries. The President applauded the new deal that Qatar Airways Group signed with Boeing, considering it one of the largest deals that Boeing aircraft has ever had, and will support tens of thousands of good-paying jobs in the US. On the State of Qatar, President Biden said: “Qatar is a good friend, and a reliable and capable partner. And I am notifying Congress that I will designate Qatar as a major non- NATO ally to reflect the importance of our relationship. I think it’s long overdue.” The President thanked the Amir for the visit and for his commitment to the friendship between the two countries. Amir HH Sheikh Tamim bin Hamad Al Thani expressed his sincere thanks to President Biden for the warm meeting, and said that 2022 is a very important year as it marks the 50th anniversary of the diplomatic relationship between Qatar and the US, expressing his pride in these solid relations and what the two countries have achieved until now. (Peninsula Qatar) MARK's net profit declines 99.1% YoY and 99.2% QoQ in 4Q2021, misses our estimate – Masraf Al Rayan's (MARK) net profit declined 99.1% YoY (-99.2% QoQ) to QR4.4mn in 4Q2021, missing our estimate of QR623.1mn (variation of -99.3%). Total net income from financing and investing activities increased 7.4% YoY and 15% QoQ in 4Q2021 to QR1236.4mn. The company's total income came in at QR1364.1mn in 4Q2021, which represents an increase of 9.9% YoY (+13.5% QoQ). The bank's total assets stood at QR174bn at the end of December 31, 2021, up 43.7% YoY (+39.5% QoQ). Financing assets were QR120.6bn, registering a rise of 40.2% YoY (+38.6% QoQ) at the end of December 31, 2021. Customer current accounts rose 8.3% YoY and 6.7% QoQ to reach QR9.2bn at the end of December 31, 2021. Deposits closed at QR107bn, an increase of 55.2% compared to 2020. Shareholders’ equity increased by 63.4% to QR23.5bn. The capital adequacy ratio at year-end stood at a healthy 20.95%. MARK reported a net profit of QR1,718mn (QR1.7bn) for FY2021. The total income of the bank exceeded QR5,106mn. EPS amounted to QR0.218 in FY2021 as compared to QR0.290 in FY2020. The board has recommended (subject to QCB approval) to the Annual General Assembly the distribution of a cash dividend of 17% of the nominal share value that is QR0.17 per share. Commenting on the results, Masraf Al Rayan ChairmanHE Sheikh Mohammed bin Hamad bin Qassim Al Thani said, “The year 2021 was a momentous year for Masraf Al Rayan. We announced our merger with Al Khalij Commercial Bank in January 2021 and completed it in December, creating one of the leading Shari’a-compliant lenders in the region with a robust capital position and strong liquidity. (QSE, QNBFS Research, Qatar Tribune) NLCS reports net loss of QR7.1mn in 4Q2021 – Alijarah Holding (NLCS) reported net loss of QR7.1mn in 4Q2021 as compared to net profit of QR5.4mn in 4Q2020.The company's Total Revenues and Income came in at QR7.5mn in 4Q2021, which represents a decrease of 80.5% YoY (-38.0% QoQ). Loss per share amounted to QR0.030 in FY2021 as compared to earnings per share of QR0.026 in FY2020. (QSE) Mekdam Holding Group disclosed the annual financial statement of 2021 – Mekdam Holding Group discloses the interim financial statement for the twelve-month period ending 31st December, 2021. The financial statements revealed a net profit of QR28,555,792 in comparison to net profit QR23,578,016 for the same period of the previous year. Earnings per share (EPS) stood at QR0.571 for 2021 com-pared to EPS of QR0.472 in 2020. The Group’s revenue also rose by 94.3 percent to QR284.3mn for the period ended December 31, 2021, from QR146.3mn in 2020. The Board has also recommended the distribution of dividends to shareholders at the rate of 75 percent of the company’s capital. Cash dividends are distributed to shareholders at 35 percent of the company’s capital, and free shares are distributed to shareholders at a rate of 40 percent. Mekdam’s CEO Ehab Naser indicated that during 2021, the Group was able to sign new con- tracts worth QR625mn, exceeding its annual target. Contracts being implemented are valued at QR1.170bn, while the value of the remaining works stood at QR730mn. (QSE, Peninsula Qatar) QNCD's net profit declines 15.2% YoY and 21.3% QoQ in 4Q2021 – Qatar National Cement Company’s (QNCD) net profit declined 15.2% YoY (-21.3% QoQ) to QR57.4mn in 4Q2021. EPS amounted to QR0.34 in FY2021 as compared to QR0.23 in FY2020. Company proposed cash dividends of QR0.300/share. (QSE) VFQS's bottom line rises 117.6% YoY and 91.4% QoQ in 4Q2021, above our estimate – Vodafone Qatar's (VFQS) net profit rose 117.6% YoY (+91.4% QoQ) to QR127mn in 4Q2021, above our estimate of QR69.4mn. The company's revenue came in at QR780.2mn in 4Q2021, which represents an increase of 32.7% YoY (+33.9% QoQ). EPS amounted to QR0.077 in FY2021 as compared to QR0.044 in FY2020. For the year ended December 31, 2021, VFQS has reported a net profit of QR327mn, an increase of 76.9% or QR142mn compared to the previous year mainly
- 3. qnbfs.com Page 3 of 7 driven by EBITDA growth, despite the impact of COVID-19. Total revenue for the year increased by 14.8% YoY to reach QR2.5bn due to continued growth in the company’s postpaid, fixed broadband services (GigaHome), managed services and equipment and related services. Service revenue grew by 10.4% t to QR2.2bn. VFQS is now serving 1.9mn mobile customers representing a growth of 16.3% compared to the previous year, reflecting the Company's success in maintaining its growth trajectory. EBITDA surpassed QR1bn reflecting strong growth of QR223mn or 27.5% compared to the previous year, positively impacted by the higher service revenue and the continued cost optimization program. Consequently, EBITDA Margin improved by 4.1 percentage points to reach 40.8%. Based on VFQS’ commitment to enhance shareholder value and the strong financial performance, the Board of Directors recommended the distribution of a cash dividend of 6% of the nominal share value, QR0.06 per share, which will be presented at the Company’s next Annual General Assembly for approval. (QNB FS Research, QSE, Press Release) UDCD's bottom line rises 12.8% YoY and 237.4% QoQ in 4Q2021 – United Development Company's (UDCD) net profit attributable to equity shareholders rose 12.8% YoY (+237.4% QoQ) to QR146.7mn in 4Q2021. EPS amounted to QR0.092 in FY2021 as compared to QR0.064 in FY2020. For the year 2021, UDCD reported net profit of QR356mn and revenues of QR2bn. The net profit attributable to equity shareholders stood at QR326mn, with proposed dividends of 5.5%. (QSE, Peninsula Qatar) Qatar Insurance Company ranked as 'Top investment house' from MENA region for 4th year in a row – Qatar Insurance Company has been ranked as the 'Top Investment House' by The Asset magazine for the fourth year in a row. The survey ranked top investment houses in Asian G3 bonds (issued by Asian issuers in USD, EUR and JPY) based on the number of votes won where QIC garnered the most votes by their Astute Investors. (Gulf-Times.com) HSBC 'remains upbeat' on Qatar’s near, long-term prospects – HSBC “remains upbeat” on Qatar’s near and long-term prospects, with an already robust outlook now bolstered by rising oil prices and even stronger gains in natural gas receipts. “Trade data for the first ten months of 2021 gives a sense of the windfall higher energy receipts have brought, with export earnings receipts up more than 60% y-o-y, leaving Qatar with a trade surplus of around 30% of GDP,” HSBC Global Research said on Thursday. “We estimate that these strong export gains underpinned a current account surplus of some 6% of GDP for the full year, a figure we expect to push toward 10% of GDP over our forecast period, even as import demand gains with the recovery in growth. “Rising oil and gas income coupled with significant spending restraint were also sufficient to push public finances back into surplus over the first three quarters of last year, with the full-year outturn likely to have run at over 3% of GDP – the strongest performance in the Gulf,” noted Simon Williams, chief economist, (Central and Eastern Europe, Middle East and Africa – CEEMEA) at HSBC Bank. (Gulf- Times.com)
- 4. qnbfs.com Page 4 of 7 Qatar Stock Exchange Top Gainers Top Decliners Source: Qatar Stock Exchange (QSE) Source: Qatar Stock Exchange (QSE) Most Active Shares by Value (QR Million) Most Active Shares by Volume (Million) Source: Qatar Stock Exchange (QSE) Source: Qatar Stock Exchange (QSE) Investor Trading Percentage to Total Value Traded Net Traded Value by Nationality (QR Million) Source: Qatar Stock Exchange (QSE) Source: Qatar Stock Exchange (QSE) 16.3% 14.7% 11.9% 10.1% 9.8% 0.0% 7.0% 14.0% 21.0% Al Khaleej Takaful Insurance Company Qatar National Cement Company Islamic Holding Group Mannai Corporation Ahli Bank -5.9% -3.4% -2.7% -1.0% -0.9% -9.0% -6.0% -3.0% 0.0% Qatari German Company for Medical Devices Doha Bank Alijarah Holding Investment Holding Group Mazaya Qatar Real Estate Development 276.8 245.6 216.4 160.7 147.7 0.0 125.0 250.0 375.0 QNB Group Qatar Islamic Bank Masraf Al Rayan Industries Qatar Mesaieed Petrochemical Holding Company 73.5 72.5 65.1 59.7 46.3 0.0 30.0 60.0 90.0 Salam International Investment Limited Qatar Aluminium Manufacturing Company Ezdan Holding Group Mesaieed Petrochemical Holding Company Gulf International Services 0% 20% 40% 60% 80% 100% Buy Sell 37.95% 49.97% 23.20% 26.88% 12.97% 12.71% 25.89% 10.44% Qatari Individuals Qatari Institutions Non-Qatari Individuals Non-Qatari Institutions 1,789 1,137 2,249 677 -459 460 -1,000 -500 0 500 1,000 1,500 2,000 2,500 Qatari Non-Qatari Net Investment Total Sold Total Bought
- 5. qnbfs.com Page 5 of 7 TECHNICAL ANALYSIS OF THE QSE INDEX Source: Bloomberg The QE Index managed to regain momentum against last week’s stall signal, and closed higher by 1.2% from the previous week. The Index printed last 12,654.78. Thesis has not changed for the Index as the trend remains up and corrections can be used for better entries into the market. Our soft resistance remains around the 12,800 points then a hard resistance level at 13,000 points. We moved our weekly support level to the 11,800 points. DEFINITIONS OF KEY TERMS USED IN TECHNICAL ANALYSIS RSI (Relative Strength Index) indicator – RSI is a momentum oscillator that measures the speedand change of price movements. The RSI oscillates between 0 to 100. The index is deemed to be overbought once the RSI approaches the 70 level, indicating that a correction is likely. On the other hand, if the RSI approaches 30, it is an indication that the index may be getting oversold and therefore likely to bounce back. MACD (Moving Average Convergence Divergence) indicator – The indicator consists of the MACD line and a signal line. The divergence or the convergence of the MACD line with the signal line indicates the strength in the momentum during the uptrend or downtrend, as the case may be. When the MACD crosses the signal line from below and trades above it, it gives a positive indication. The reverse is the situation for a bearish trend. Candlestick chart – A candlestick chart is a price chart that displays the high, low, open, and close for a security. The ‘body’ of the chart is portion between the open and close price, while the high and low intraday movements form the ‘shadow’. The candlestick may represent any time frame. We use a one-day candlestick chart (every candlestick represents one trading day) in our analysis. Doji candlestick pattern – A Doji candlestick is formed when a security's open and close are practically equal. The pattern indicates indecisiveness, and based on preceding price actions and future confirmation, may indicate a bullish or bearish trend reversal. ShootingStar/Inverted Hammer candlestick patterns – These candlestick patterns have a small real body (open price and close price are near to each other), and a long upper shadow (large intraday movement on the upside). The Shooting Star is a bearish reversal pattern that forms after a rally. The Inverted Hammer looks exactly like a Shooting Star, but forms after a downtrend. Inverted Hammers represent a potential bullish trend reversal.
- 6. qnbfs.com Page 6 of 7 Source: Bloomberg Com pan y Nam e P rice Fe bruary 03 % Ch an ge WTD % Ch an ge YTD Marke t Cap. QR Million TTM P /E P /B Div. Yie ld Qatar National Bank 21.80 (0.37) 7.97 201,354 16.5 2.6 2.1 Qatar Islamic Bank 20.16 2.86 9.98 47,637 14.2 2.3 2.0 Commercial Bank of Qatar 7.12 (0.14) 5.56 28,833 14.0 1.6 1.4 Doha Bank 2.94 (3.35) (8.13) 9,115 14.5 0.9 2.6 Al Ahli Bank 4.50 9.76 17.49 10,933 15.3 1.7 3.3 Qatar International Islamic Bank 10.28 2.91 11.62 15,561 17.2 2.4 3.2 Masraf Al Rayan 5.02 (0.26) 8.10 46,649 22.4 1.9 3.4 Qatar First Bank 1.79 (0.67) (0.06) 1,252 10.6 2.3 N/A National Leasing 0.89 (2.73) (5.32) 440 N/A 0.7 2.8 Dlala Holding 1.37 6.14 10.62 388 25.1 1.7 N/A Qatar & Oman Investment 0.82 0.00 0.25 257 45.5 0.9 N/A Islamic Holding Group 4.03 11.91 2.15 228 40.3 1.6 1.2 Ban kin g an d Fin an cial Se rvice s 362,648 Zad Holding 17.20 3.61 2.99 4,484 23.2 3.0 3.7 Qatar German Co. for Medical Devices 2.66 (5.91) (16.32) 307 100.8 9.3 N/A Salam International Investment 0.85 (0.35) 3.79 972 N/A 0.6 N/A Baladna 1.51 0.67 4.15 2,861 N/A 1.3 3.5 Medicare Group 8.64 2.31 1.61 2,430 27.0 2.4 20.8 Qatar Cinema & Film Distribution 3.68 1.60 3.61 231 75.2 1.7 2.7 Qatar Fuel 19.50 2.58 6.67 19,388 20.0 2.1 2.4 Qatar Meat and Livestock 3.58 1.79 (0.47) 644 N/A 2.0 2.8 Mannai Corp. 8.70 10.06 83.13 3,967 9.9 1.9 0.1 Al Meera Consumer Goods 19.75 0.51 0.77 3,950 21.9 2.6 4.6 Con sum e r Goods an d Se rvice s 39,234 Qatar Industrial Manufacturing 3.44 6.74 11.99 1,634 13.4 1.0 2.9 Qatar National Cement 6.50 14.72 27.45 4,248 18.8 1.4 3.1 Industries Qatar 16.77 (0.06) 8.26 101,459 15.3 2.7 2.0 Qatari Investors Group 2.28 4.11 2.70 2,835 20.6 1.0 2.6 Qatar Electricity and Water 18.05 3.74 8.73 19,855 15.1 1.8 3.5 Aamal 1.10 3.77 1.48 6,930 28.8 0.9 3.6 Gulf International Services 1.76 (0.79) 2.62 3,273 N/A 1.0 N/A Mesaieed Petrochemical Holding 2.54 5.62 21.29 31,848 19.4 1.9 1.6 Invesment Holding Group 1.27 (1.01) 3.25 1,053 53.0 1.2 N/A Qatar Aluminum Manufacturing 2.02 3.32 12.33 11,289 18.7 1.9 1.7 In dustrials 184,422 Qatar Insurance 2.62 1.40 (4.87) 8,544 16.1 1.0 N/A QLM Life & Medical Insurance 5.15 1.98 1.98 1,803 N/A 3.0 N/A Doha Insurance 1.87 (0.64) (2.45) 937 13.3 0.8 5.3 Qatar General Insurance & Reinsurance 2.14 7.00 7.00 1,873 14.5 0.4 N/A Al Khaleej Takaful Insurance 3.87 16.31 7.58 989 20.3 1.9 1.3 Qatar Islamic Insurance 8.30 0.73 3.75 1,245 16.1 3.1 3.9 In suran ce 15,389 United Development 1.74 5.71 12.99 6,161 17.3 0.6 2.9 Barwa Real Estate 3.48 0.93 13.69 13,538 11.0 0.7 3.6 Ezdan Real Estate 1.46 0.34 8.87 38,726 100.7 1.2 N/A Mazaya Qatar Real Estate Development 0.90 (0.88) (1.96) 1,044 34.0 0.8 3.3 Re al Estate 59,469 Ooredoo 7.30 0.69 3.99 23,383 N/A 1.1 3.4 Vodafone Qatar 1.78 0.28 6.48 7,503 22.8 1.6 2.8 Te le com s 30,886 Qatar Navigation (Milaha) 8.70 (0.32) 13.93 9,887 30.2 0.7 3.4 Gulf Warehousing 4.73 4.88 4.23 277 12.3 1.3 2.1 Qatar Gas Transport (Nakilat) 3.64 1.14 10.30 20,167 15.8 2.5 3.0 Tran sportation 30,331 Qatar Exch an ge 724,874
- 7. qnbfs.com Contacts QNB Financial Services Co. W.L.L. Contact Center: (+974) 4476 6666 info@qnbfs.com.qa Doha, Qatar Saugata Sarkar, CFA, CAIA Head of Research saugata.sarkar@qnbfs.com.qa Shahan Keushgerian Senior Research Analyst shahan.keushgerian@qnbfs.com.qa . Disclaimer and Copyright Notice: This publication has been prepared by QNB Financial Services Co. W.L.L. (“QNBFS”) a wholly-owned subsidiary of Qatar National Bank (Q.P.S.C.). QNB FS is regulated by the Qatar Financial Markets Authority and the Qatar Exchange. Qatar National Bank (Q.P.S.C.) is regulated by the Qatar Central Bank. This publication expresses the views and opinions of QNBFS at a given time only. It is not an offer, promotion or recommendation to buy or sell securities or other investments, nor is it intended to constitute legal, tax, accounting, or financial advice. QNBFS accepts no liability whatsoever for any direct or indirect losses arising from use of this report. Any investment decision should depend on the individual circumstances of the investor and be based on specifically engaged investment advice. We therefore strongly advise potential investors to seek independent professional advice before making any investment decision. Although the information in this report has been obtained from sources that QNBFS believes to be reliable, we have not independently verified such information and it may not be accurate or complete. QNBFS does not make any representations or warranties as to the accuracy and completeness of the information it may contain, and declines any liability in that respect. For reports dealing with Technical Analysis, expressed opinions and/or recommendations may be different or contrary to the opinions/recommendations of QNBFS Fundamental Research as a result of depending solely on the historical technical data (price and volume). QNBFS reserves the right to amend the views and opinions expressed in this publication at any time. It may also express viewpoints or make investment decisions that differ significantly from, or even contradict, the views and opinions included in this report. This report may not be reproduced in whole or in part without permission from QNBFS. COPYRIGHT: No part of this document may be reproduced without the explicit written permission of QNBFS. Page 7 of 7