Download as PDF, PPTX


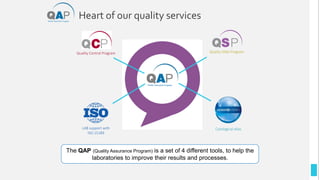

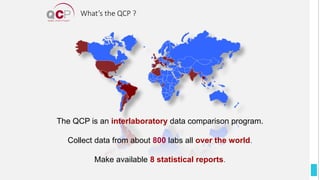
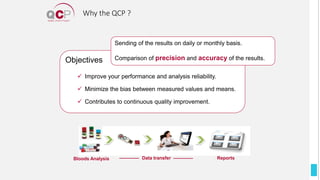
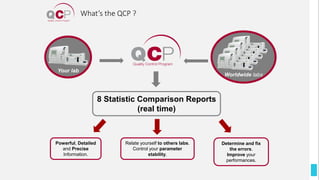


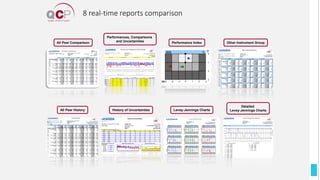
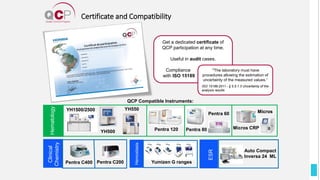

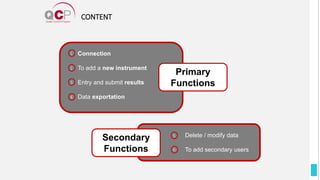


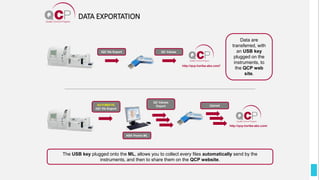

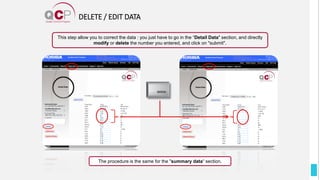
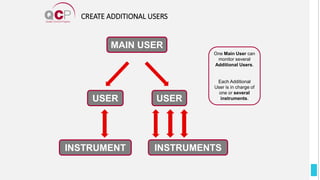
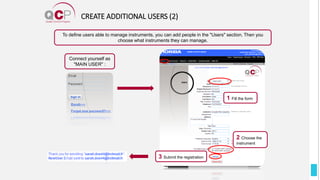


The Quality Control Program (QCP) provides laboratories with statistical reports and tools to improve quality and compare performance to peer groups. It collects data from 800 labs worldwide. The QCP includes 8 statistical comparison reports that provide indicators of precision, accuracy, and uncertainty to help laboratories evaluate their results over time, identify errors, and improve performance relative to international standards. Primary users can enroll laboratories and instruments and enter quality control data either manually or via automatic daily uploads from certain instruments. Secondary users can be added to manage specific instruments.


