Download as PDF, PPTX


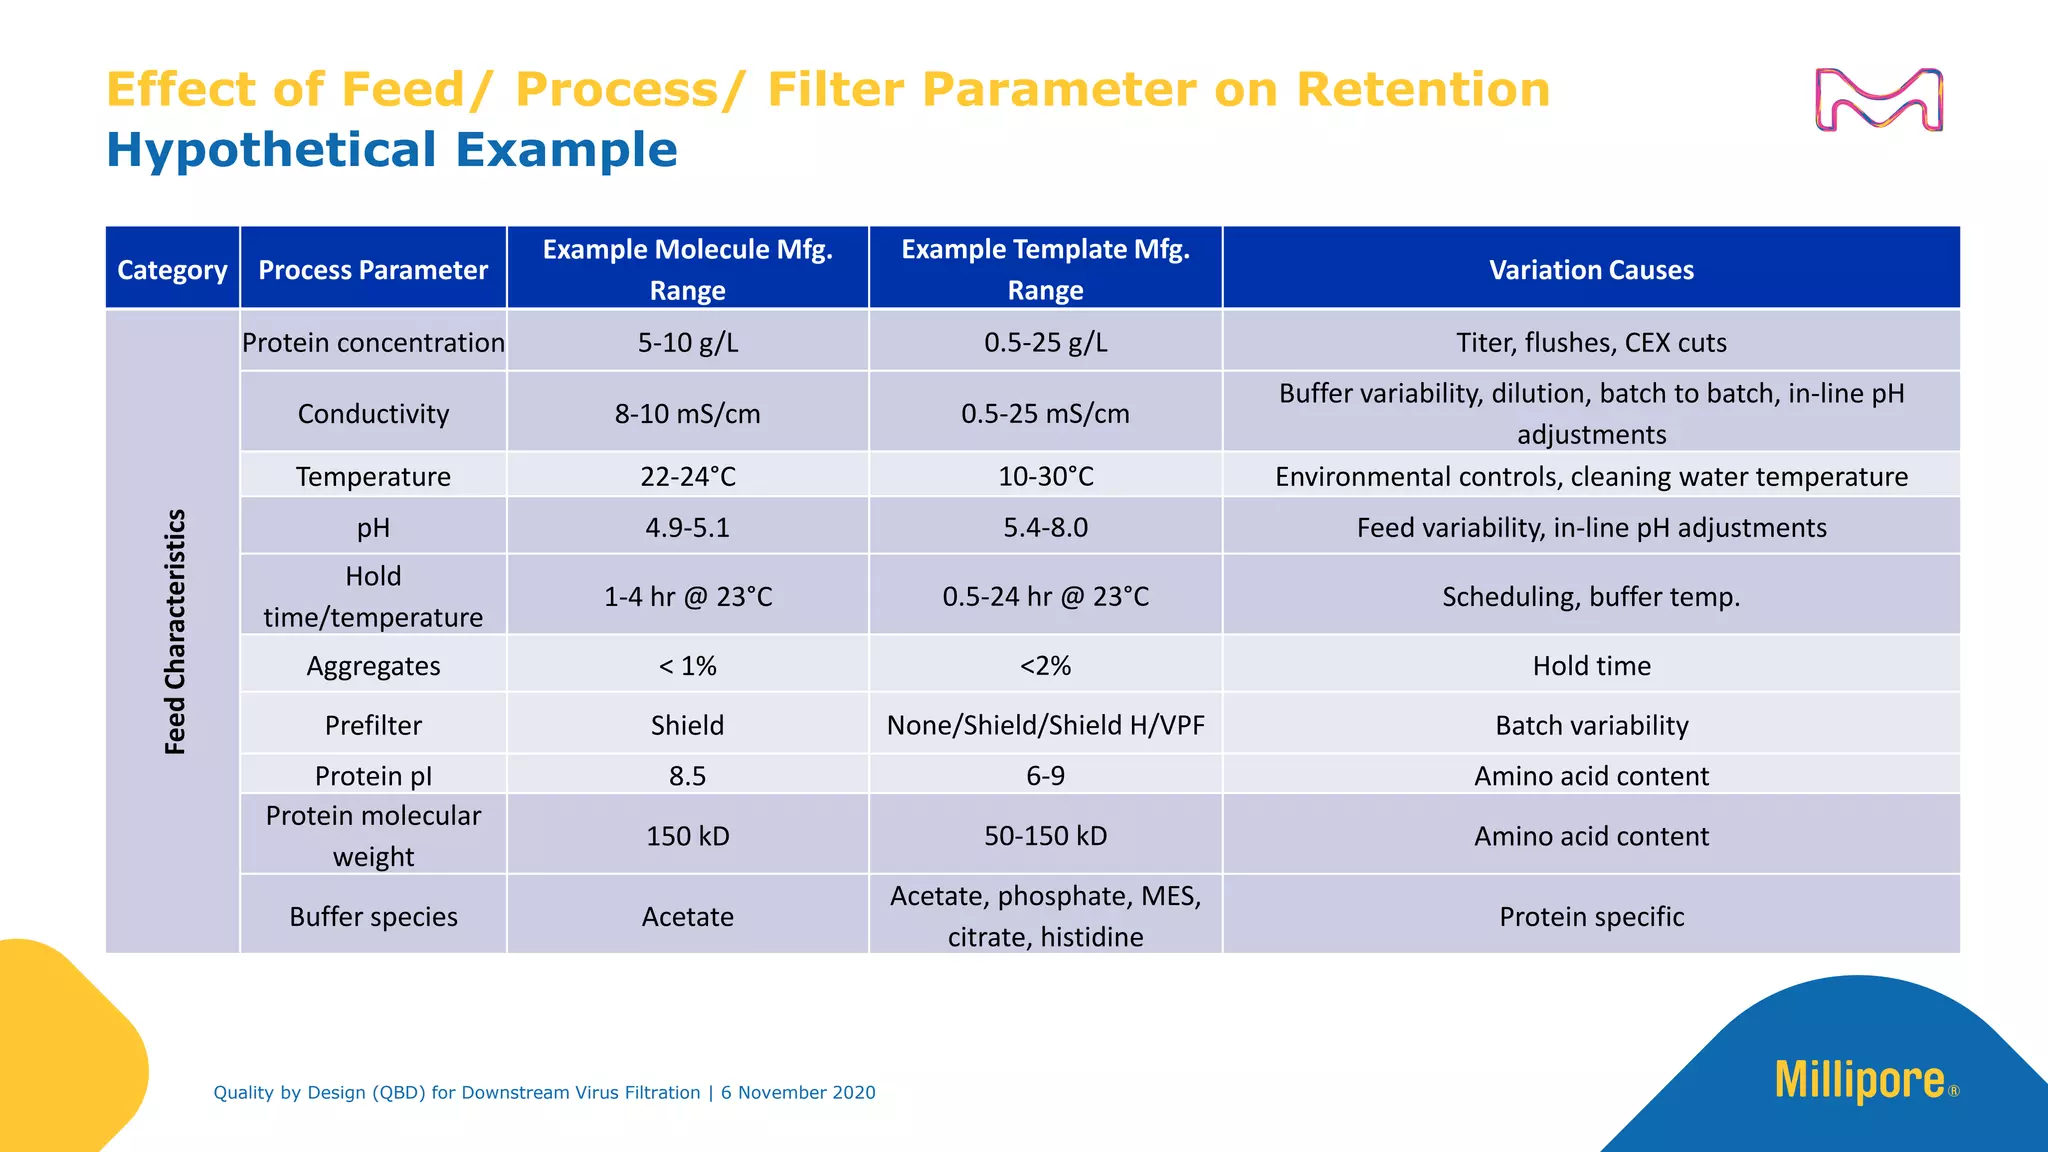


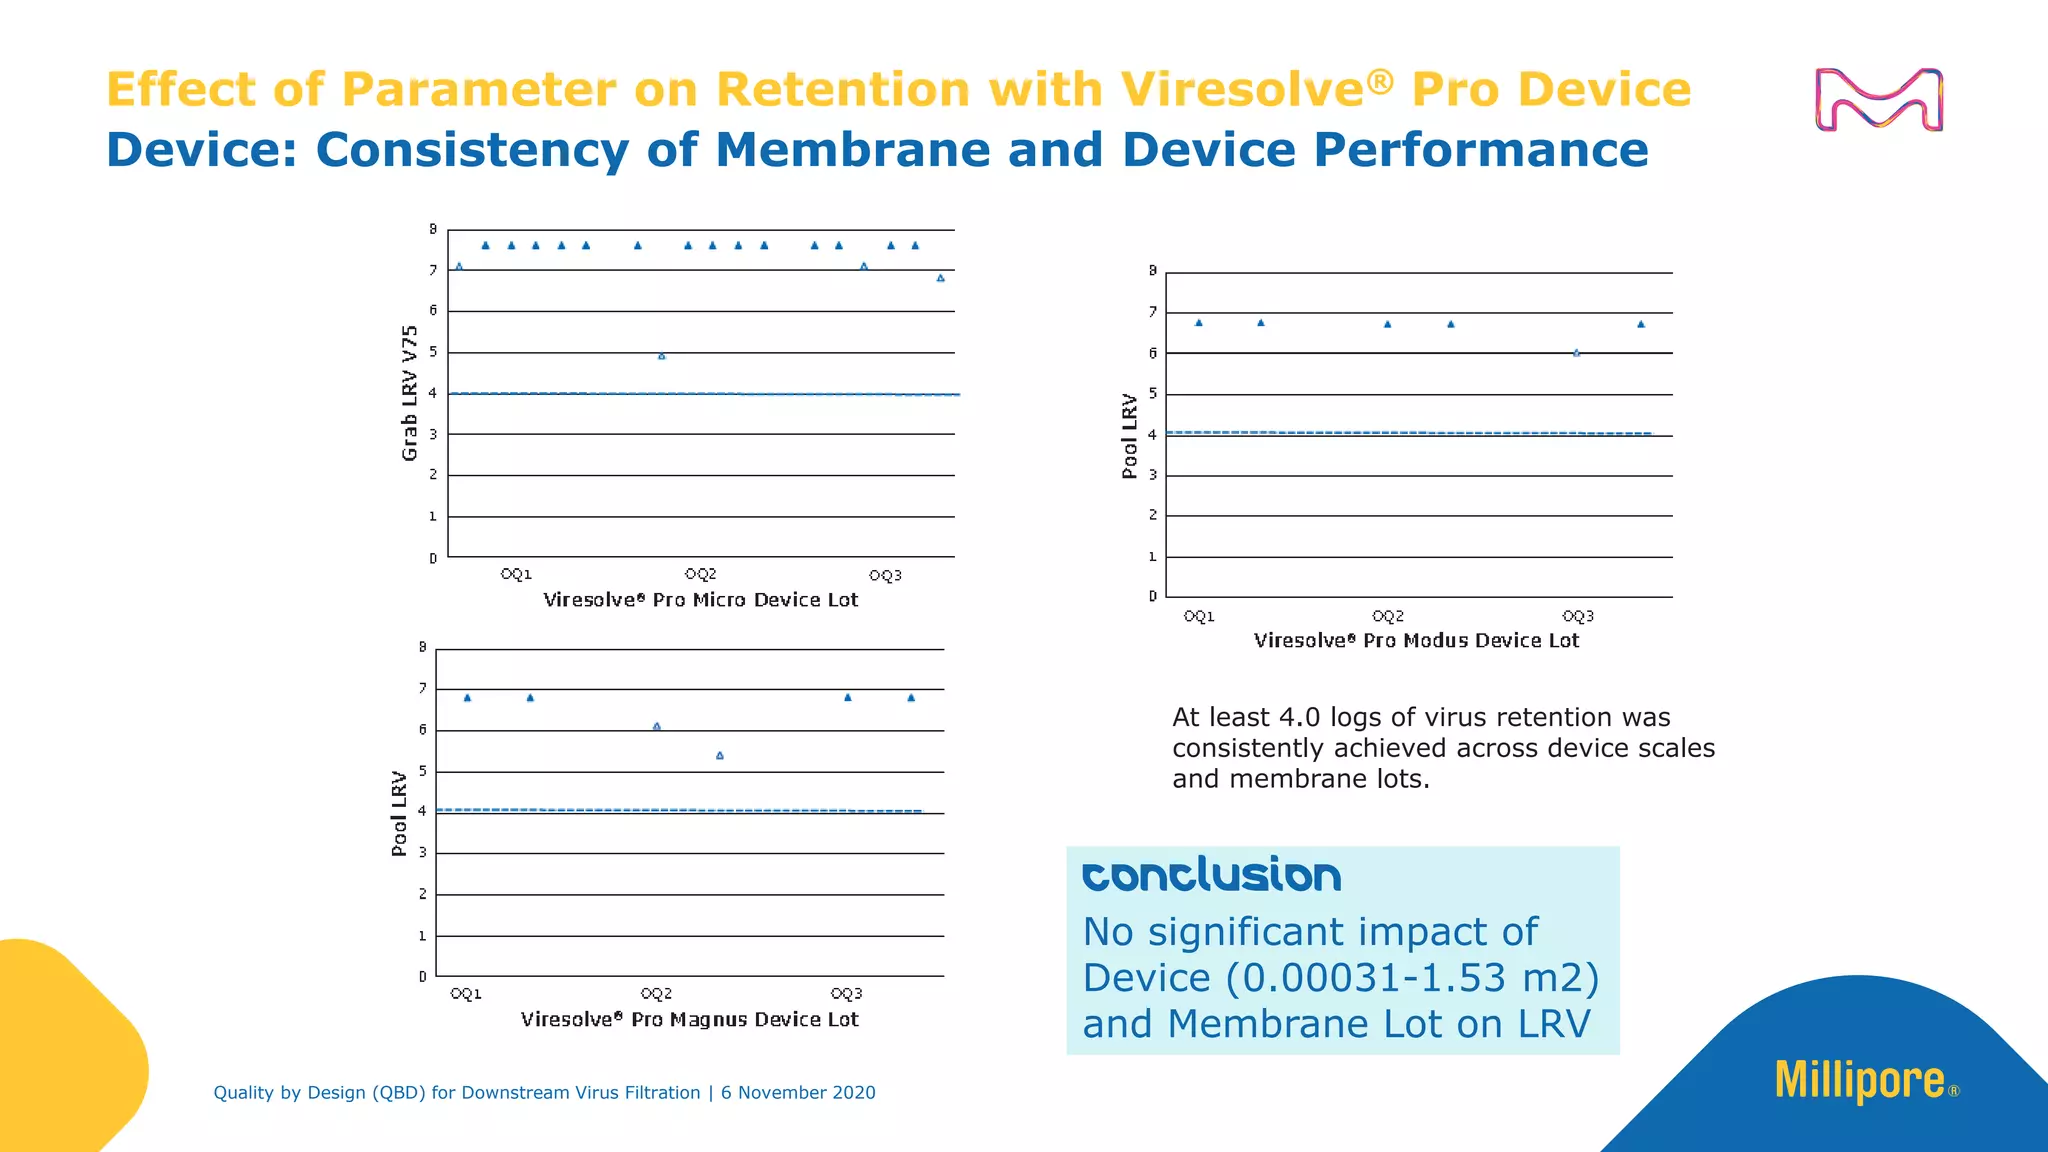
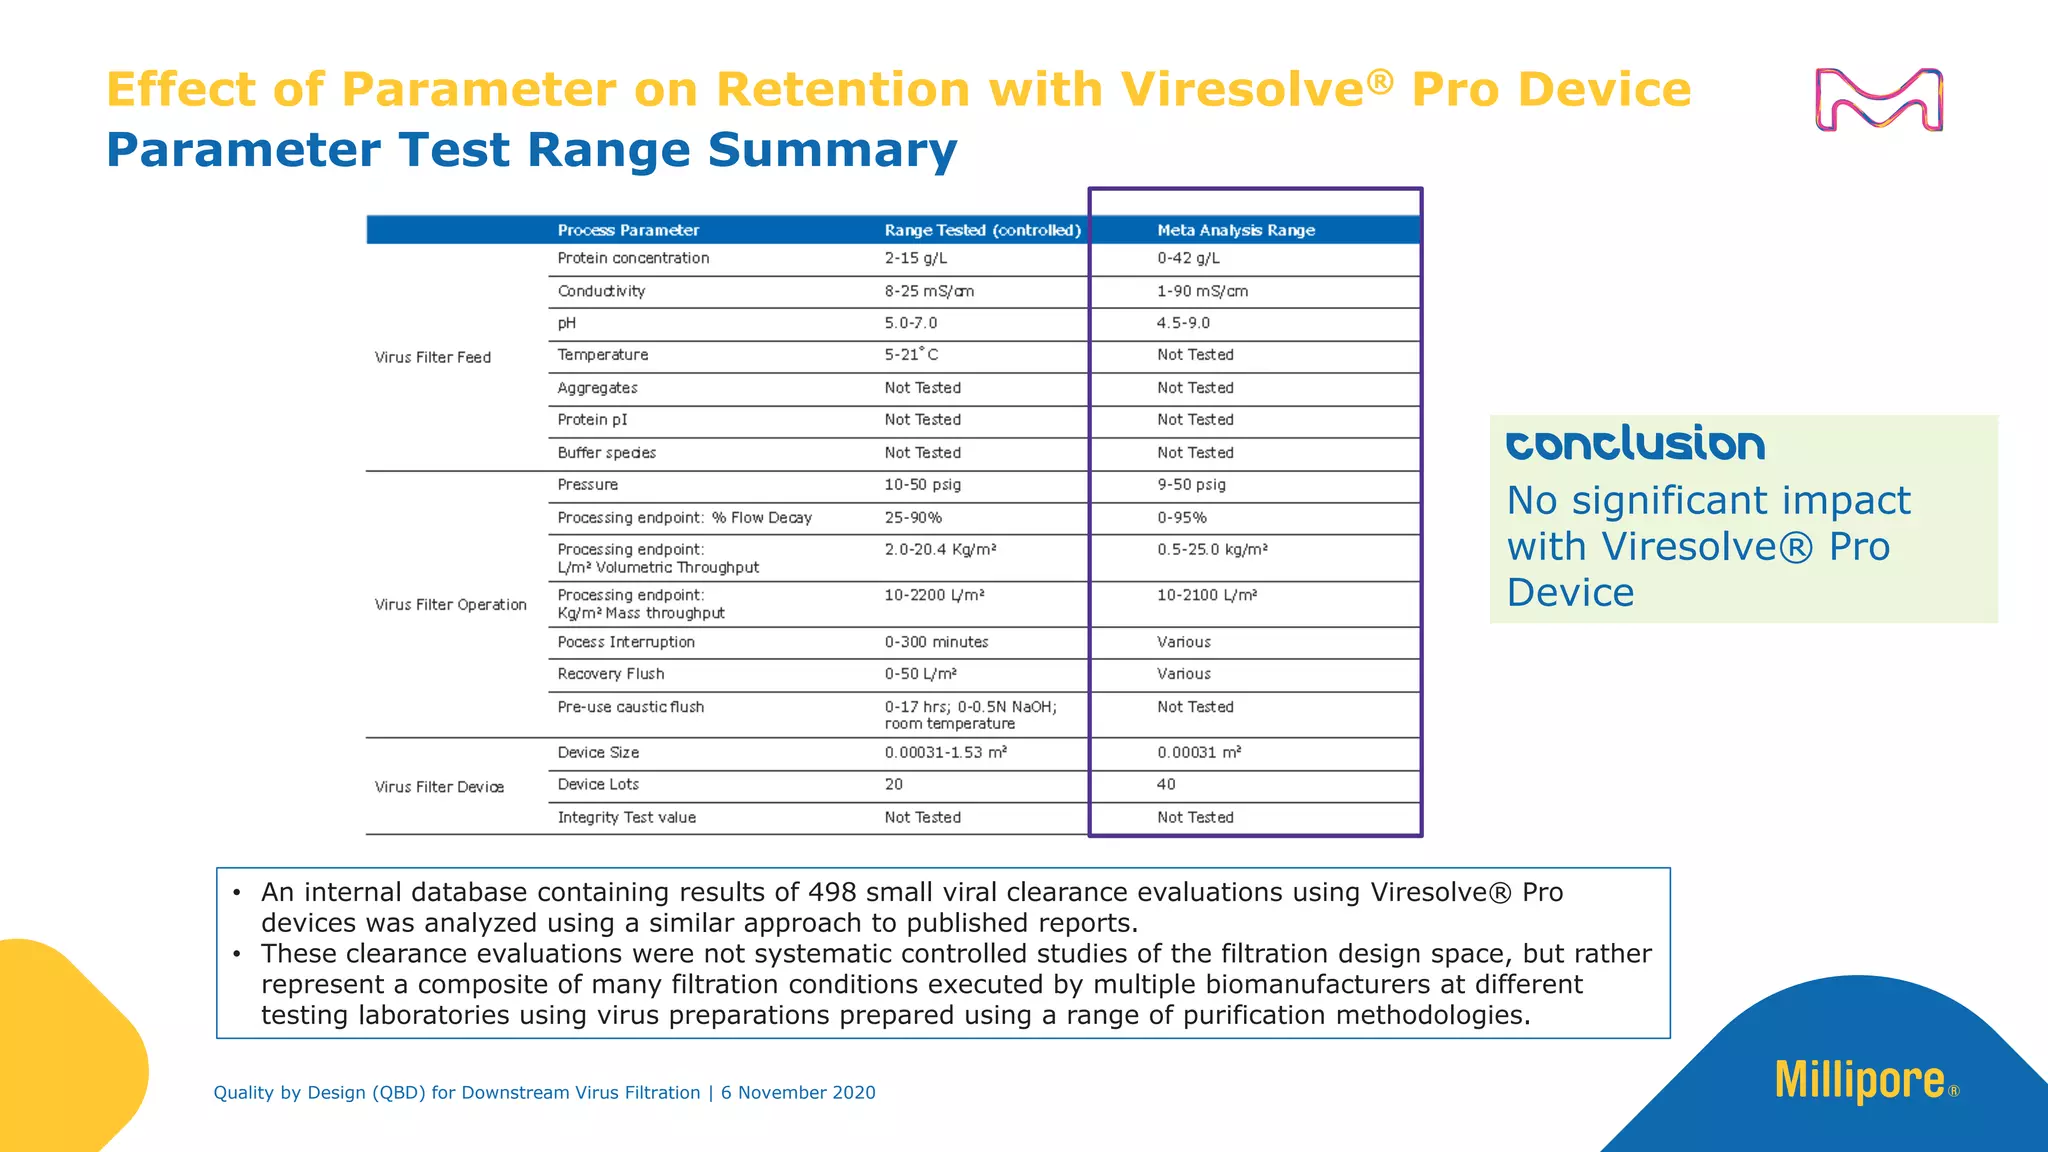


The document discusses the application of Quality by Design (QbD) principles in downstream virus filtration by Merck KGaA's life science division, operating as MilliporeSigma in North America. It emphasizes the importance of identifying critical quality attributes and controlling process parameters to ensure robust and consistent viral filtration processes, ultimately leading to regulatory compliance and improved product quality. The document outlines methodologies for risk assessment and process optimization in virus filtration, supported by various case studies and evaluations.


![Biotech2007[1]](https://cdn.slidesharecdn.com/ss_thumbnails/biotech20071-12731379674691-phpapp02-thumbnail.jpg?width=640&height=640&fit=bounds)


![Back To Basics GMPs[1]](https://cdn.slidesharecdn.com/ss_thumbnails/a9b29f4b-1869-4392-8cbd-d144ef2e7c57-160216213515-thumbnail.jpg?width=640&height=640&fit=bounds)


