LEARNING COMPETENCIES
Cristine E.Simbul
Uses common productivity tools effectively by maximizing
advanced application techniques CS_ICT11/12-ICTPT-Ic-d4
Creates an original or derivative ICT content to effectively
communicate or present data or information related to specific
professional tracks CS_ICT11/12-ICTPT-Ic-d5
3.
COMMON PRODUCTIVITY TOOLS
HarveyTabamo
Office productivity tools are
applications that allow for the
viewing, creating and modifying of
general office documents (e.g.
spreadsheets, memos, presentations,
letters, personal database, form
generation, image editing, etc.).
Office productivity tools also include
applications for managing employee
tasks.
4.
COMMON PRODUCTIVITY TOOLS
HarveyTabamo
Three basic functions of digital tools
are generally combined to support
decisions in business or management,
and in communication contexts.
These 3 basic tools support writing,
numeracy and presentation skills.
In earlier ICT-related courses or
academic subjects, these tools find
expression in essays, book reports,
and newsletters, as well as in
presentation of ideas contained in a
deck of digital slides.
5.
COMMON PRODUCTIVITY TOOLS
HarveyTabamo
Microsoft Office is the commercial
giant of productivity software.
Experience with the suite is useful to
anybody.
Literally millions of users work with
its programs and related file formats.
Learning how to use the MS Office
suite helps you with everyday tasks,
as well as at work.
6.
THREE BASIC TOOLS
HarveyTabamo
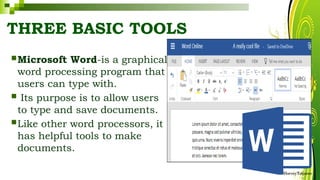
MicrosoftWord-is a graphical
word processing program that
users can type with.
Its purpose is to allow users
to type and save documents.
Like other word processors, it
has helpful tools to make
documents.
7.
THREE BASIC TOOLS
HarveyTabamo
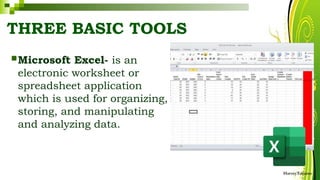
MicrosoftExcel- is an
electronic worksheet or
spreadsheet application
which is used for organizing,
storing, and manipulating
and analyzing data.
8.
THREE BASIC TOOLS
HarveyTabamo
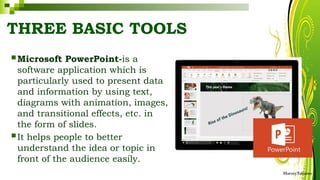
Microsoft PowerPoint-is a
software application which is
particularly used to present data
and information by using text,
diagrams with animation, images,
and transitional effects, etc. in
the form of slides.
It helps people to better
understand the idea or topic in
front of the audience easily.
9.
INTEGRATING IMAGES ANDEXTERNAL
MATERIALS
• Integrating or inserting
pictures in your
document is fun and it
improves the impression
of your document.
• Let us consider the
interesting aspects of
inserting or integrating
images and other external
materials. HarveyTabamo
10.
KINDS OF MATERIALS
•There are various kinds of materials
Microsoft Word is capable of integrating to
make your documents richer, more impressive
and more informative.
HarveyTabamo
11.
1. PICTURES
• Generally,these
electronic or digital
pictures or
photographs you
have saved on any
local storage device.
There are three
common files used
and you can identify
them by the
extension on their
file name. HarveyTabamo
12.
A. .JPG –this is pronounced as
“jay.peg” and is short form for
Joint Photographic Experts Group.
-Like all the rest of the image file
extensions, it identifies the kind
of date compression process that
it uses to make it more
compatible and portable through
the internet.
- It can support 16.7 million colors
HarveyTabamo
1. PICTURES
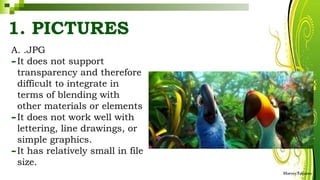
13.
A. .JPG
-It doesnot support
transparency and therefore
difficult to integrate in
terms of blending with
other materials or elements
-It does not work well with
lettering, line drawings, or
simple graphics.
-It has relatively small in file
size.
HarveyTabamo
1. PICTURES
14.
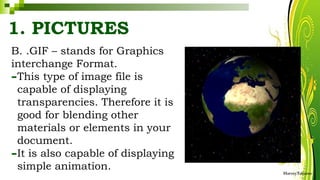
B. .GIF –stands for Graphics
interchange Format.
-This type of image file is
capable of displaying
transparencies. Therefore it is
good for blending other
materials or elements in your
document.
-It is also capable of displaying
simple animation. HarveyTabamo
1. PICTURES
15.
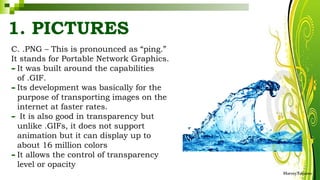
C. .PNG –This is pronounced as “ping.”
It stands for Portable Network Graphics.
-It was built around the capabilities
of .GIF.
-Its development was basically for the
purpose of transporting images on the
internet at faster rates.
- It is also good in transparency but
unlike .GIFs, it does not support
animation but it can display up to
about 16 million colors
-It allows the control of transparency
level or opacity
HarveyTabamo
1. PICTURES
16.
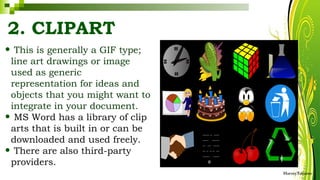
2. CLIPART
• Thisis generally a GIF type;
line art drawings or image
used as generic
representation for ideas and
objects that you might want to
integrate in your document.
• MS Word has a library of clip
arts that is built in or can be
downloaded and used freely.
• There are also third-party
providers.
HarveyTabamo
17.
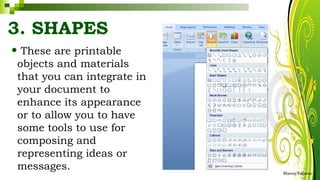
3. SHAPES
• Theseare printable
objects and materials
that you can integrate in
your document to
enhance its appearance
or to allow you to have
some tools to use for
composing and
representing ideas or
messages. HarveyTabamo
18.
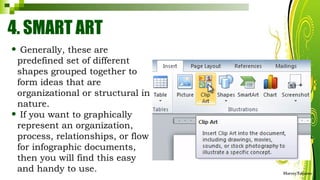
4. SMART ART
•Generally, these are
predefined set of different
shapes grouped together to
form ideas that are
organizational or structural in
nature.
• If you want to graphically
represent an organization,
process, relationships, or flow
for infographic documents,
then you will find this easy
and handy to use. HarveyTabamo
19.
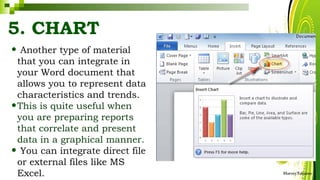
5. CHART
• Anothertype of material
that you can integrate in
your Word document that
allows you to represent data
characteristics and trends.
•This is quite useful when
you are preparing reports
that correlate and present
data in a graphical manner.
• You can integrate direct file
or external files like MS
Excel. HarveyTabamo
20.
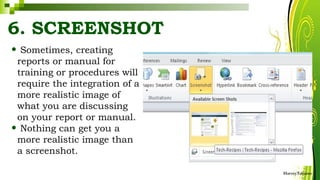
6. SCREENSHOT
• Sometimes,creating
reports or manual for
training or procedures will
require the integration of a
more realistic image of
what you are discussing
on your report or manual.
• Nothing can get you a
more realistic image than
a screenshot.
HarveyTabamo
21.
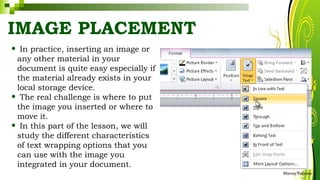
IMAGE PLACEMENT
• Inpractice, inserting an image or
any other material in your
document is quite easy especially if
the material already exists in your
local storage device.
• The real challenge is where to put
the image you inserted or where to
move it.
• In this part of the lesson, we will
study the different characteristics
of text wrapping options that you
can use with the image you
integrated in your document.
HarveyTabamo
22.
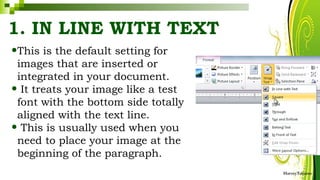
1. IN LINEWITH TEXT
•This is the default setting for
images that are inserted or
integrated in your document.
• It treats your image like a test
font with the bottom side totally
aligned with the text line.
• This is usually used when you
need to place your image at the
beginning of the paragraph.
HarveyTabamo
23.
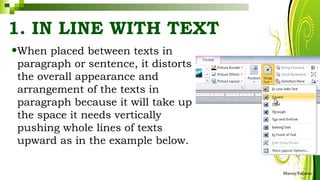
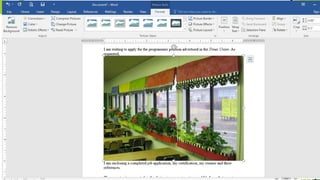
1. IN LINEWITH TEXT
•When placed between texts in
paragraph or sentence, it distorts
the overall appearance and
arrangement of the texts in
paragraph because it will take up
the space it needs vertically
pushing whole lines of texts
upward as in the example below.
HarveyTabamo
2. SQUARE
•This settingallows the
image you inserted to be
placed anywhere within
the paragraphs with the
text going around the
image in a square
pattern like a frame
HarveyTabamo
3. TIGHT
•This isalmost the same as the
Square setting, but here the text
“hugs” or conforms to the
general shape of the image.
• This allows you to get a more
creative effect on your
document.
• This setting can mostly be
achieved if you are using an
image that supports
transparency like a .GIF or .PNG HarveyTabamo
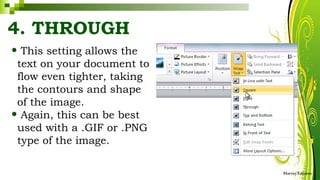
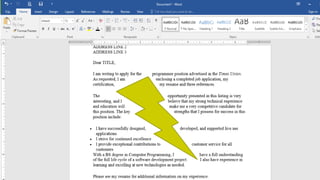
4. THROUGH
• Thissetting allows the
text on your document to
flow even tighter, taking
the contours and shape
of the image.
• Again, this can be best
used with a .GIF or .PNG
type of the image.
HarveyTabamo
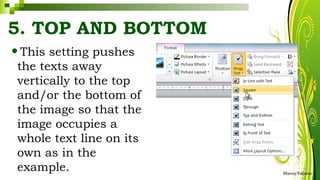
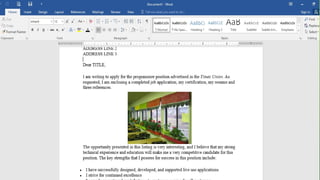
5. TOP ANDBOTTOM
•This setting pushes
the texts away
vertically to the top
and/or the bottom of
the image so that the
image occupies a
whole text line on its
own as in the
example. HarveyTabamo
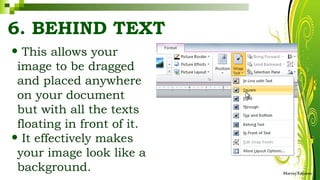
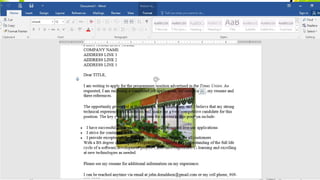
6. BEHIND TEXT
•This allows your
image to be dragged
and placed anywhere
on your document
but with all the texts
floating in front of it.
• It effectively makes
your image look like a
background. HarveyTabamo
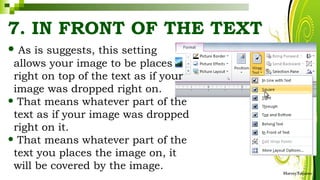
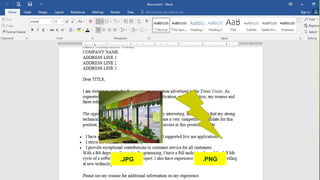
7. IN FRONTOF THE TEXT
• As is suggests, this setting
allows your image to be places
right on top of the text as if your
image was dropped right on.
• That means whatever part of the
text as if your image was dropped
right on it.
• That means whatever part of the
text you places the image on, it
will be covered by the image.
HarveyTabamo
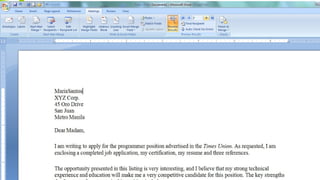
MAIL MERGE ANDLABEL
GENERATION
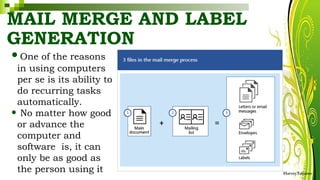
•One of the reasons
in using computers
per se is its ability to
do recurring tasks
automatically.
• No matter how good
or advance the
computer and
software is, it can
only be as good as
the person using it HarveyTabamo
38.
MAIL MERGE
•As thename suggests,
this feature allows you to
create documents and
combine or merge theme
with another document or
data file.
• It is commonly used
when sending out
advertising materials to
various recipient. HarveyTabamo
39.
MAIL MERGE
• Thesimplest solution for the
scenario above is to create a
document and just copy and
paste it several times then just
replace the details depending on
whom you sent it to.
• It has two component: Form
Document and List or Data File
HarveyTabamo
40.
1. FORM DOCUMENT
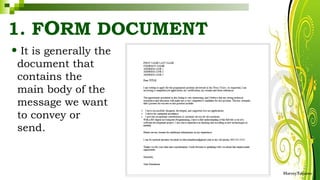
•It is generally the
document that
contains the
main body of the
message we want
to convey or
send.
HarveyTabamo
41.
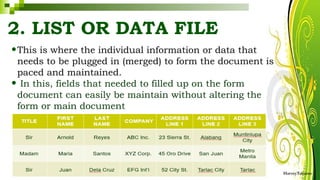
2. LIST ORDATA FILE
•This is where the individual information or data that
needs to be plugged in (merged) to form the document is
paced and maintained.
• In this, fields that needed to filled up on the form
document can easily be maintain without altering the
form or main document
HarveyTabamo
42.
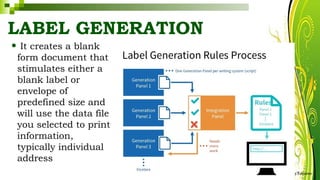
LABEL GENERATION
• Itcreates a blank
form document that
stimulates either a
blank label or
envelope of
predefined size and
will use the data file
you selected to print
information,
typically individual
address
HarveyTabamo
43.
STEPS IN CREATING
MAILMERGE
HarveyTabamo
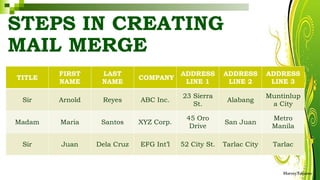
TITLE
FIRST
NAME
LAST
NAME
COMPANY
ADDRESS
LINE 1
ADDRESS
LINE 2
ADDRESS
LINE 3
Sir Arnold Reyes ABC Inc.
23 Sierra
St.
Alabang
Muntinlup
a City
Madam Maria Santos XYZ Corp.
45 Oro
Drive
San Juan
Metro
Manila
Sir Juan Dela Cruz EFG Int’l 52 City St. Tarlac City Tarlac
44.
STEPS IN CREATING
MAILMERGE
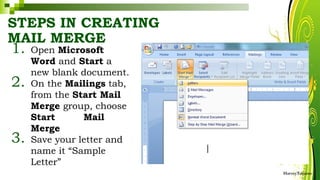
1. Open Microsoft
Word and Start a
new blank document.
2. On the Mailings tab,
from the Start Mail
Merge group, choose
Start Mail
Merge
3. Save your letter and
name it “Sample
Letter”
HarveyTabamo
45.
STEPS IN CREATINGMAIL MERGE
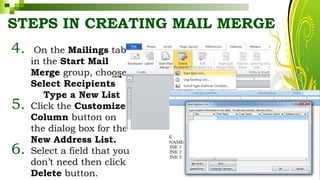
4. On the Mailings tab
in the Start Mail
Merge group, choose
Select Recipients
Type a New List
5. Click the Customize
Column button on
the dialog box for the
New Address List.
6. Select a field that you
don’t need then click
Delete button. HarveyTabamo
46.
STEPS IN CREATINGMAIL
MERGE
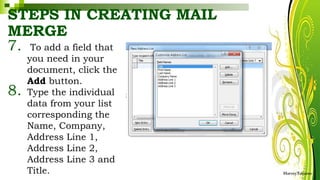
7. To add a field that
you need in your
document, click the
Add button.
8. Type the individual
data from your list
corresponding the
Name, Company,
Address Line 1,
Address Line 2,
Address Line 3 and
Title. HarveyTabamo
STEPS IN CREATINGMAIL MERGE
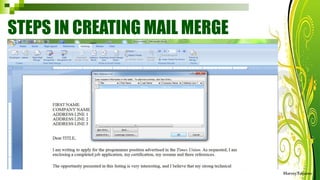
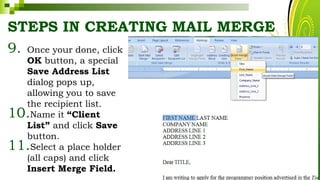
9. Once your done, click
OK button, a special
Save Address List
dialog pops up,
allowing you to save
the recipient list.
10.Name it “Client
List” and click Save
button.
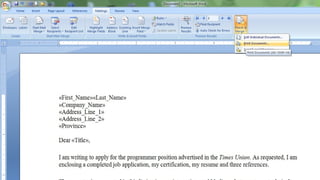
11.Select a place holder
(all caps) and click
Insert Merge Field. HarveyTabamo
49.
STEPS IN CREATINGMAIL
MERGE
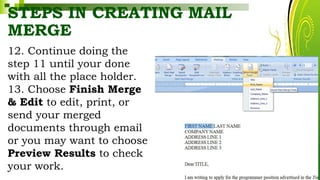
12. Continue doing the
step 11 until your done
with all the place holder.
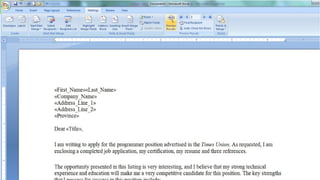
13. Choose Finish Merge
& Edit to edit, print, or
send your merged
documents through email
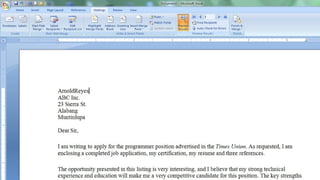
or you may want to choose
Preview Results to check
your work. HarveyTabamo
OBJECTIVES
At the endof this lesson, you should be able
to:
• use common productivity tools effectively
by maximizing advanced application
techniques.
• creates an original or derivative ICT
content to effectively communicate or
present data or information related to
specific professional tracks. HarveyTabamo
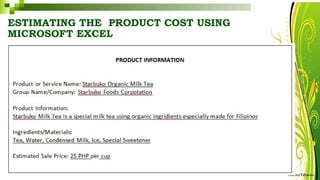
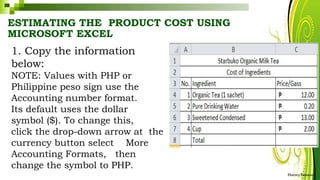
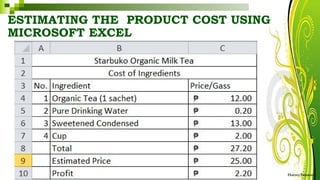
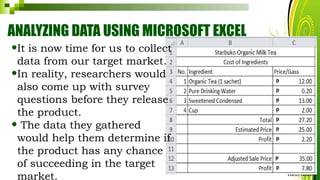
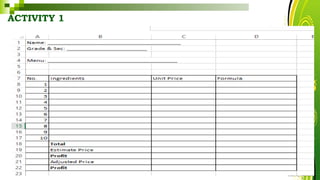
ESTIMATING THE PRODUCTCOST USING
MICROSOFT EXCEL
1. Copy the information
below:
NOTE: Values with PHP or
Philippine peso sign use the
Accounting number format.
Its default uses the dollar
symbol ($). To change this,
click the drop-down arrow at the
currency button select More
Accounting Formats, then
change the symbol to PHP.
HarveyTabamo
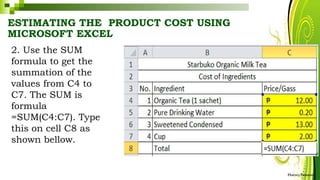
58.
ESTIMATING THE PRODUCTCOST USING
MICROSOFT EXCEL
2. Use the SUM
formula to get the
summation of the
values from C4 to
C7. The SUM is
formula
=SUM(C4:C7). Type
this on cell C8 as
shown bellow.
HarveyTabamo
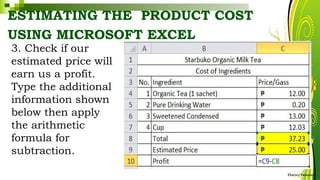
ESTIMATING THE PRODUCTCOST
USING MICROSOFT EXCEL
3. Check if our
estimated price will
earn us a profit.
Type the additional
information shown
below then apply
the arithmetic
formula for
subtraction.
HarveyTabamo
61.
ESTIMATING THE PRODUCTCOST USING MICROSOFT EXCEL
HarveyTabamo
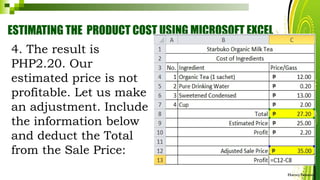
4. The result is
PHP2.20. Our
estimated price is not
profitable. Let us make
an adjustment. Include
the information below
and deduct the Total
from the Sale Price:
62.
ESTIMATING THE PRODUCT
COSTUSING MICROSOFT EXCEL
HarveyTabamo
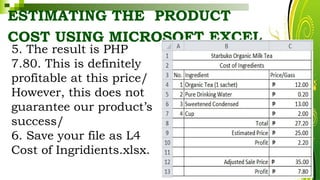
5. The result is PHP
7.80. This is definitely
profitable at this price/
However, this does not
guarantee our product’s
success/
6. Save your file as L4
Cost of Ingridients.xlsx.
63.
ANALYZING DATA USINGMICROSOFT EXCEL
HarveyTabamo
•It is now time for us to collect
data from our target market.
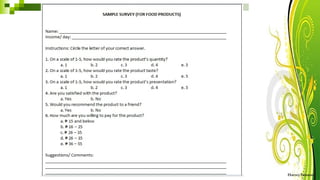
•In reality, researchers would
also come up with survey
questions before they release
the product.
• The data they gathered
would help them determine if
the product has any chance
of succeeding in the target
market.
ANALYZING DATA USINGMICROSOFT
EXCEL
HarveyTabamo
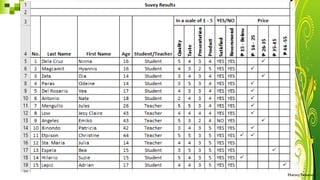
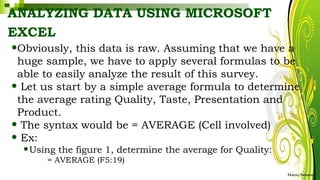
•Obviously, this data is raw. Assuming that we have a
huge sample, we have to apply several formulas to be
able to easily analyze the result of this survey.
• Let us start by a simple average formula to determine
the average rating Quality, Taste, Presentation and
Product.
• The syntax would be = AVERAGE (Cell involved)
• Ex:
•Using the figure 1, determine the average for Quality:
= AVERAGE (F5:19)
67.
ANALYZING DATA USINGMICROSOFT
EXCEL
HarveyTabamo
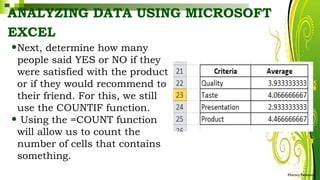
•Next, determine how many
people said YES or NO if they
were satisfied with the product
or if they would recommend to
their friend. For this, we still
use the COUNTIF function.
• Using the =COUNT function
will allow us to count the
number of cells that contains
something.
68.
ANALYZING DATA USINGMICROSOFT
EXCEL
HarveyTabamo
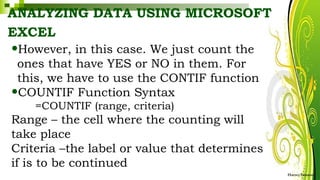
•However, in this case. We just count the
ones that have YES or NO in them. For
this, we have to use the CONTIF function
•COUNTIF Function Syntax
=COUNTIF (range, criteria)
Range – the cell where the counting will
take place
Criteria –the label or value that determines
if is to be continued
69.
ANALYZING DATA USINGMICROSOFT
EXCEL
HarveyTabamo
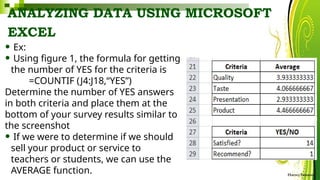
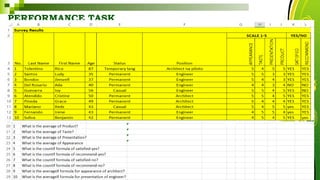
• Ex:
• Using figure 1, the formula for getting
the number of YES for the criteria is
=COUNTIF (J4:J18,“YES”)
Determine the number of YES answers
in both criteria and place them at the
bottom of your survey results similar to
the screenshot
• If we were to determine if we should
sell your product or service to
teachers or students, we can use the
AVERAGE function.
70.
ANALYZING DATA USINGMICROSOFT
EXCEL
HarveyTabamo
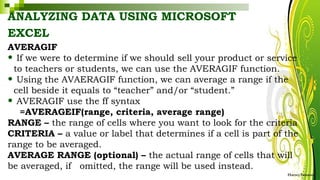
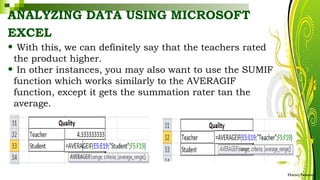
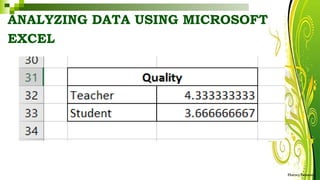
AVERAGIF
• If we were to determine if we should sell your product or service
to teachers or students, we can use the AVERAGIF function.
• Using the AVAERAGIF function, we can average a range if the
cell beside it equals to “teacher” and/or “student.”
• AVERAGIF use the ff syntax
=AVERAGEIF(range, criteria, average range)
RANGE – the range of cells where you want to look for the criteria
CRITERIA – a value or label that determines if a cell is part of the
range to be averaged.
AVERAGE RANGE (optional) – the actual range of cells that will
be averaged, if omitted, the range will be used instead.
71.
ANALYZING DATA USINGMICROSOFT
EXCEL
HarveyTabamo
• With this, we can definitely say that the teachers rated
the product higher.
• In other instances, you may also want to use the SUMIF
function which works similarly to the AVERAGIF
function, except it gets the summation rater tan the
average.
OBJECTIVES
At the endof this lesson, you should be able
to:
• use common productivity tools effectively
by maximizing advanced application
techniques.
• creates an original or derivative ICT
content to effectively communicate or
present data or information related to
specific professional tracks. HarveyTabamo
77.
CREATING AN EFFECTIVE
PRESENTATION
•Designing your presentation is the fun part of
creating a report for it gives you chance to be creative.
• Placing animations, transitions, and art could be your
mind right now.
• But whether or not these features would help is
generally up to you.
• Sometimes, these things could actually distract the
audience rather that help you.
• Here are some quick tips in creating an effective
presentation.
HarveyTabamo
78.
1. MINIMIZE
• Keepslide counts to
minimum to maintain a
clear message and to
keep the audience
attentive.
• Remember that the
presentation is just
visual aid.
• Most information
should still come from
the information. HarveyTabamo
79.
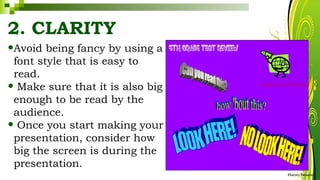
2. CLARITY
•Avoid beingfancy by using a
font style that is easy to
read.
• Make sure that it is also big
enough to be read by the
audience.
• Once you start making your
presentation, consider how
big the screen is during the
presentation.
HarveyTabamo
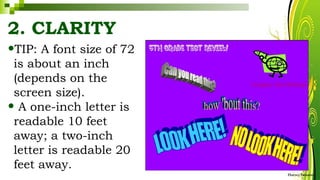
80.
2. CLARITY
•TIP: Afont size of 72
is about an inch
(depends on the
screen size).
• A one-inch letter is
readable 10 feet
away; a two-inch
letter is readable 20
feet away.
HarveyTabamo
81.
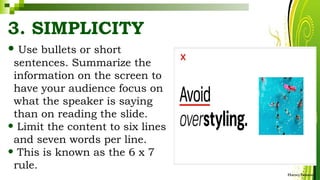
3. SIMPLICITY
• Usebullets or short
sentences. Summarize the
information on the screen to
have your audience focus on
what the speaker is saying
than on reading the slide.
• Limit the content to six lines
and seven words per line.
• This is known as the 6 x 7
rule.
HarveyTabamo
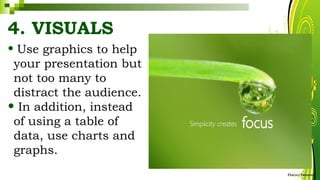
82.
4. VISUALS
• Usegraphics to help
your presentation but
not too many to
distract the audience.
• In addition, instead
of using a table of
data, use charts and
graphs.
HarveyTabamo
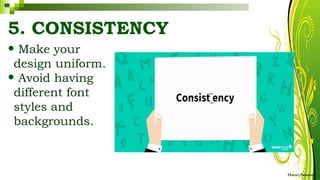
83.
5. CONSISTENCY
• Makeyour
design uniform.
• Avoid having
different font
styles and
backgrounds.
HarveyTabamo
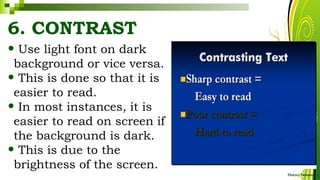
84.
6. CONTRAST
• Uselight font on dark
background or vice versa.
• This is done so that it is
easier to read.
• In most instances, it is
easier to read on screen if
the background is dark.
• This is due to the
brightness of the screen.
HarveyTabamo
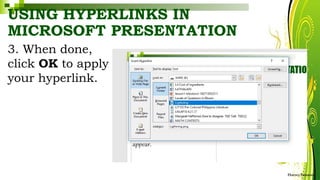
85.
USING HYPERLINKS IN
MICROSOFTPRESENTATION
•Using hyperlinks in
your presentation
is an easy way to
navigate slides
during your
presentation.
HarveyTabamo
86.
USING HYPERLINKS IN
MICROSOFTPRESENTATION
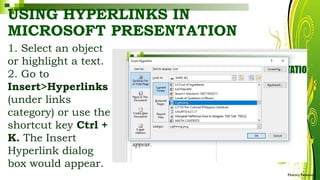
1. Select an object
or highlight a text.
2. Go to
Insert>Hyperlinks
(under links
category) or use the
shortcut key Ctrl +
K. The Insert
Hyperlink dialog
box would appear.
HarveyTabamo
87.
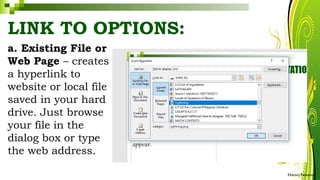
LINK TO OPTIONS:
a.Existing File or
Web Page – creates
a hyperlink to
website or local file
saved in your hard
drive. Just browse
your file in the
dialog box or type
the web address.
HarveyTabamo
88.
LINK TO OPTIONS:
b.Place in this
Document –
creates a
hyperlink that
allows you to
jump to a
specific slide in
your
presentation.
HarveyTabamo
89.
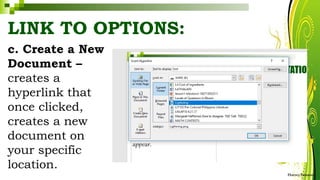
LINK TO OPTIONS:
c.Create a New
Document –
creates a
hyperlink that
once clicked,
creates a new
document on
your specific
location.
HarveyTabamo
90.
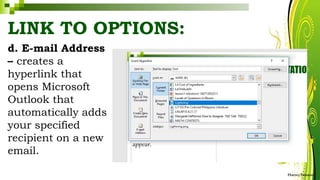
d. E-mail Address
–creates a
hyperlink that
opens Microsoft
Outlook that
automatically adds
your specified
recipient on a new
email.
HarveyTabamo
LINK TO OPTIONS:
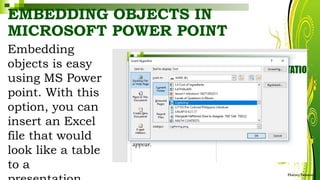
EMBEDDING OBJECTS IN
MICROSOFTPOWER POINT
Embedding
objects is easy
using MS Power
point. With this
option, you can
insert an Excel
file that would
look like a table
to a
HarveyTabamo
93.
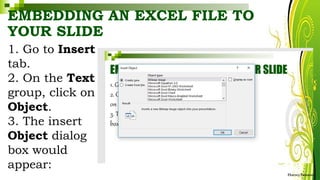
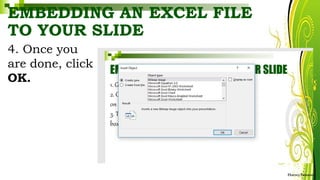
EMBEDDING AN EXCELFILE TO
YOUR SLIDE
1. Go to Insert
tab.
2. On the Text
group, click on
Object.
3. The insert
Object dialog
box would
appear:
HarveyTabamo
94.
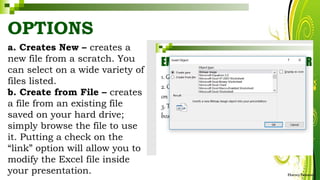
OPTIONS
a. Creates New– creates a
new file from a scratch. You
can select on a wide variety of
files listed.
b. Create from File – creates
a file from an existing file
saved on your hard drive;
simply browse the file to use
it. Putting a check on the
“link” option will allow you to
modify the Excel file inside
your presentation. HarveyTabamo
95.
EMBEDDING AN EXCELFILE
TO YOUR SLIDE
4. Once you
are done, click
OK.
HarveyTabamo
96.
GROUP ACTIVITY
1. Groupthe class into 4 groups.
2. Assuming that we’re done with
the business week or School
Bazaar.
3. Create your PowerPoint
presentation in manila paper or
cartolina and follow the
following content.
4. Use appropriate design, table,
chart and diagram if applicable.
HarveyTabamo
97.
USING HYPERLINKS IN
MICROSOFTPRESENTATION
HarveyTabamo
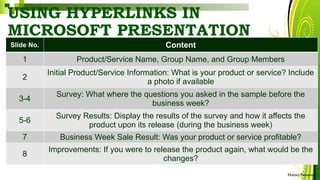
Slide No. Content
1 Product/Service Name, Group Name, and Group Members
2
Initial Product/Service Information: What is your product or service? Include
a photo if available
3-4
Survey: What where the questions you asked in the sample before the
business week?
5-6
Survey Results: Display the results of the survey and how it affects the
product upon its release (during the business week)
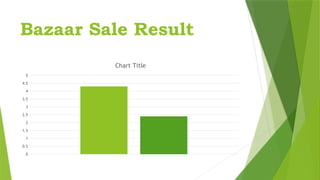
7 Business Week Sale Result: Was your product or service profitable?
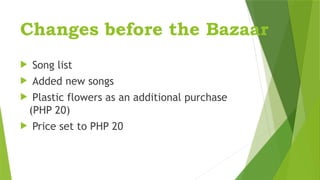
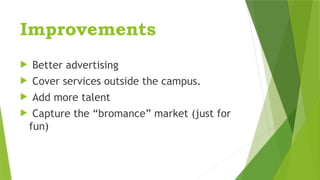
8
Improvements: If you were to release the product again, what would be the
changes?
98.
Serenade Services
Raye ErilkaOrtiz
Aaron Kyle Bautista
Jelyn Llanera
Annabelle Potato
Emirose Sanchez
Right in the Hertz
99.
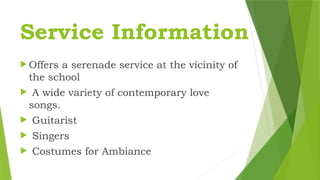
Service Information
Offersa serenade service at the vicinity of
the school
A wide variety of contemporary love
songs.
Guitarist
Singers
Costumes for Ambiance
100.
Survey
On ascale of 1-5, how would you rate our
service?
Would you recommend our service to a
friend?
How much are you willing to pay for this
service?
Do you have any comments or suggestions?
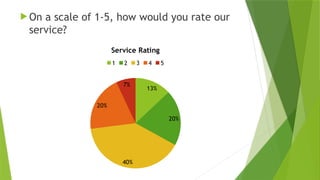
101.
On ascale of 1-5, how would you rate our
service?
13%
20%
40%
20%
7%
Service Rating
1 2 3 4 5
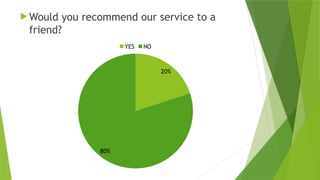
102.
Would yourecommend our service to a
friend?
20%
80%
YES NO
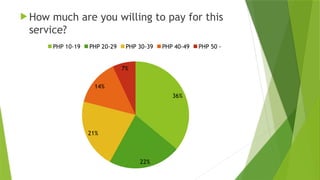
103.
How muchare you willing to pay for this
service?
36%
22%
21%
14%
7%
PHP 10-19 PHP 20-29 PHP 30-39 PHP 40-49 PHP 50 -
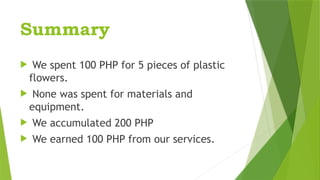
Summary
We spent100 PHP for 5 pieces of plastic
flowers.
None was spent for materials and
equipment.
We accumulated 200 PHP
We earned 100 PHP from our services.
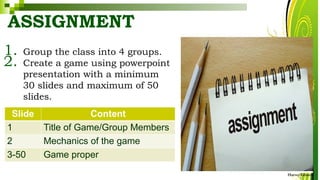
ASSIGNMENT
1. Group theclass into 4 groups.
2. Create a game using powerpoint
presentation with a minimum
30 slides and maximum of 50
slides.
HarveyTabamo
Slide Content
1 Title of Game/Group Members
2 Mechanics of the game
3-50 Game proper