Acxiom held a Q1 FY19 conference call on August 9, 2018 to discuss financial results and the proposed sale of Acxiom Marketing Solutions to Interpublic Group. Key highlights included:
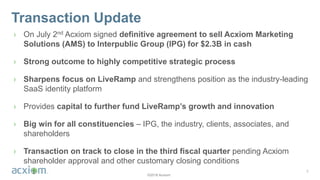
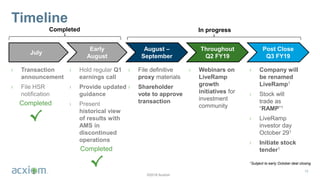
- The sale of AMS to IPG for $2.3 billion remains on track to close in Q3 pending shareholder approval.
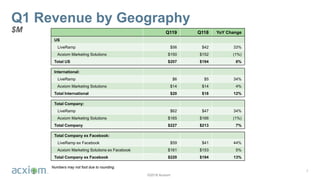
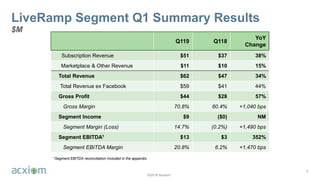
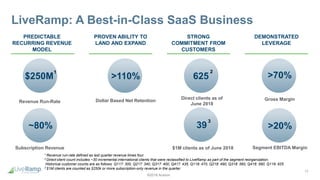
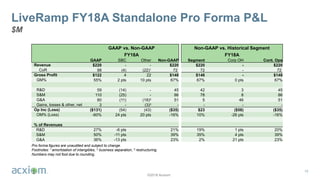
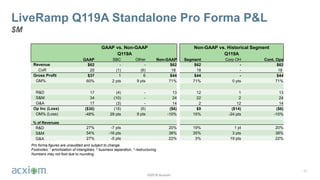
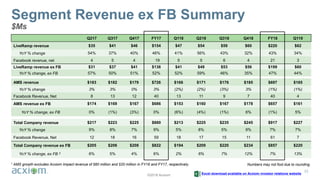
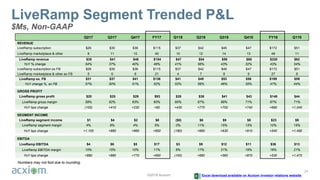
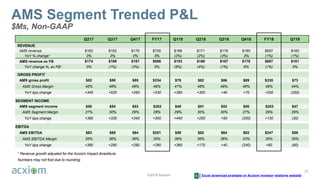
- LiveRamp revenue grew 34% year-over-year to $62 million in Q1, with subscription revenue up 38%.
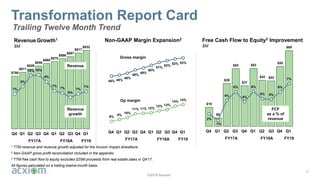
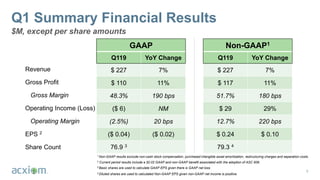
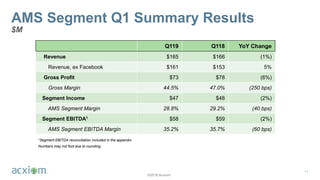
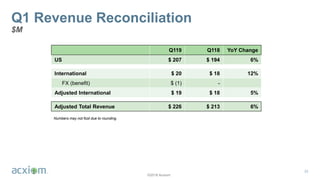
- Overall company revenue was $227 million in Q1, up 7% year-over-year excluding Facebook.
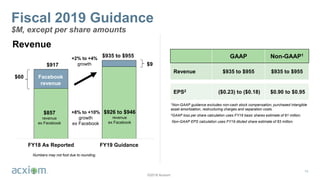
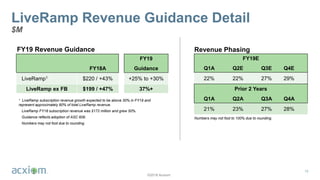
- Guidance for FY19 expects revenue between $935-955 million and non-GAAP