This document provides an overview and update on the Brucejack gold project located in northern British Columbia, Canada. Key points include:
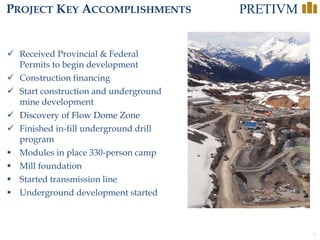
- Brucejack is a high-grade underground gold project that is fully permitted and funded, with commercial production targeted for 2017.
- Updated mineral reserves estimate shows 6.9 million ounces of gold and 4.6 million ounces of silver in the proven and probable categories.
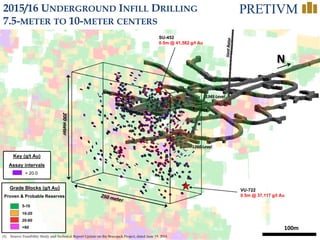
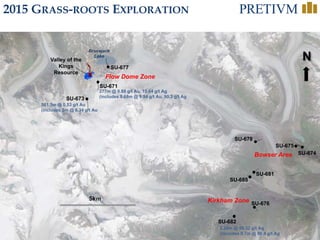
- Underground infill drilling program was completed in 2015-2016 to upgrade resources closer to planned mining areas. Drilling intersected high gold grades, including 0.5m at 37,117 g/t Au and 0.5m at 41,582 g/t Au.
- Project economics from