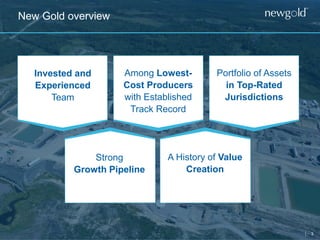
The corporate presentation provides an overview of New Gold Inc., including:
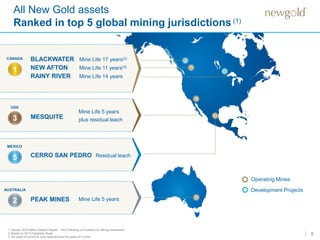
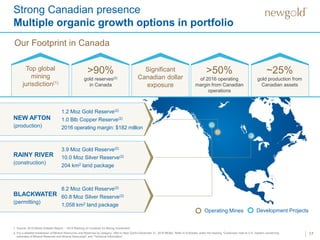
- New Gold has a portfolio of assets in top-rated mining jurisdictions like Canada, the USA, Australia and Mexico.
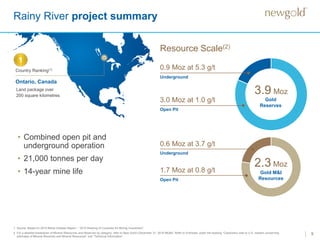
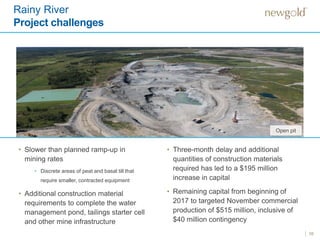
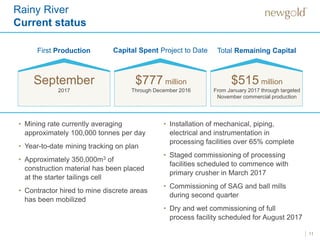
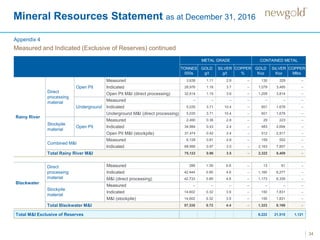
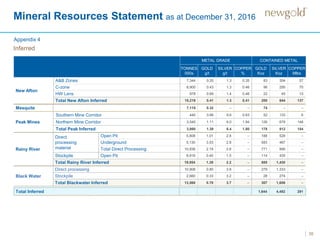
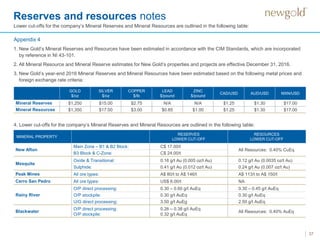
- Their key growth project is the Rainy River mine in Ontario, Canada, which is expected to have an initial 14-year mine life upon achieving commercial production in late 2017.
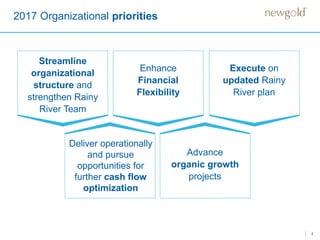
- New Gold's priorities for 2017 include strengthening their team at Rainy River to ensure successful execution of the project, as well as pursuing opportunities to further optimize cash flow from their operating mines.