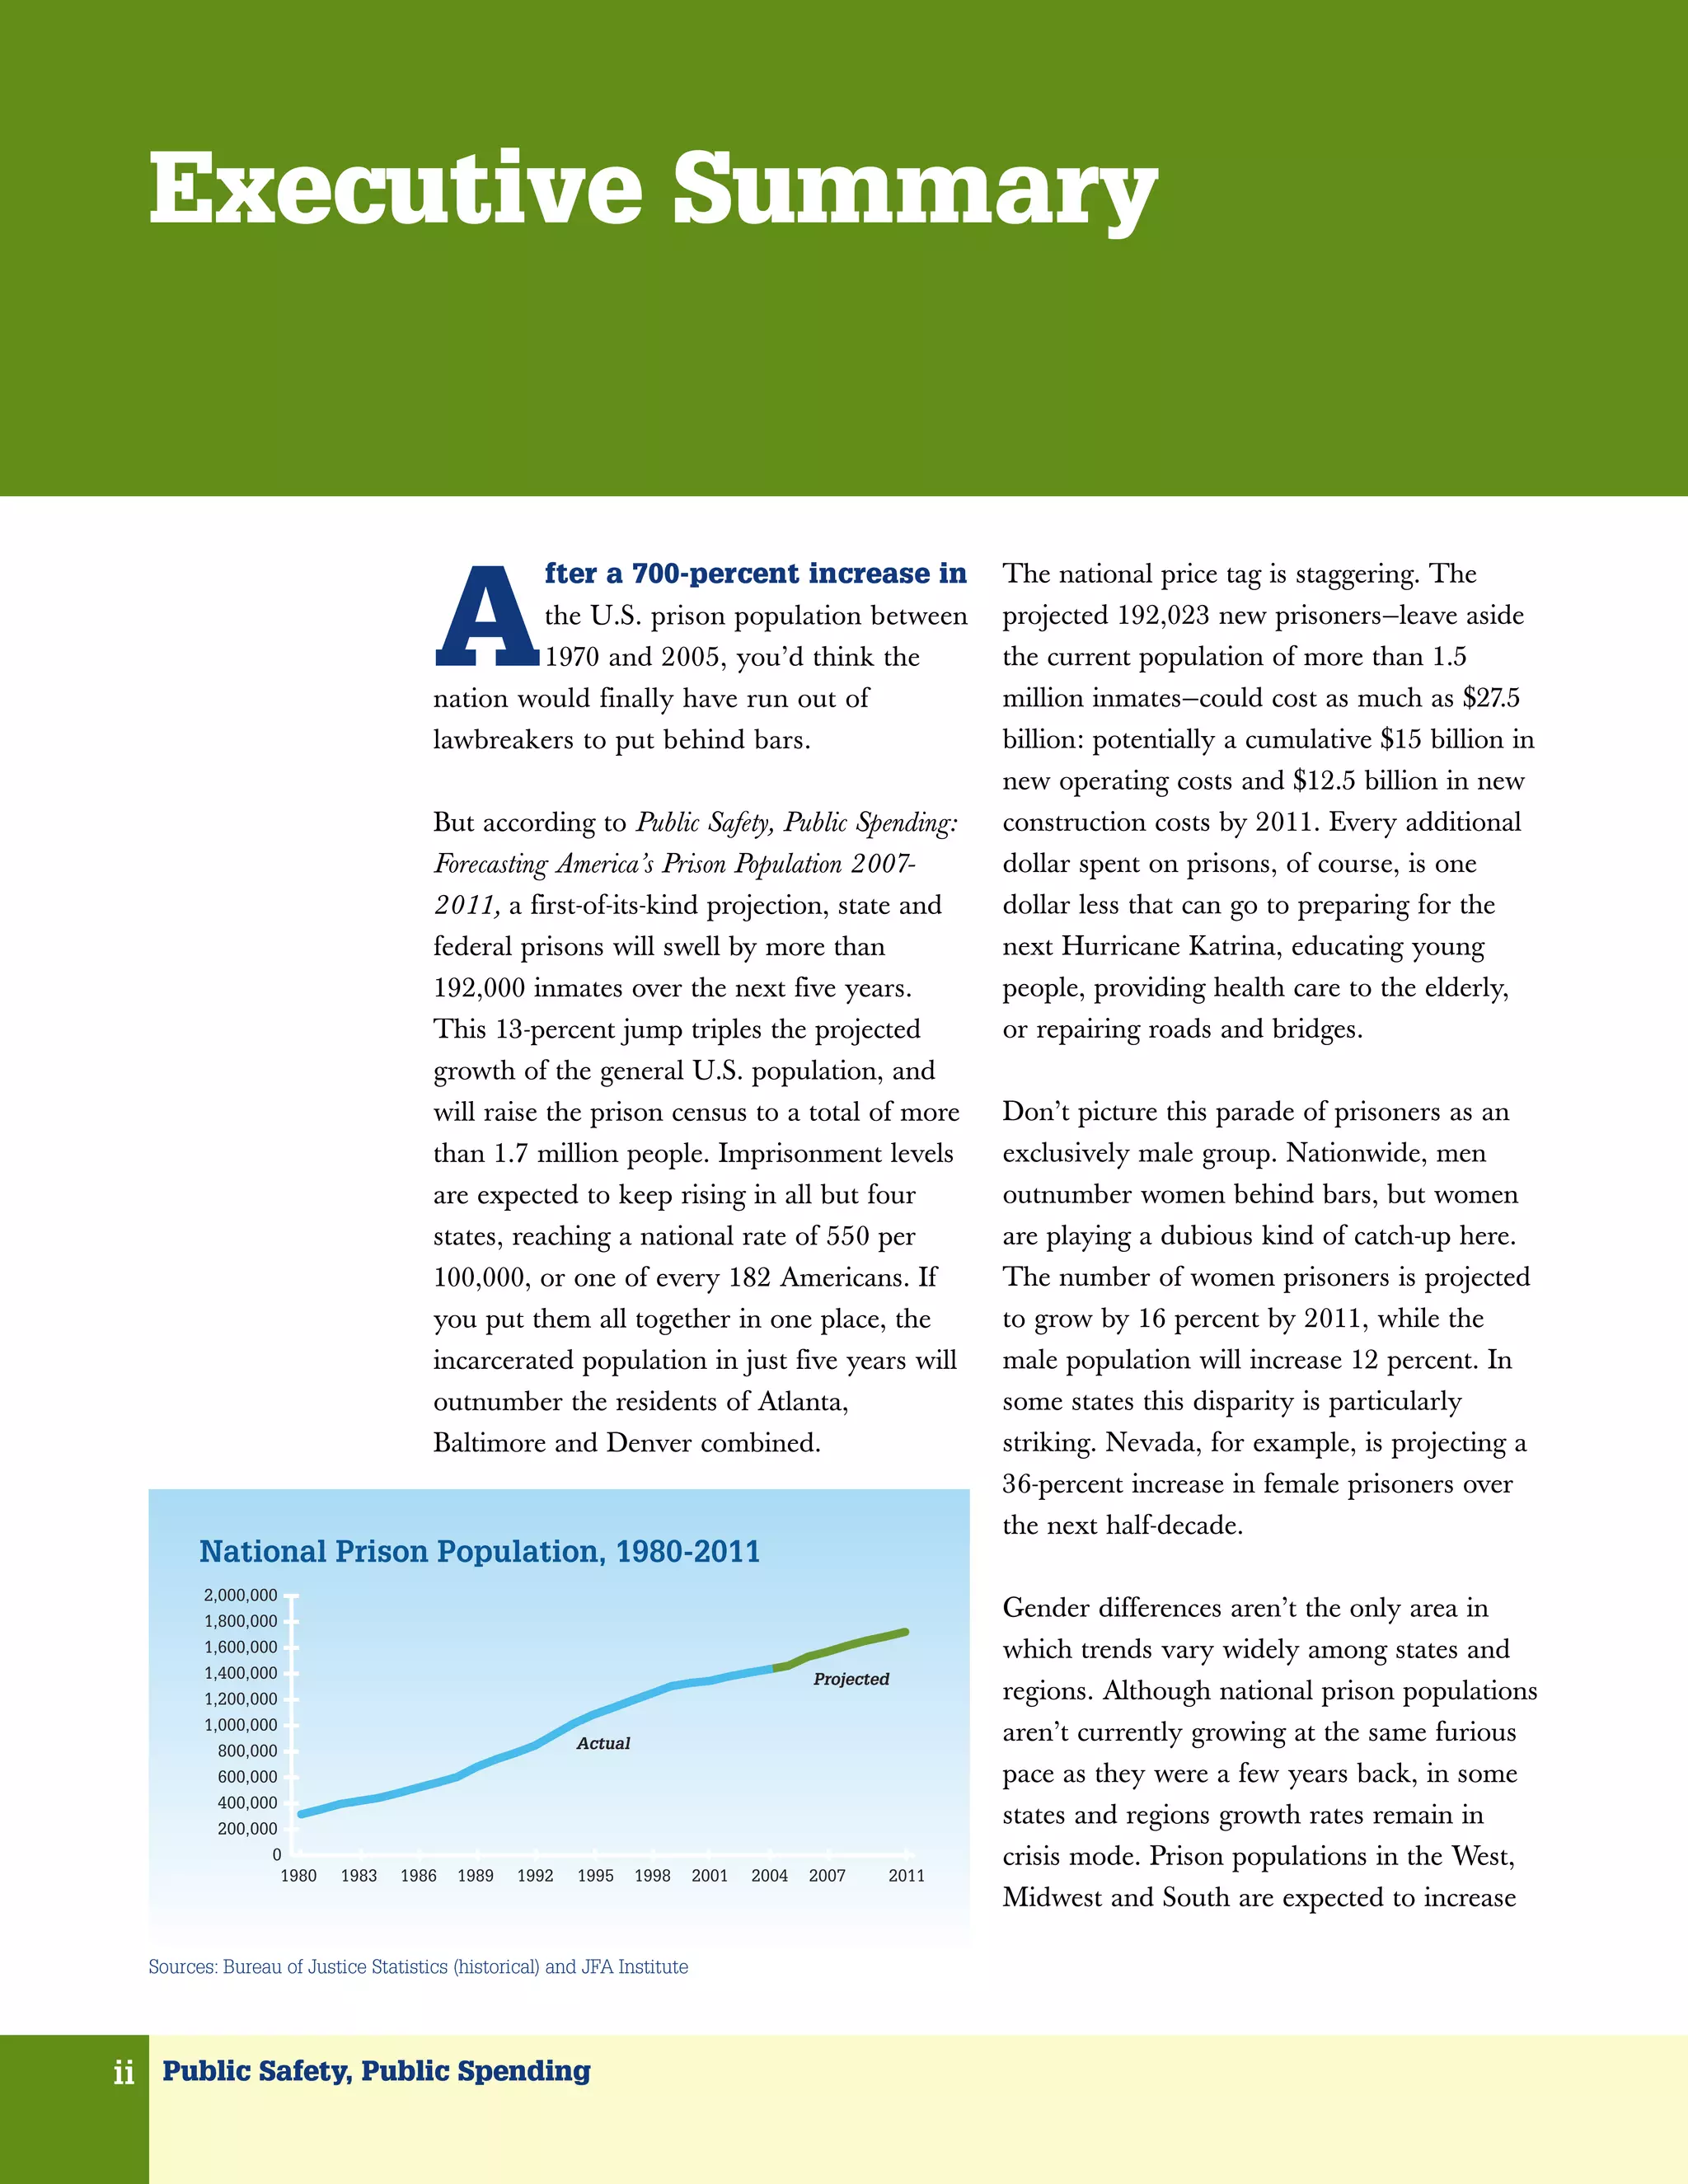
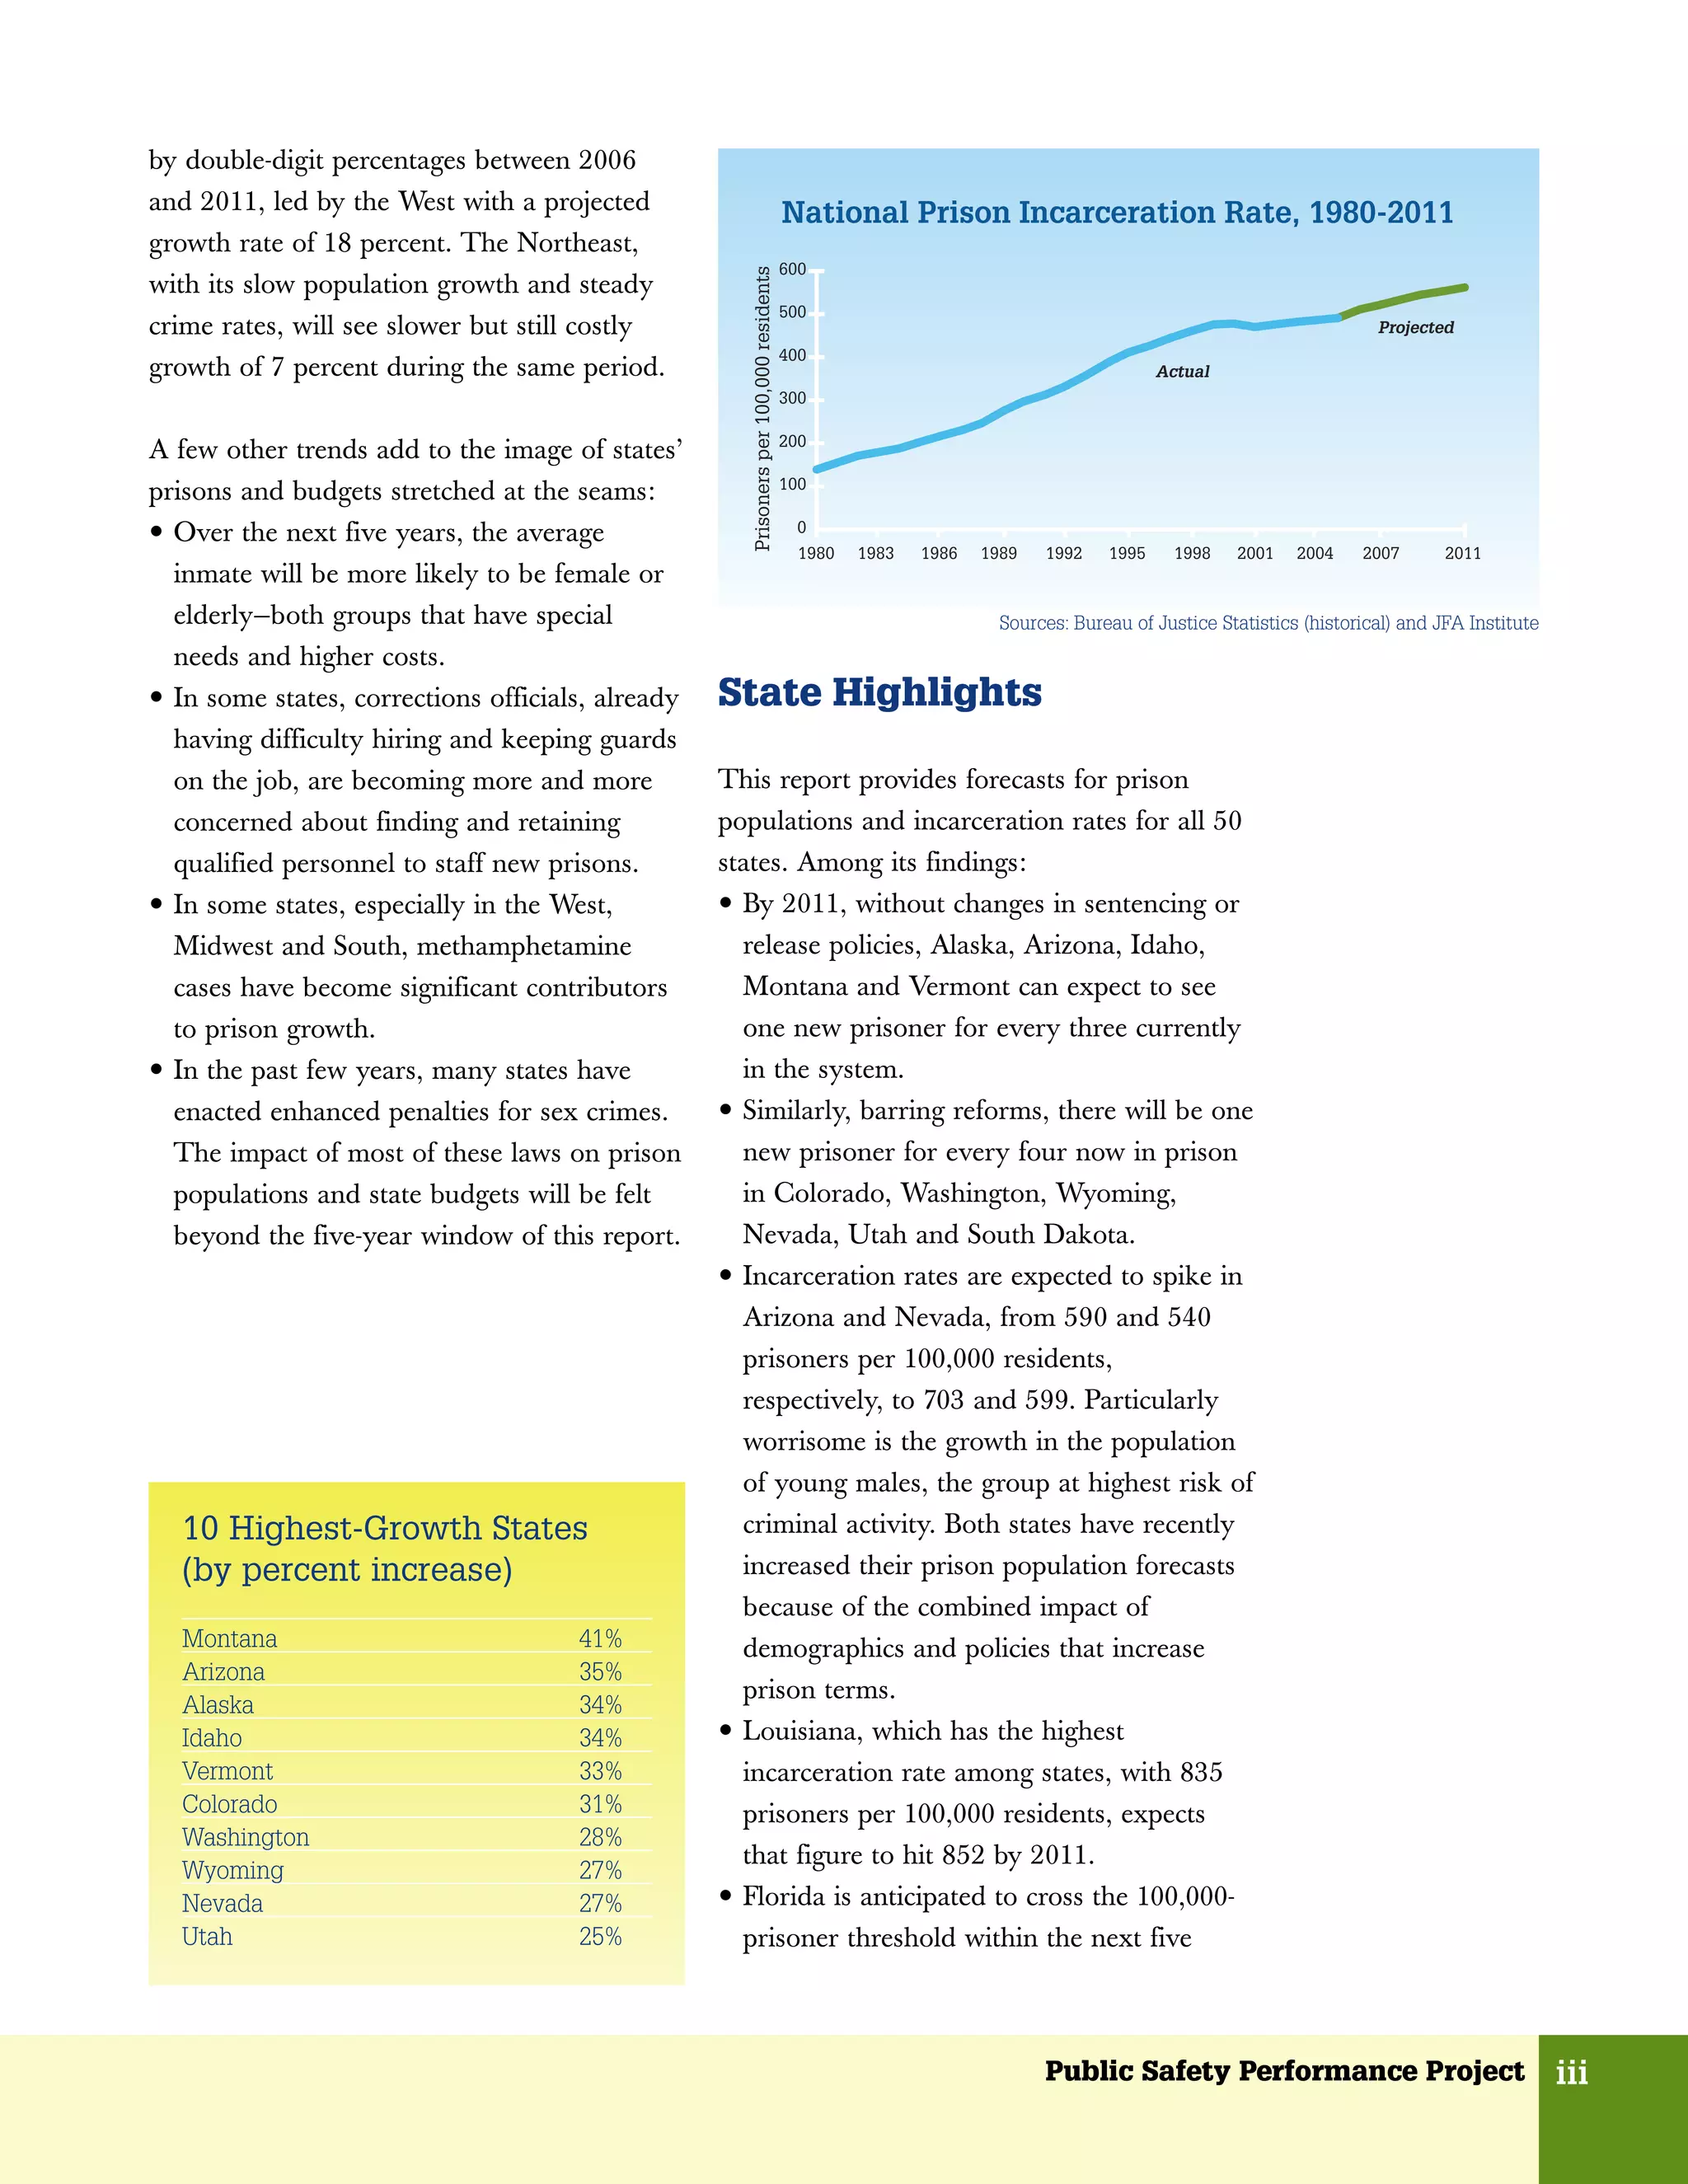
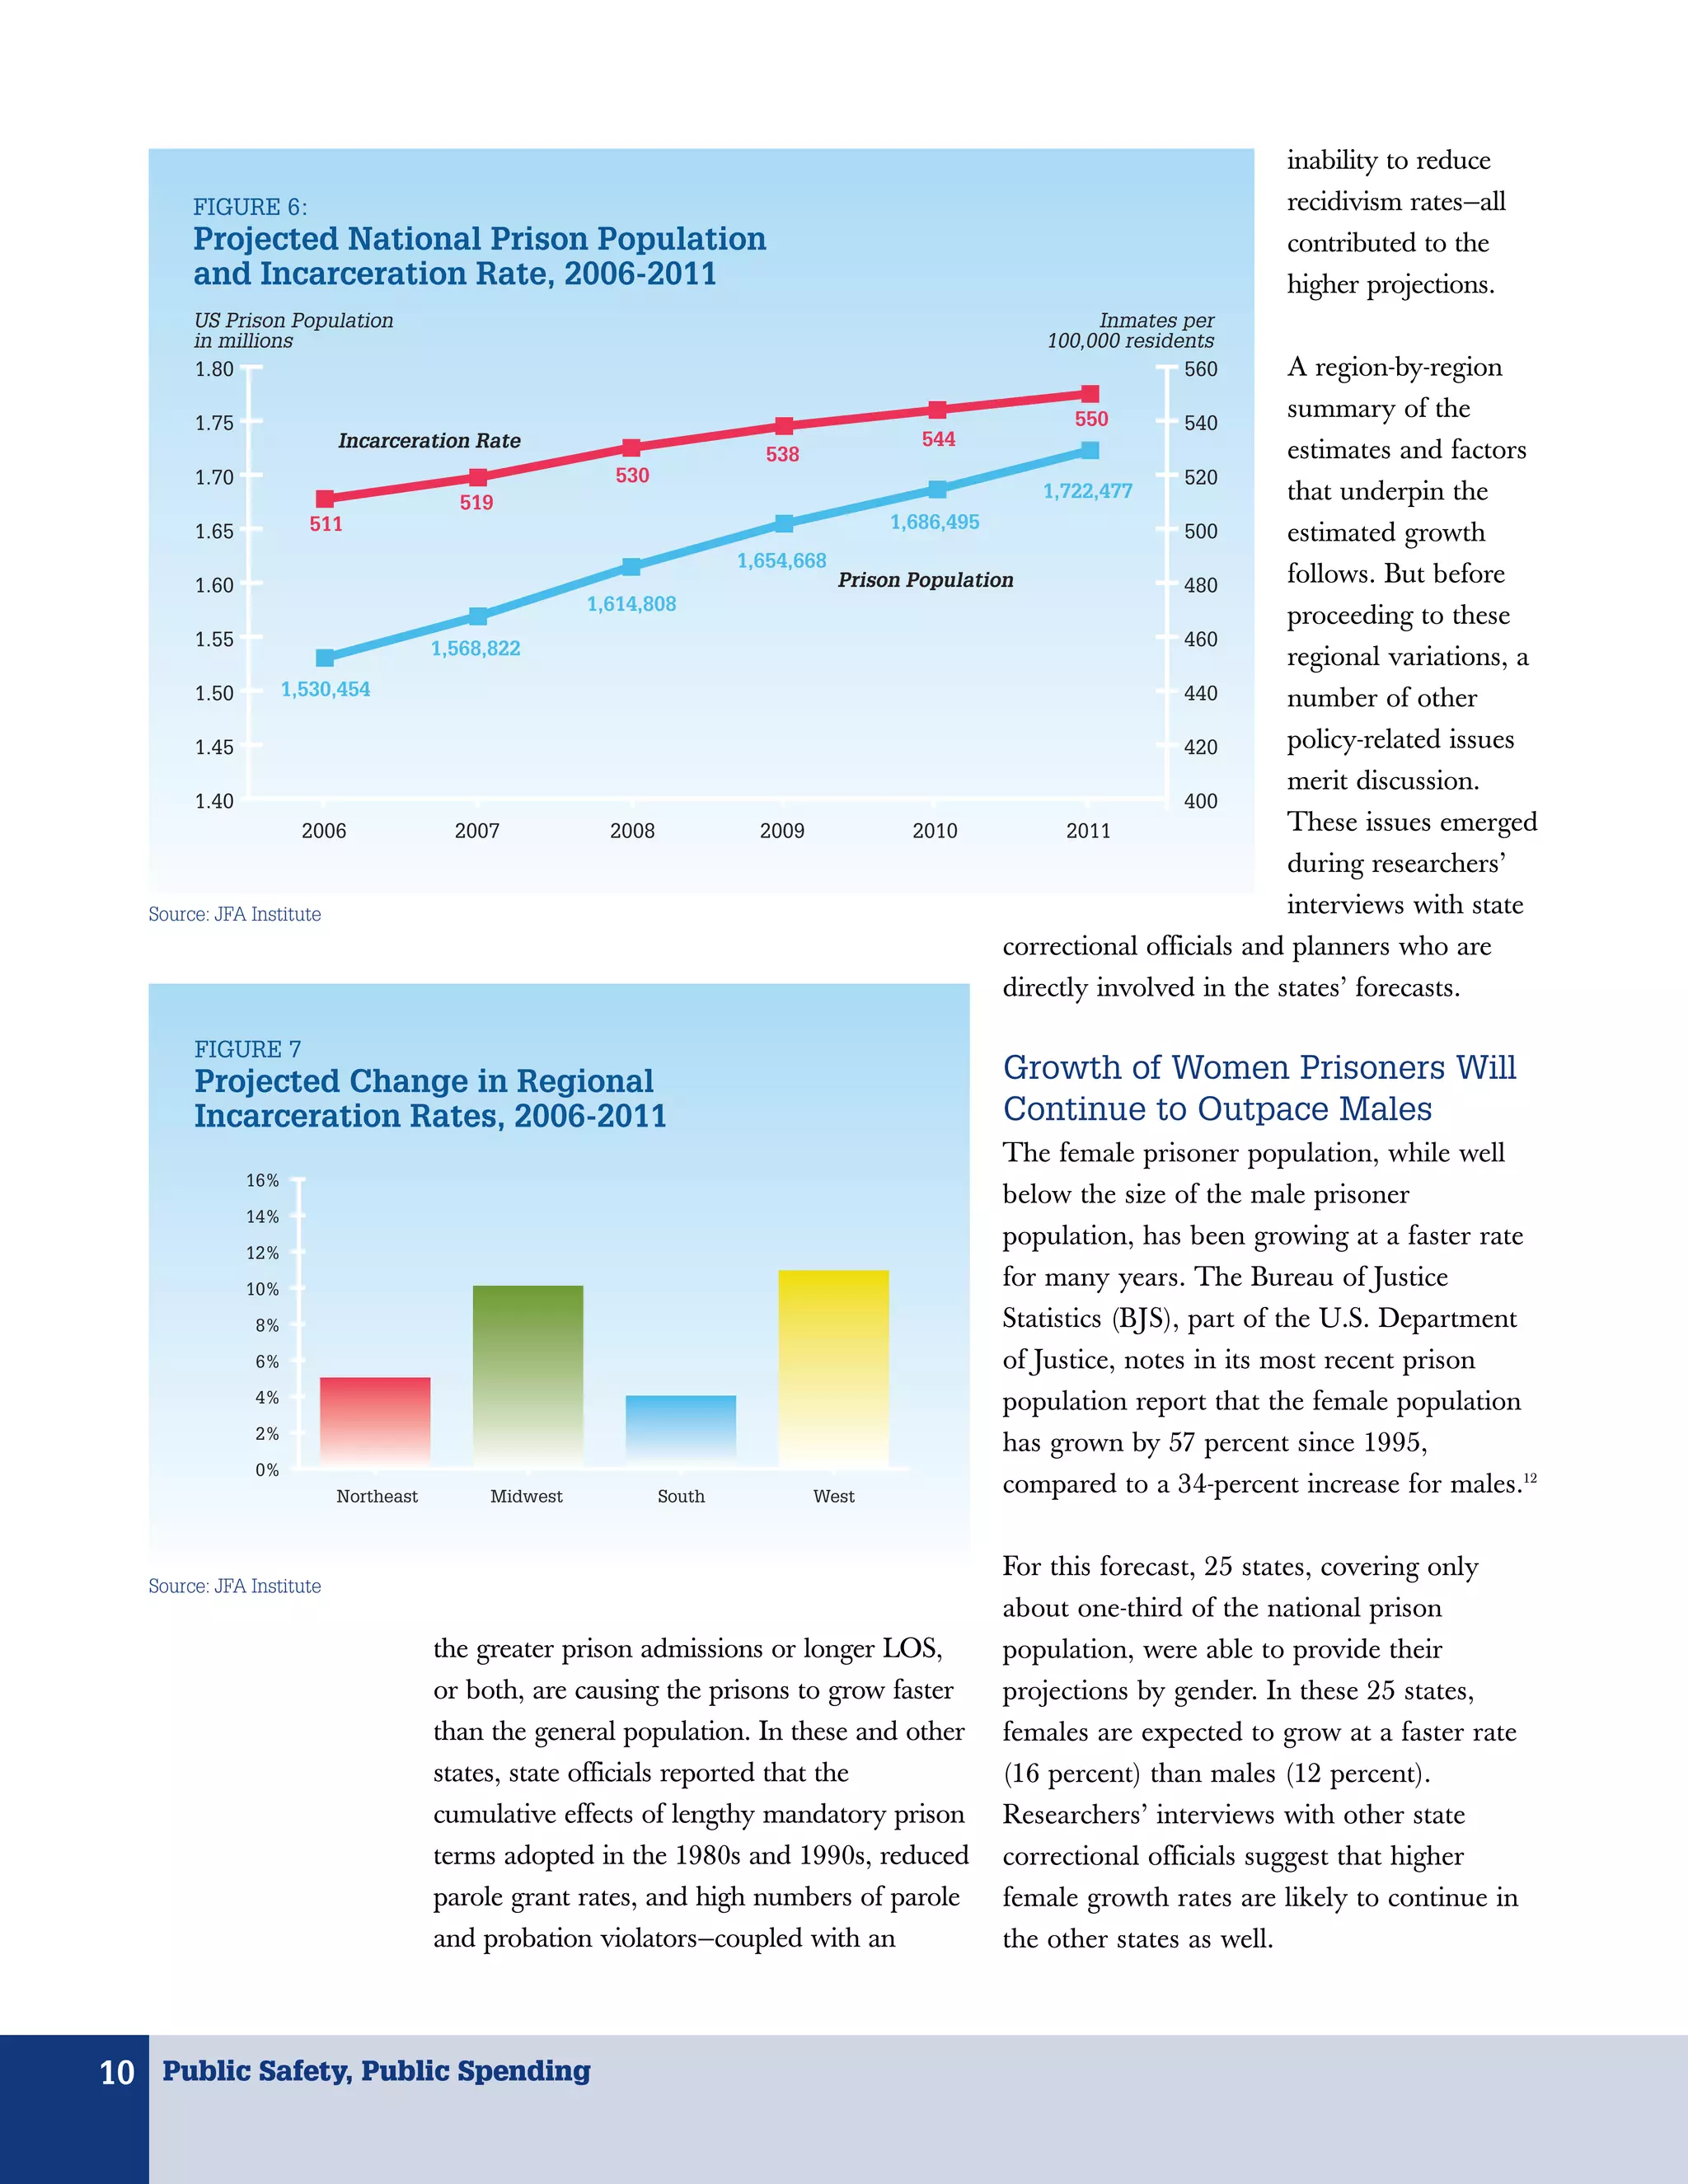
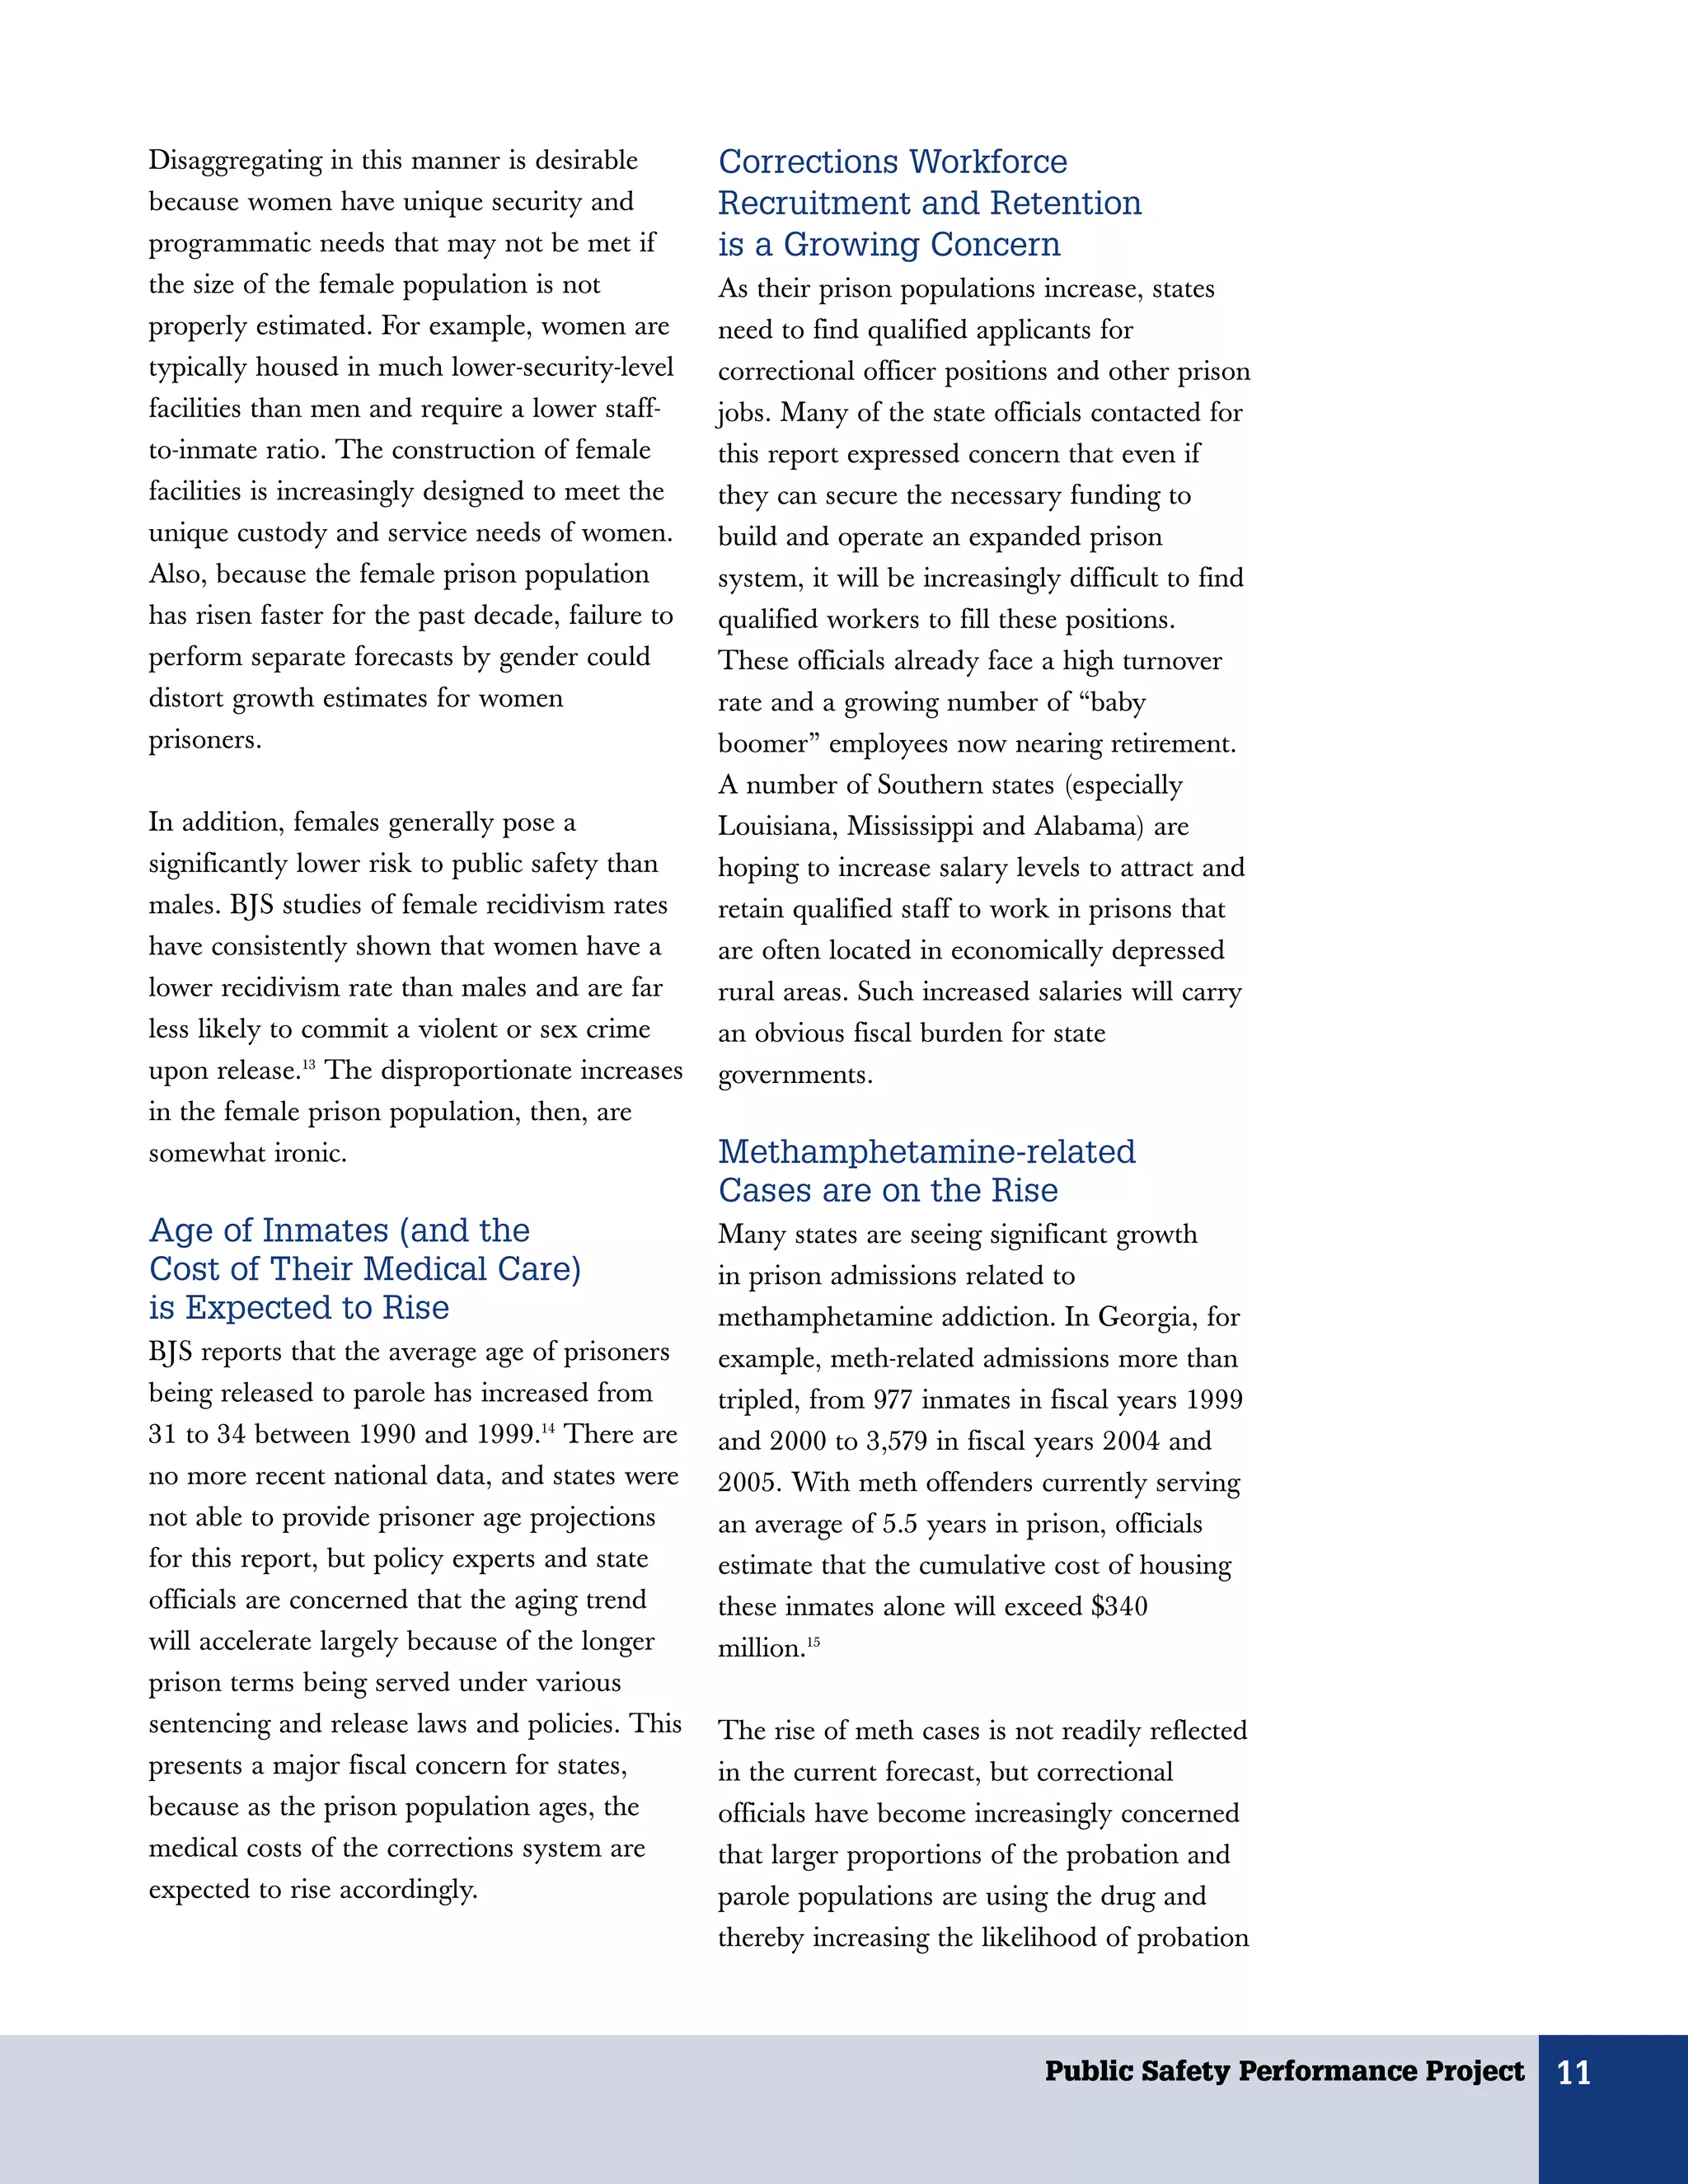
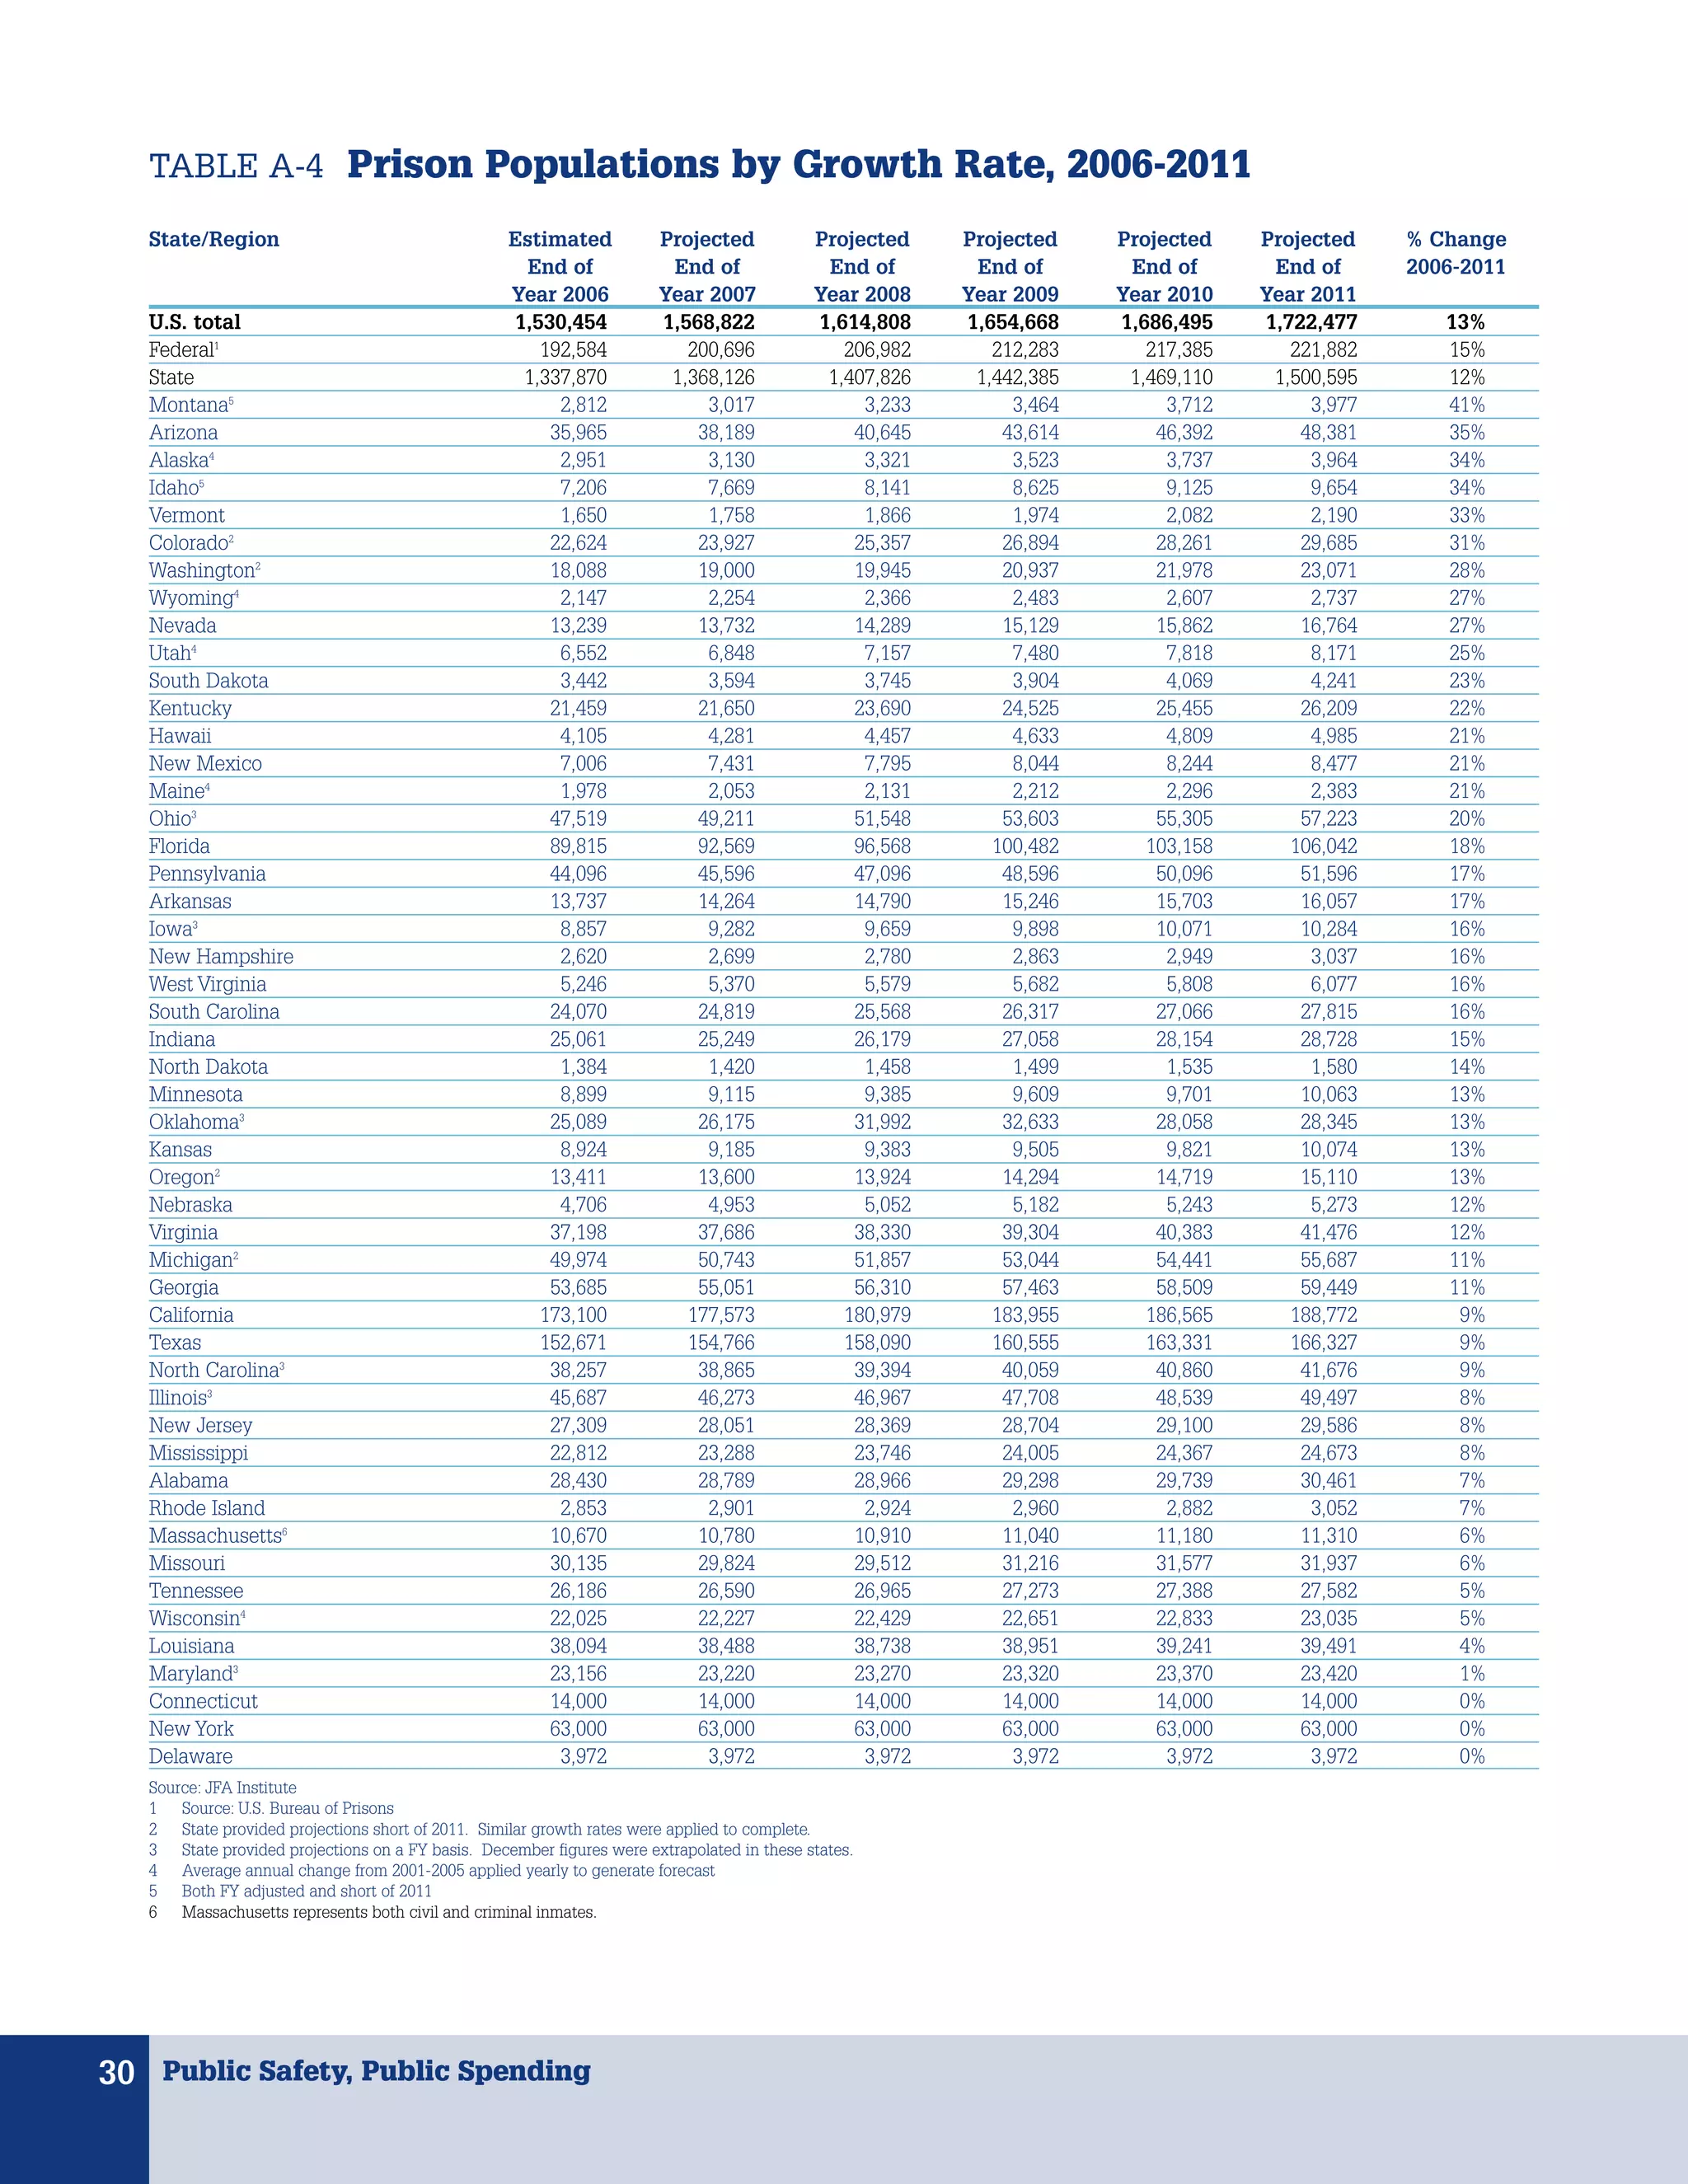
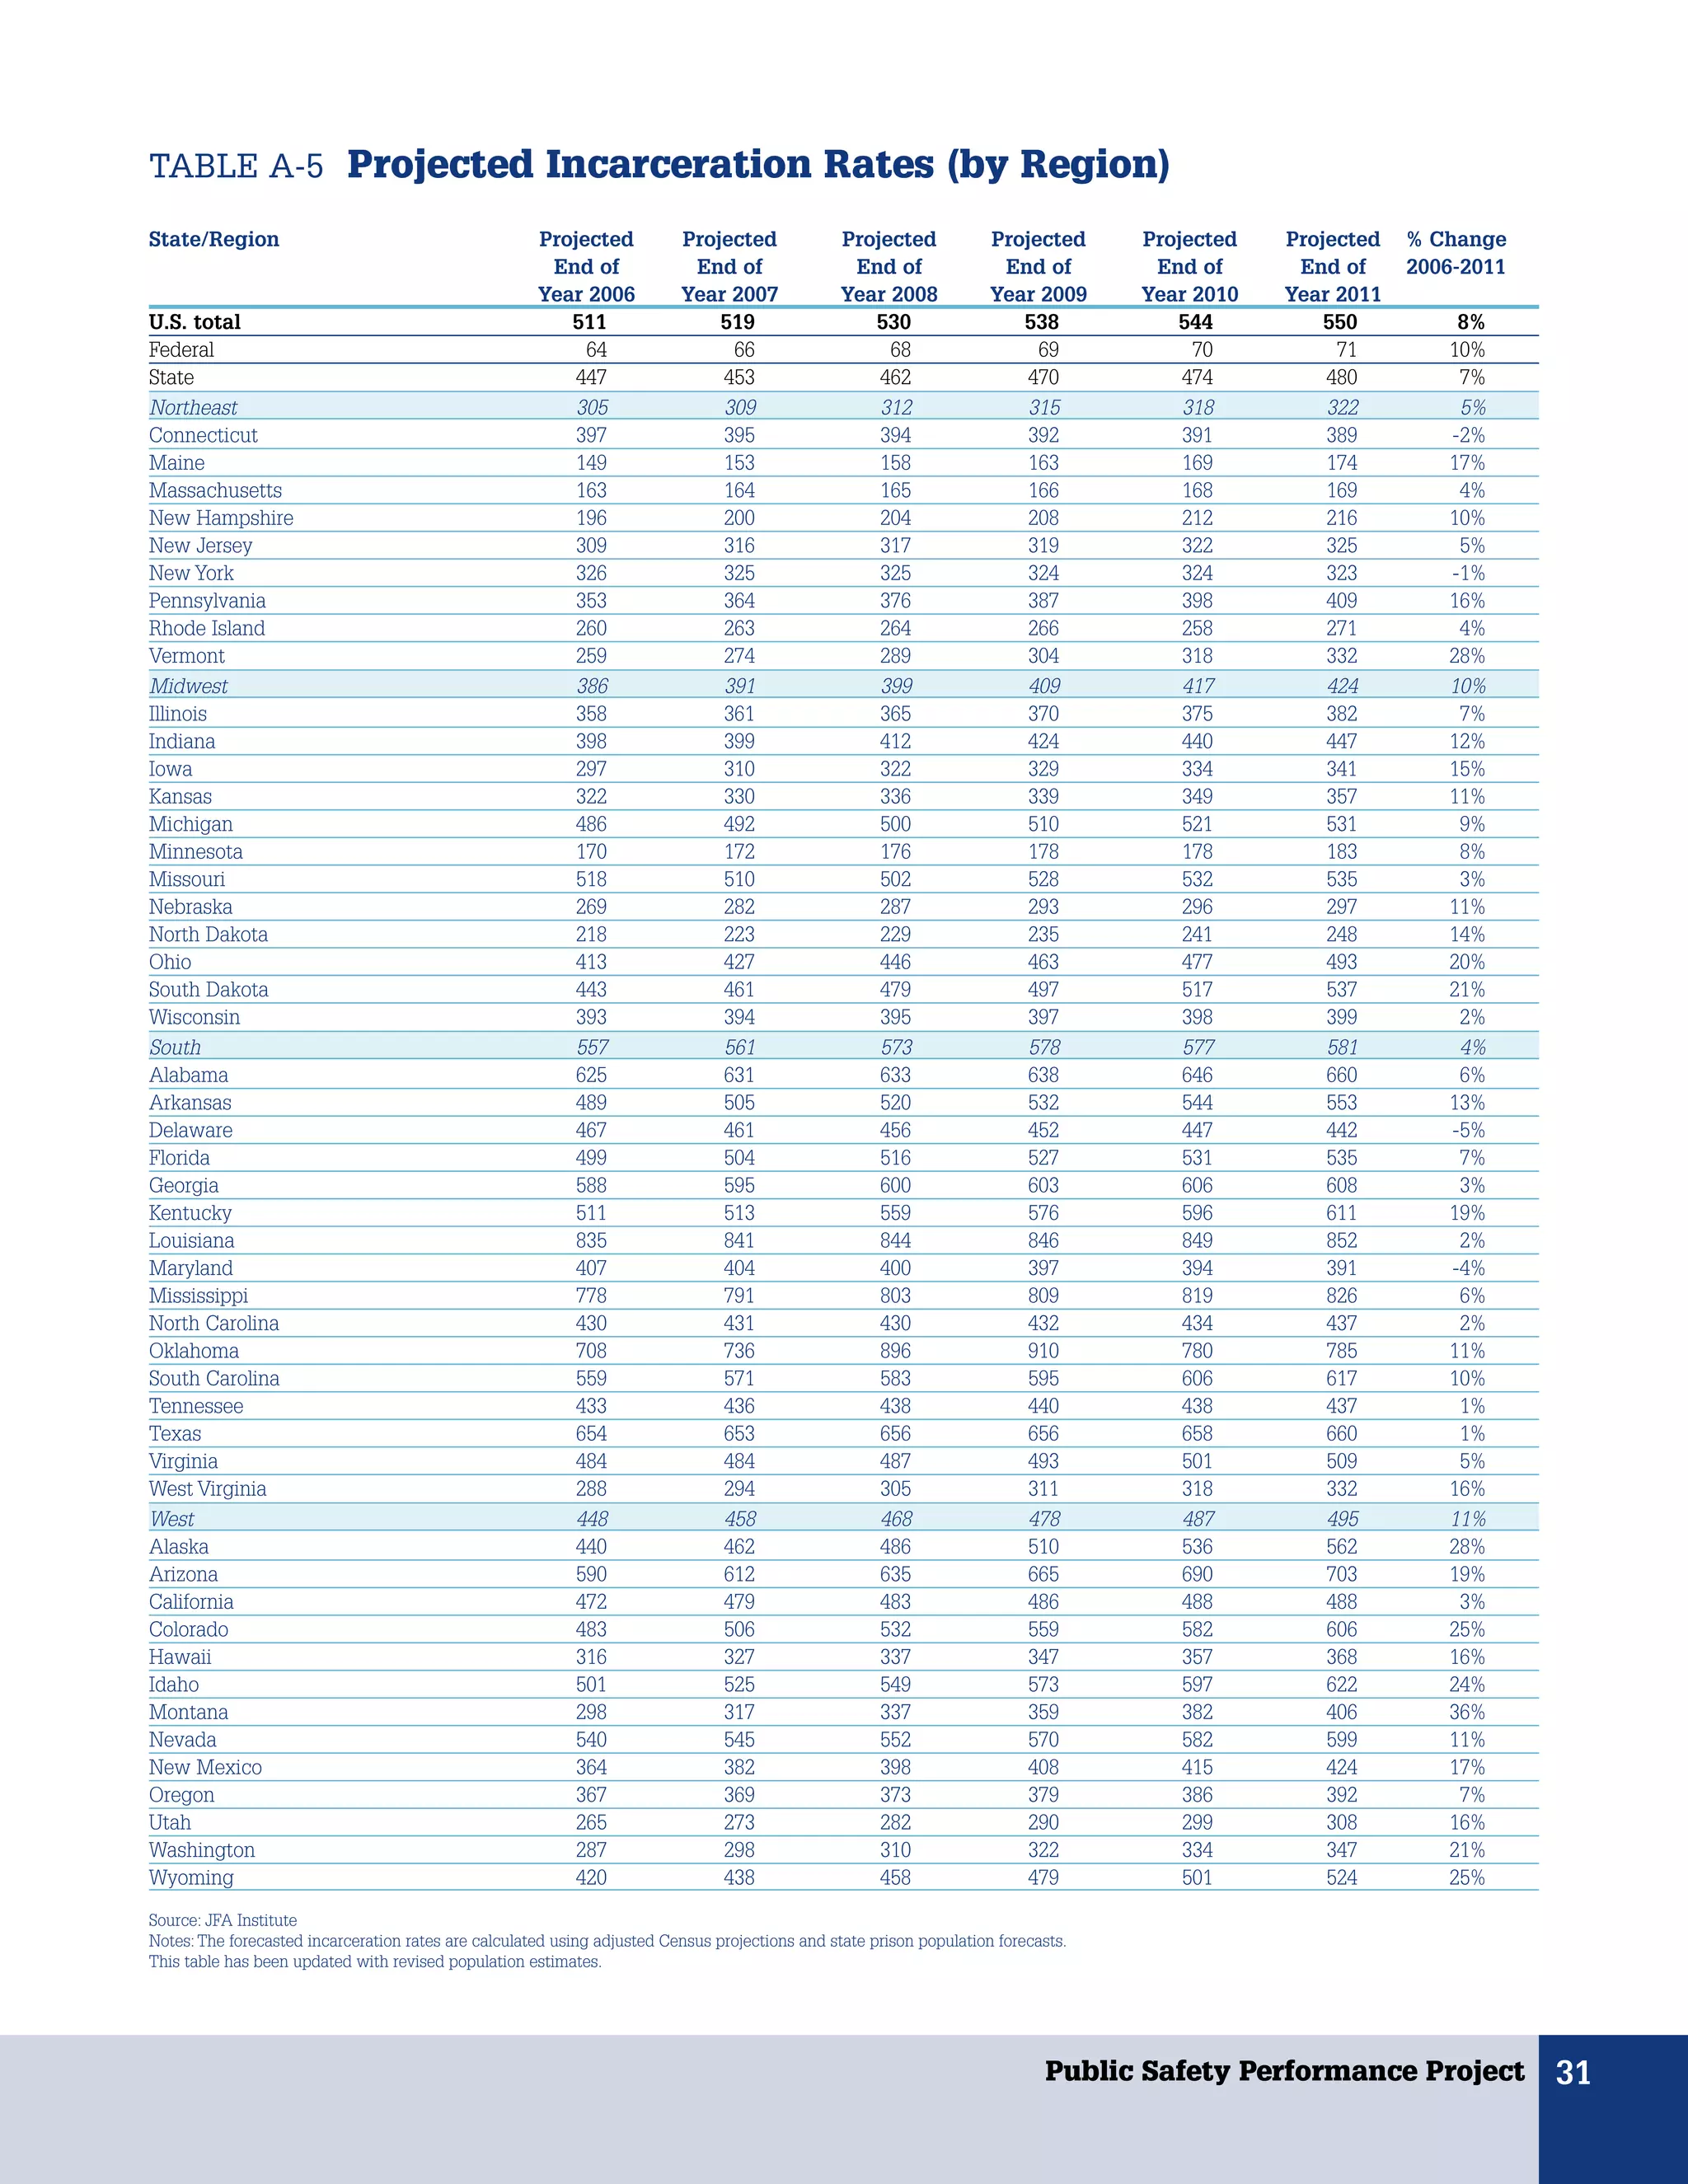
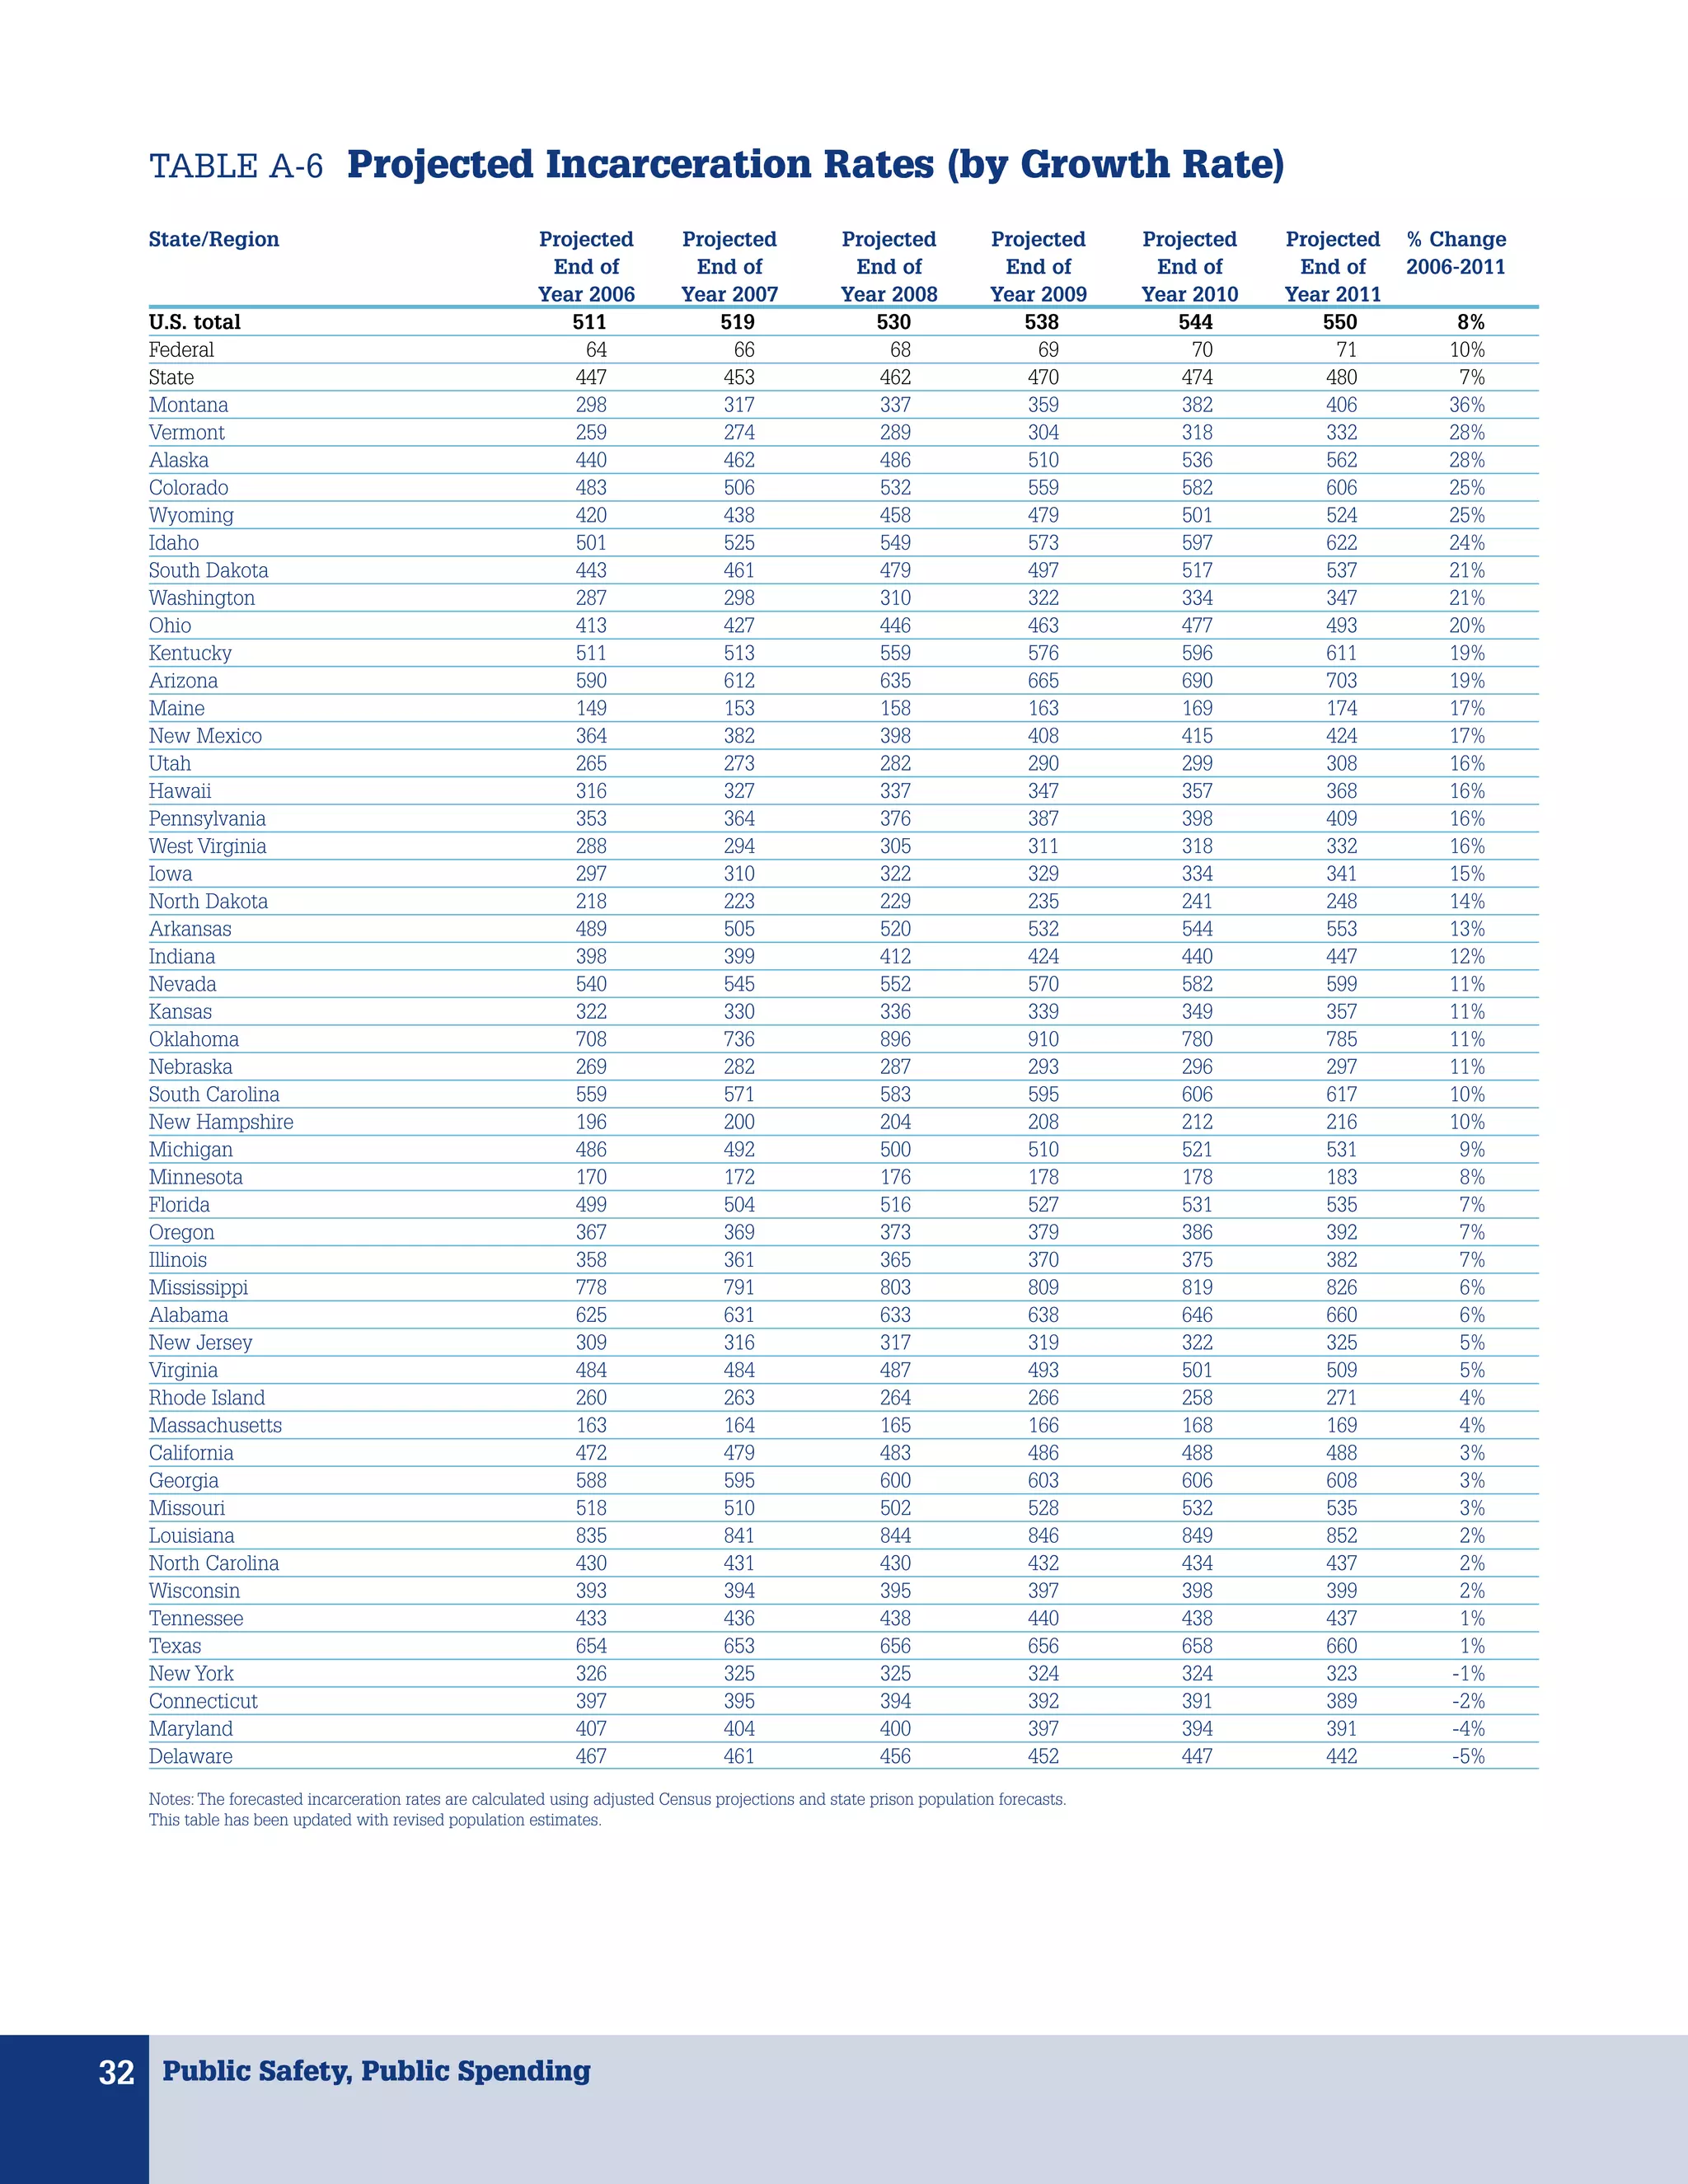
Public Safety,
Public Spending
Forecasting America’s Prison Population 2007–2011
Revised June 2007. The projected incarceration rates in this report have been updated with revised population estimates.
About the Public Safety
Performance Project


A
         n operating project of The Pew Charitable               Justice, and former bureau chief of the Bureau of
         Trusts, the Public Safety Performance Project           Research and Data Analysis for the Florida Department
         seeks to help states advance fiscally sound, data-      of Corrections.
driven policies and practices in sentencing and corrections    • Richard Berk, professor of criminology and statistics,
that protect public safety, hold offenders accountable and       University of Pennsylvania, and former Distinguished
control corrections costs. The project helps states              Professor of Statistics and Sociology at UCLA.
diagnose the factors driving prison growth and provides        • Gerald Gaes, visiting scientist at the National Institute
policy audits to identify options for reform, drawing on         of Justice, criminal justice consultant and former
solid research, promising approaches and best practices in       director of research for the Federal Bureau of Prisons.
other states. The initiative also helps state officials,
practitioners and others share state-of-the-art knowledge      While these experts have screened the report for
and ideas through policy forums, public opinion surveys,       methodology and accuracy, neither they nor their current
multi-state meetings, national, regional and state-level       or former organizations necessarily endorse its findings
convenings, and online information about what works.           or conclusions.

The project works closely with the Pew Center on the           Substantial contributions to the report also were made by
States (PCS), a division of Pew. By conducting nonpartisan     the Vera Institute of Justice and the Council of State
research and analysis, educating the public and federal and    Governments Justice Center, partners of the Public Safety
state policy makers, bringing together diverse stakeholders,   Performance Project. Staff of both organizations reviewed
and encouraging pragmatic, consensus-based solutions,          drafts of the report and offered excellent comments and
PCS identifies and advances effective public policy            insights that were instrumental to its completion.
approaches to critical issues facing states.
                                                               We also would like to thank the 50 state correctional
                                                               agencies and the federal Bureau of Prisons, which
About this Report                                              provided much of the data used to create the national
                                                               forecast and other parts of this report.
This report was prepared for the Public Safety
Performance Project by the JFA Institute, a well-respected,
Washington-based, nonprofit consulting firm. JFA is led
by James Austin, Wendy Naro and Tony Fabelo, three
                                                               Contact Information
nationally renowned researchers with deep expertise in         For more information, please visit www.pewpublicsafety.org
state criminal justice policy and statistics. JFA conducts     or contact Project Director Adam Gelb at
prison population forecasts under contract with a number       agelb@pewtrusts.org or (404) 848-0186.
of states, and several other states use JFA’s software to
make their projections.                                        The Pew Charitable Trusts is driven by the power of knowledge
                                                               to solve today’s most challenging problems. Pew applies a
                                                               rigorous, analytical approach to improve public policy, inform the
The report was reviewed by three independent specialists
                                                               public and stimulate civic life. We partner with a diverse range of
in prison population forecasting:
                                                               donors, public and private organizations and concerned citizens
• William Bales, associate professor, Florida State            who share our commitment to fact-based solutions and goal-driven
  University, College of Criminology and Criminal              investments to improve society.


                                                                                 Public Safety Performance Project                   i
Executive Summary


                                             fter a 700-percent increase in


                                     A
                                                                                                      The national price tag is staggering. The
                                             the U.S. prison population between                       projected 192,023 new prisoners—leave aside
                                             1970 and 2005, you’d think the                           the current population of more than 1.5
                                     nation would finally have run out of                             million inmates—could cost as much as $27.5
                                     lawbreakers to put behind bars.                                  billion: potentially a cumulative $15 billion in
                                                                                                      new operating costs and $12.5 billion in new
                                     But according to Public Safety, Public Spending:                 construction costs by 2011. Every additional
                                     Forecasting America’s Prison Population 2007-                    dollar spent on prisons, of course, is one
                                     2011, a first-of-its-kind projection, state and                  dollar less that can go to preparing for the
                                     federal prisons will swell by more than                          next Hurricane Katrina, educating young
                                     192,000 inmates over the next five years.                        people, providing health care to the elderly,
                                     This 13-percent jump triples the projected                       or repairing roads and bridges.
                                     growth of the general U.S. population, and
                                     will raise the prison census to a total of more                  Don’t picture this parade of prisoners as an
                                     than 1.7 million people. Imprisonment levels                     exclusively male group. Nationwide, men
                                     are expected to keep rising in all but four                      outnumber women behind bars, but women
                                     states, reaching a national rate of 550 per                      are playing a dubious kind of catch-up here.
                                     100,000, or one of every 182 Americans. If                       The number of women prisoners is projected
                                     you put them all together in one place, the                      to grow by 16 percent by 2011, while the
                                     incarcerated population in just five years will                  male population will increase 12 percent. In
                                     outnumber the residents of Atlanta,                              some states this disparity is particularly
                                     Baltimore and Denver combined.                                   striking. Nevada, for example, is projecting a
                                                                                                      36-percent increase in female prisoners over
                                                                                                      the next half-decade.
        National Prison Population, 1980-2011
        2,000,000
        1,800,000
                                                                                                      Gender differences aren’t the only area in
        1,600,000                                                                                     which trends vary widely among states and
        1,400,000                                                                      Projected
        1,200,000                                                                                     regions. Although national prison populations
        1,000,000
                                                       Actual
                                                                                                      aren’t currently growing at the same furious
          800,000
          600,000                                                                                     pace as they were a few years back, in some
          400,000
          200,000
                                                                                                      states and regions growth rates remain in
                 0                                                                                    crisis mode. Prison populations in the West,
                  1980    1983   1986   1989    1992   1995     1998     2001   2004   2007    2011
                                                                                                      Midwest and South are expected to increase

  Sources: Bureau of Justice Statistics (historical) and JFA Institute


ii Public Safety, Public Spending
by double-digit percentages between 2006
and 2011, led by the West with a projected                                                National Prison Incarceration Rate, 1980-2011
growth rate of 18 percent. The Northeast,
                                                                                          600


                                                        Prisoners per 100,000 residents
with its slow population growth and steady
                                                                                          500
crime rates, will see slower but still costly                                                                                                                     Projected
                                                                                          400
growth of 7 percent during the same period.                                                                                            Actual
                                                                                          300

                                                                                          200
A few other trends add to the image of states’
                                                                                          100
prisons and budgets stretched at the seams:
• Over the next five years, the average                                                    0
                                                                                            1980   1983   1986   1989   1992    1995     1998   2001    2004    2007       2011
  inmate will be more likely to be female or
  elderly—both groups that have special                                                                            Sources: Bureau of Justice Statistics (historical) and JFA Institute
  needs and higher costs.
• In some states, corrections officials, already   State Highlights
    having difficulty hiring and keeping guards
    on the job, are becoming more and more         This report provides forecasts for prison
    concerned about finding and retaining          populations and incarceration rates for all 50
    qualified personnel to staff new prisons.      states. Among its findings:
•   In some states, especially in the West,        • By 2011, without changes in sentencing or
    Midwest and South, methamphetamine                 release policies, Alaska, Arizona, Idaho,
    cases have become significant contributors         Montana and Vermont can expect to see
    to prison growth.                                  one new prisoner for every three currently
•   In the past few years, many states have            in the system.
    enacted enhanced penalties for sex crimes.     •   Similarly, barring reforms, there will be one
    The impact of most of these laws on prison         new prisoner for every four now in prison
    populations and state budgets will be felt         in Colorado, Washington, Wyoming,
    beyond the five-year window of this report.        Nevada, Utah and South Dakota.
                                                   •   Incarceration rates are expected to spike in
                                                       Arizona and Nevada, from 590 and 540
                                                       prisoners per 100,000 residents,
                                                       respectively, to 703 and 599. Particularly
                                                       worrisome is the growth in the population
                                                       of young males, the group at highest risk of
    10 Highest-Growth States                           criminal activity. Both states have recently
    (by percent increase)                              increased their prison population forecasts
                                                       because of the combined impact of
    Montana                            41%             demographics and policies that increase
    Arizona                            35%
                                                       prison terms.
    Alaska                             34%
    Idaho                              34%         •   Louisiana, which has the highest
    Vermont                            33%             incarceration rate among states, with 835
    Colorado                           31%             prisoners per 100,000 residents, expects
    Washington                         28%
                                                       that figure to hit 852 by 2011.
    Wyoming                            27%
    Nevada                             27%         • Florida is anticipated to cross the 100,000-
    Utah                               25%             prisoner threshold within the next five


                                                                                                                        Public Safety Performance Project                                 iii
years, the only state other than Texas and      heinous crime can have on the public’s views
                          California to do so.                            about the appropriate punishment for that
                      •   None of the states is projecting an actual      type of offense and incarceration in general.
                          decrease in its number of prisoners between
                          2006 and 2011. The report projects no           The size of a state’s prison system is
                          growth in Connecticut, Delaware and New         determined by two simple factors: how many
                          York.                                           people come in and how long they stay. Yet
                      •   The Midwest’s prison population continues       both variables are the products of a dizzying
                          to rise primarily because of increases in new   array of influences, from policy-level decisions
                          prison admissions and parole violations.        and the discretion that judges, prosecutors
                          Iowa’s prison population is expected to         and corrections officials exercise in individual
                          increase at a slower rate than other            cases, to the larger forces at work in society.
                          Midwest states.
                      •   Though the Northeast boasts the lowest          During the past three decades, a number of
                          incarceration rates, it has the highest costs   changes in states’ sentencing and corrections
                          per prisoner, led by Rhode Island ($44,860),    policies have been particularly significant.
                          Massachusetts ($43,026) and New York            These include movement from indeterminate
                          ($42,202). The lowest costs are generally in    to determinate sentencing; abolition of parole
                          the South, led by Louisiana ($13,009),          and adoption of truth-in-sentencing
                          Alabama ($13,019) and South Carolina            requirements; lower parole grant rates; passage
                          ($13,170).                                      of “three-strikes” laws; and establishment of
                                                                          sentencing guidelines. While the impact of
                                                                          reforms varies in each state, the states report
                      Driving Forces                                      that these policy decisions are among the major
                                                                          drivers of their prison populations.
                      Predicting the future is a risky business, of
                      course. In Charles Dickens’ Christmas Carol,
                      Scrooge asks the last ghost that appears to         Implications for Public
                      him, “Are these the shadows of the things           Safety and Public Policy
                      that Will be? Or are they shadows of things
                      that May be, only?”                                 It’s a tempting leap of logic to assume that
                                                                          the more people behind bars, the less crime
                      In the world of criminal justice policy, as much    there will be. But despite public expectations
                      as in Dickens’ famed tale, nothing is inevitable.   to the contrary, there is no clear cause and
                      The size and attributes of a state’s prison         effect. In fact, the question of the effect that
                      population are linked to an array of factors.       imprisonment has on crime rates cannot be
                      Population growth and crime rates can be the        solved with simple arithmetic. It requires
                      fuel for this fast-moving train, but the throttle   something more like a social policy calculus.
                      is in the hands of state leaders who make
                      related policy choices. Some of these decisions     The central questions are ones of
                      are made on the basis of careful analysis of        effectiveness and cost. Total national
                      facts and history. Others are predicated on         spending on corrections has jumped to more
                      anecdote and the impact a single, particularly      than $60 billion from just $9 billion in 1980,


iv Public Safety, Public Spending
and yet recidivism rates have barely changed.
More than half of released prisoners are back       Methodology Overview
behind bars within three years. If states want
the best results from their correctional            Forecasting prison populations has grown more sophisticated since
systems over the next five years—both in            the days of estimating using time series or trend analysis, which
                                                    showed what had already happened but failed to make accurate
terms of public safety and public spending—
                                                    projections of future patterns. Today’s more advanced models are
how should they approach the significant
                                                    designed to mimic the flow of the correctional system based on
prison population growth that is anticipated?       probabilities of prison admissions and inmate lengths of stay.
That question is the chief challenge states are
facing. They are not fated to such high rates       This national prison projection report was generated from data from
of prison growth by factors out of their            the states themselves. The federal Bureau of Prisons and 42 states
                                                    (including the 36 states that use advanced simulation methods)
control. The policy choices they make—the
                                                    provided their official forecasts to form the basis of this report. Those
sentencing and release laws, programs and
                                                    jurisdictions accounted for 92 percent of the national prison population
practices they enact and fund—are principal         as of 2005. The remaining eight states were unable to provide
determinates of the size, effectiveness and         projections, so researchers calculated estimates using the states’ own
cost of their corrections systems.                  most recent monthly population counts and available admission and
                                                    release data. Those estimates—for Alaska, Connecticut, Delaware,
The key is for policy makers to base their          Maine, New York, Utah, Wisconsin and Wyoming—are not official
                                                    forecasts.
decisions on a clear understanding of the
costs and benefits of incarceration—and of
                                                    Researchers also contacted each state to obtain the most current costs
data-driven, evidence-based alternatives that       per prisoner. The cost figures included administrative support, program
can preserve public safety while saving much-       services and facility maintenance. If a state contracts with a private
needed tax dollars. To begin the process of         prison company, researchers attempted to incorporate those into the
looking at costs and benefits, state policy         annual cost figure.
makers need to know whether, and at what
                                                    It’s important to note that an increase or decrease in a state prison
rate, their correctional system is likely to
                                                    population will not yield a direct change in operating costs. Some
grow, and how their system’s growth rate            states whose prison populations grow by only a small amount will
compares to that of other states. By providing      experience only marginal cost increases, such as the costs of medical
this comparative data, this forecast can assist     care and food; they will likely not need to hire additional staff or build
states in their efforts to develop cost-effective   new cells. Other states may pass a tipping point and proceed with
options that reduce corrections expenditures        constructing new prisons and taking on new staff.

while protecting public safety.
                                                    It’s possible, too, that the projected population may involve
                                                    disproportionately lower-custody inmates or that a state may employ
Those last two words—public safety—are of           alternative, lower-cost housing methods and divert some offenders into
particular consequence. No policy maker is          community punishments. These scenarios would result in an
likely to (or should) pursue a path that saves      overestimate of future costs if the estimate is made using an average
prison money if it runs a substantial risk of       cost per inmate.
increasing recidivism or crime rates. On the
                                                    Capital costs for corrections are more difficult to project than operating
other hand, an option that can lead to better
                                                    costs. Prison beds cost about $65,000 to construct, but total
public safety outcomes while saving money is        construction cost figures exclude renovation and conversion of
the picture that goes alongside the dictionary      existing bed space.
definition of win-win.
                                                    For these reasons, the report does not provide cost estimates for each
                                                    individual state.


                                                                                 Public Safety Performance Project               v
Table of Contents


     Introduction .....................................................................................................................1

     Forecasting Correctional Populations ........................................................................3
       Micro-simulation Models ..........................................................................................................6
        Accuracy of the Projection Models...........................................................................................7

     National Prison Population Projection Estimates ...................................................9
      Growth of Women Prisoners Will Continue to Outpace Males............................................10
      Age of Inmates (and the Cost of Their Medical Care) is Expected to Rise .........................11
      Corrections Workforce Recruitment and Retention is a Growing Concern .........................11
        Rise in Methamphetamine-related Cases ...............................................................................11
        Impact of Enhanced Sex Offender Sentences Will Be Felt Beyond Five Years .....................12

     Regional and State Trends..........................................................................................13
      Northeastern Region ...............................................................................................................13
      Midwestern Region .................................................................................................................14
      Southern Region .....................................................................................................................15
      Western Region .......................................................................................................................17

     Estimating Current and Future Prison Costs .........................................................18
      Methodological Issues.............................................................................................................19
      Current Operational Costs .....................................................................................................20
      Estimates of Future Operational Costs ..................................................................................21
        Capital Costs...........................................................................................................................22

     The Relationship Between Incarceration and Crime Rates.................................23

     Public Safety, Public Spending:
     The Challenge Ahead for State Policy Makers........................................................25

     Appendix.........................................................................................................................27


                                                                                   Public Safety Performance Project                                 vii
Tables and Figures

                         Table 1:       Adult Correctional Populations, 1980-2005..........................................................2
                         Figure 1:      Schematic Flow of Prison Population Components..............................................4
                         Figure 2:      Crime and Incarceration Rates by State, 2004 .....................................................5
                         Figure 3:      National At-Risk Population: Males Between 18-34.............................................6
                         Figure 4:      Accurate Projections: West Virginia, 2004-2006 ..................................................8
                         Figure 5:      Projections Responding to Change: Nevada, 2005-2006 .....................................8
                         Figure 6:      Projected National Prison Population and Incarceration Rate, 2006-2011 ........10
                         Figure 7:      Projected Change in Regional Incarceration Rates, 2006-2011 .........................10
                         Table 2:       Ohio 10-Year Prison Population Projections, 2007-2016 .....................................14
                         Figure 8:      Projected Year-End Resident Population by Region, 2006-2011 ........................15
                         Table 3:       Nevada 10-Year Prison Population Projections, 2007-2016.................................16
                         Table 4:       Arizona 10-Year Prison Population Projections, 2007-2016 ................................16
                         Table 5:       Costs Per State Prisoner, 1984-2005 ...................................................................21
                         Figure 9:      National Crime and Imprisonment Trends, 1931-2005 .....................................23

                        Appendix

                         Table   A-1:   Key State Data, 2005 ...........................................................................................27
                         Table   A-2:   State, Regional and National Residential Populations, 2005-2011.....................28
                         Table   A-3:   State Prison Populations by Region, 2006-2011 .................................................29
                         Table   A-4:   State Prison Populations by Growth Rate, 2006-2011 .......................................30
                         Table A-5: State Incarceration Rates by Region, 2006-2011 ................................................31
                         Table A-6: State Incarceration Rates by Growth Rate, 2006-2011.......................................32
                         Table A-7: Annual Operating Costs per Inmate...................................................................33
                         Table A-8: Sources of State Prison Population Projections...................................................34
                         Table A-9: Sources of State Inmate Costs .............................................................................36


viii Public Safety, Public Spending
Introduction


         his report estimates the


T
                                                    world in incarceration rates, well above Russia
         future size and cost of the state and      and Cuba, which have the next highest rates
         federal prison systems. It examines        of 607 and 487 per 100,000. Western
the reasons for the projected growth and, since     European countries have incarceration rates
prison expansion is generally intended to           that range from 78 to 145 per 100,000.3
reduce crime, it outlines what we currently
know about the relationship between                 Probation and parole populations have
incarceration and crime rates. Finally, the         skyrocketed alongside the rapid growth in the
report highlights the efforts of some states to     state and federal prison systems. Since 1980,
control corrections spending while protecting       the total correctional population has grown
public safety and holding offenders                 from 1.8 million to over 7 million people
accountable for their actions.                      (Table 1). While the prison population has
                                                    grown at the fastest rate, more than 4 million
The past three decades have witnessed an            adults are on probation, making that the                 At year-end
historic increase in the nation’s penal system      largest component of the correctional system;
                                                                                                      2005, there were
at all levels. In 1970, the state and federal       it too has nearly tripled since 1980.
prison population was less than 190,000. The                                                          almost 2.2 million
latest report by the U.S. Department of Justice     While noteworthy in their own right, national         people—one in
puts the 2005 population at nearly 1.5              trends tend to mask significant state-level
                                                                                                        every 136 U.S.
million. Further, almost 750,000 people are         variation. This is the case both for
incarcerated in local jails, resulting in a total   incarceration (covering jails and prisons)4 and            residents—
incarcerated population of almost 2.2 million,      the population under community supervision              in U.S. jails
or 737 per 100,000 U.S. population.1 Put            (including parole and probation). For
                                                                                                            and prisons.
differently, for every 1,000 U.S. residents,        example, while the national prison
seven are incarcerated either in jail or prison     incarceration rate in 2005 was 491 per
on any given day. Each year, over 600,000           100,000 residents, Louisiana had the highest
people are admitted to state and federal            prison incarceration rate (797 per 100,000)
prisons. A much larger number (over 10              followed by fellow Southern states Texas
million) go to local jails. There are another       (691), Mississippi (660) and Oklahoma (652).
4.3 million ex-convicts living in the U.S.2         Maine had the lowest incarceration rate (144),
                                                    followed by Minnesota (180), Rhode Island
The U.S. imprisons significantly more people        (189) and New Hampshire (192).5
than any other nation. China ranks second,
imprisoning 1.5 million of its much larger          While it is generally true that Southern states
citizen population. The U.S. also leads the         have high incarceration rates while


                                                                                 Public Safety Performance Project          1
national correctional system. Currently, each
    TABLE 1                                                                                       state bears responsibility for forecasting its
    Adult Correctional Populations, 1980–2005                                                     own population. A national forecast such as
                                                                                                  this will have several important uses.
    Population                            1980                   2005         % Change
    Probation                          1,118,097              4,162,536          272%
                                                                                                  First, state policy makers need to know how
    Jail                                 183,988                747,529          306%
    Prison                               319,598              1,461,132          357%             much their correctional system is likely to
    Parole                               220,438                784,408          255%             grow, if at all, so that they at least can ensure
    Total Adults                                                                                  that sufficient funds are available to support
    Under Corrections                  1,842,100              7,155,605             288%
                                                                                                  growth. This is especially true for the jail and
    Adult Population              162.8 Million          222.3 million               36%          prison systems that must maintain standards of
    % of Adults Under                                                                             care for their prisoners. Second, because
    Corrections                              1.1%                  3.2%                           differences in population increases often reflect
    Sources: U.S. Department of Justice, Office of Justice Programs. Prisoners in 2005, Bureau
    of Justice Statistics Bulletin, by Paige M. Harrison and Allen J. Beck (Washington, D.C.:     differences in criminal justice policies,
    November 2006), NCJ 215092; U.S. Department of Justice, Office of Justice Programs.
    Prison and Jail Inmates at Midyear 2005, Bureau of Justice Statistics Bulletin, by Paige M.   understanding such policy differences and their
    Harrison and Allen J. Beck (Washington, D.C.: May 2006), NCJ 213133 and U.S. Department
    of Justice, Office of Justice Programs. Probation and Parole in the US 2005, Bureau of        impact on prison populations and costs can
    Justice Statistics Bulletin, by Lauren E. Glaze and Thomas P. Bonozar (Washington, D.C.:
    November 2006), NCJ 215091
                                                                                                  help policy makers better evaluate whether
                                                                                                  they should pursue reforms. Third, given the
                                  Northeastern states have low rates, there is                    large and increasing amount of taxpayer funds
                                  considerable variation even among states                        being devoted to prison systems, policy makers
                                  from the same region or sharing similar                         want to ensure that their investments in public
                                  crime rates. For example, North and South                       safety are generating their intended results. If
                                  Dakota had low but very different                               other states are slowing the growth of their
                                  incarceration rates in 2005: 208 per 100,000                    prison populations while achieving better
                                  for North Dakota versus double that—443—                        public safety outcomes, such as lower
                                  for South Dakota. In the South, North                           recidivism rates or lower crime rates, policy
                                  Carolina’s incarceration rate is 360 while                      makers want to know that.
                                  South Carolina’s is 525.6 As discussed later,
                                  these pronounced differences in incarceration                   Finally, the costs of constructing and operating
                                  rates often reflect different sentencing laws and               jail and prison systems are an ongoing concern
                                  correctional policies that have been adopted by                 for policy makers. Between 1982 and 2003,
                                  policy makers. In other words, the size and                     national spending on criminal justice increased
                                  attributes of a state’s prison population are                   from $36 billion to $186 billion. Over $61
                                  heavily determined by policy choices.                           billion of that total is allocated to local, state,
                                                                                                  and federal corrections.7 Indeed, corrections
                                  In light of that, it would be valuable for policy               spending—which consists primarily of budgets
                                  makers and the public to understand the likely                  for jails and prisons—grew by more than 570
                                  future outcomes in states that have adopted                     percent during that period, faster than any
                                  varying policies. While the U.S. Department                     other aspect of the criminal justice system.
                                  of Justice provides accurate and                                Given the phenomenal period of growth in
                                  comprehensive historical data on the size and                   correctional populations and its associated
                                  attributes of the various correctional                          costs to the taxpayer, public officials are
                                  populations, there is no organization or agency                 becoming increasingly concerned about what
                                  that provides estimates of the future size of the               the costs will look like in the future.


2 Public Safety, Public Spending
Forecasting Correctional
Populations

        stimating the future size of any


E
                                                  The basic formula is:
        correctional system is part science and       Prison admissions x length of stay (LOS) =
        part judgment. Criminal justice policy        Average Daily Population (ADP)8
is a dynamic phenomenon and is difficult to
predict with a high degree of certainty.          This simplistic formula becomes far more
During the past three decades, we have            complex when one begins to understand the
witnessed a wide array of policy shifts in        myriad factors that can influence admissions
sentencing, including some states abolishing      and the LOS. Relatively minor changes in
parole, moving from indeterminate to              admissions or LOS can have an enormous
determinate sentencing, establishing              impact on the ADP. For example, if the LOS
sentencing guidelines, and adopting truth-in-     in a prison system is 30 months, an increase
sentencing and “three-strikes” laws. Many of      of three months in the LOS would increase
these changes were intended to remove repeat      the ADP by 10 percent. Changes in the LOS
offenders from the streets. But as the cost of    can be achieved by modifying sentence
corrections has skyrocketed, so has interest in   lengths, awarding or rescinding good time
finding cost-effective options that could         credits, changing parole eligibility dates, and
reduce expenditures without jeopardizing          paroling (or not paroling) offenders at either
public safety.                                    their initial parole date or
                                                  at a subsequent parole                 Between probation, parole,
Identifying these options requires sound          hearing.
                                                                                           jail and prison, the U.S.
research, comprehensive analysis and reliable
forecasting techniques to better inform           Figure 1 illustrates the                    correctional population
policy makers and the public about the            various internal and                      exceeds 7 million people.
consequences of current and proposed              external factors that
                                                                                        One in every 32 U.S. adult
policies. Estimating the future prison            influence ADP and
population is the beginning of this enterprise,   therefore influence a                  residents is currently under
not the end. Decision makers need to              forecast of the future ADPs.               correctional supervision.
understand why prison populations are             External factors reflect the
growing and how future changes will affect        interplay of demographic, socio-economic and
the system.                                       crime trends that produce arrests, and
                                                  offenders’ initial entry into the criminal justice
In the simplest terms, prison populations         process. Criminologists have long noted that
(and all correctional populations) are the        certain segments of the population have higher
result of two factors: the number of people       rates or chances of becoming involved in
admitted to prison and how long they stay.        crime, being arrested and being incarcerated.


                                                                                Public Safety Performance Project        3
FIGURE 1
    Schematic Flow of Prison Population Components


                                 Demographics—at risk population


                                             Crime


                                             Arrests


        New                                                             New
        Charge                             Convictions                Charge


                                                                   Probation
                        Prison                 Technical
                                                Violator


                          Technical
                           Violator


      Parole/Community Supervision


                                      Release to Community


4 Public Safety, Public Spending
FIGURE 2
       Crime and Incarceration Rates by State, 2005

                                                   800                                                             LA

                                                   700
        Incarceration Rate per 100,000 residents


                                                                                                                             TX
                                                                                                  MS                    OK
                                                   600                                                             AL
                                                                                                             MO GA     SC AZ
                                                   500                                 ID           MI            FL
                                                                                    KYVA             DECA       AR NV
                                                                    SD                                        CO      TN
                                                                                               WY          AK
                                                   400
                                                                               CTWI            MT    IN OH MD
                                                                                                  IL           NC OR
                                                                           NY NJPA                        KS        NM HI
                                                   300                          WV IA
                                                                                                                                     WA
                                                                          VT   MA        NE                   UT
                                                   200              NH ND        RI   MN
                                                                           ME
                                                   100


                                                    0
                                                         0   1000   2000                3000              4000                5000                 6000

                                                                           Crime Rate per 100,000 residents


                                                                                                                         Source: FBI Uniform Crime Report and BJS


This is known as the “at-risk” population,                               It is unfortunate but true that African-
which generally consists of younger males.                               Americans and Hispanics have significantly
The high crime rate ages are 15-25, while the                            higher arrest and incarceration rates than
high adult incarceration rate is between the                             whites. One must also factor in the extent to
ages of 18 and 35. When the at-risk                                      which these racial and ethnic groups within
population is expected to increase in a                                  these age ranges are also projected to
jurisdiction, one can also expect some                                   increase. As shown in Figure 3, the number
additional pressure on criminal justice                                  of at-risk African-American and Hispanic
resources, all things being equal.                                       males has been increasing over the past few
                                                                         years. States that are projected to have a
Figure 2 shows the association between crime                             larger at-risk population over the next decade
rates (which are produced in part by                                     also are likely to experience continued
demographic and socio-economic trends) and                               pressures on criminal justice and correctional
incarceration rates. The figure plots the crime                          resources based on demographic growth.
and incarceration rates for each state, showing
that states with low crime rates tend to have                            Internal factors reflect the various decision
lower incarceration rates. The spread of states                          points within the criminal justice system that
up and to the right on the graph shows that                              cumulatively determine prison admissions
states with higher crime rates tend to have high                         and LOS. These decisions begin with police
incarceration rates. The last section of this                            and end with correctional officials who,
report summarizes what is known about the                                within the context of the court-imposed
relationship between crime and incarceration.                            sentences, have the authority to release,


                                                                                                          Public Safety Performance Project                         5
criminal justice systems often vest considerable
        FIGURE 3                                                                 discretion in their public leaders who construct
        National At-Risk Population:
                                                                                 these policies and procedures. A complete
        Males Between 18-34
                                                                                 understanding of these complex influences is
          25 m
                                                                                 essential to the accuracy of planning and
          20 m
                                                              White
                                                                                 forecasting a prison or jail population.
           8m

                   Hispanic
                                                                                 Micro-simulation Models
           7m
                                                                                 Traditionally, prison populations were
           6m
                                                                                 estimated using time series or trends analysis.
           5m                                                         Black      This was easy to do since the historic counts
           4m                                                                    were readily available and it required little
                 2000 2001 2002 2003 2004 2005 2006 2007 2008 2009 2010 2011                     —
                                                                                 skill to use such methods. These methods
  Source: U.S. Census Bureau
                                                                                 were very inaccurate, however, especially in
                               recommit, give and restore a wide array of        an environment where policy is very
                               good time credits, and offer supervision and      dynamic. Time series models can show only
                               services that may reduce recidivism.9             what has already occurred; they cannot
                                                                                 estimate future populations based on current
                               For example, one of the most difficult            or future criminal justice policies and
                               numbers to estimate is the number of prison       sentencing legislation.
                               admissions for the next five years. As
                               suggested by Figure 1, people come to prison      To better account for such a complex and
                               for three basic reasons: (1) they have been       dynamic system, a new generation of micro-
                               directly sentenced by the courts to a prison      simulation models has been developed to help
                               term (new court commitments); (2) they have       decision makers estimate the effects of current
                               failed to complete their term of probation and    policies and the likely consequences of specific
                               are now being sentenced to prison for a           policy proposals. These micro-simulation
                               violation of the conditions of their release or   models are designed to mimic the flow of (1)
                               new crime; or, (3) they have failed their term    the current prisoner population, and (2) the
                               of parole (or post-release supervision) and are   expected new admissions over the projection
                               being returned to prison for a violation of the   horizon based on these internal factors. Based
                               conditions of their release or new crime.         on stochastic entity simulation methods, the
                               Almost two-thirds of the estimated 600,000-       models mimic the actual flow of the
                               plus people who are admitted to prison are        correctional system based on current and future
                               those who have failed to complete probation       probabilities of being admitted to prison under a
                               or parole. A projection model thus should         particular legal status, with a certain sentence
                               have a “feedback loop” that captures the          for a certain crime, and being released at a
                               expected rate of probation and parole failures.   certain time based on probabilities of receiving
                                                                                 good time and being released on parole.
                               The impact of recently enacted sentencing         Similarly, each person released to probation or
                               laws, judicial decisions and other criminal       parole has a certain probability of being
                               justice policy choices also must be considered    revoked for a new crime or technical violation
                               in a population forecast. These complex factors   and being returned to prison for a certain
                               also vary from state to state. State and local    period of time before being re-released. All of


6 Public Safety, Public Spending
these “probabilities” are based on the current     Time series or regression models are not able
behavior of the decision makers.                   to employ such techniques and thus are less
                                                   able to demonstrate their accuracy. Moreover,
Accuracy of the                                    because they are based on historical patterns
Projection Models                                  that do not account for contemporary policies
A recurring question about any projection          or laws, they often either over- or
model is its accuracy. In one sense this is the    underestimate short-term developments.
wrong question to ask, since a forecast of any
correctional system is predicated upon the         Figures 4 and 5 highlight recent accuracy
assumptions of future criminal justice policy.     analyses for West Virginia and Nevada, both
Because such policies are constantly in flux,      of which employ simulation models. West
the projection must be modified as lawmakers       Virginia reflects a fairly stable policy
adopt new policies and correctional officials      environment, so the 2004 projection has been
adjust their administrative procedures. For        quite accurate for the past two years.
example, if a parole board implements new          Conversely, the Nevada estimate issued in
parole guidelines that serve to increase the       March 2005 began to display an
rate of parole for low-risk prisoners from 35      underestimate in fall 2005. This was caused
percent to 50 percent, the projection model’s      by a significant and unexpected surge in new
parole grant rates must be similarly adjusted      court commitments, largely from the Las
and thus show a lower forecast. If the             Vegas metropolitan area. The model’s new
legislature adopts a longer sentencing range       court intake estimates were then adjusted
for drug dealers that is not retroactive to the    with the assumption that new admissions
current prisoner population, the new               would continue to grow at the 2006 rather
admission stream must be altered and will          than the 2005 rate. As shown in the graph,
show a higher projection.                          this single change in the new admission
                                                   assumption increased the 10-year forecast by
Despite the nuances of the dynamic policy          over 900 prisoners.
arena, the models must demonstrate that they
would be accurate if policies remain constant.
The micro-simulation models are especially
adept in this regard if they are designed to
model both the current and future correctional
populations. For the first 12 to 18 months of a
projection, the current parole and prison
populations have a large influence on the
forecast since it takes that long for large
numbers of that population to exit. Further, the
micro-simulation models are loaded with the
most current data to reflect current practices
and are then “started” several months in the
past to see if they are mimicking actual
monthly counts of admissions, releases and
populations. Only when this test has been
successful is the forecast deemed “accurate.”


                                                                              Public Safety Performance Project   7
Two of the most significant examples of
                FIGURE 4                                                                                 overestimates occurred in Virginia after it
                Accurate Projections: West Virginia, 2004-2006                                           adopted truth-in-sentencing laws and in
               5800                                                                                      California after it adopted its “three-strikes”
               5600
                                                                                                         mandatory sentencing laws. The Virginia
               5400
                                                                                                         error resulted in a massive over-construction
                                              Actual                                                     plan to build prison beds that were not
    Inmates


               5200                                                                          Projected

               5000
                                                                                                         needed. In subsequent years Virginia was able
               4800
                                                                                                         to cancel some of its construction plans and
               4600
                                                                                                         recoup some of its losses by renting out the
               4400
                                                                                                         surplus prison beds at a profit to states that
               4200
                                                                                                         had crowded systems.
                           Jan    Apr   Jul    Oct     Jan   Apr   Jul      Oct    Jan    Apr    Jul
                            04    04    04     04       05   05    05       05      06    06     06
                                                                                                         In California, the original estimate was that the
  Source: JFA Institute
                                                                                                         “three-strikes” legislation would more than
                                                                                                         double the inmate population from 121,000
               FIGURE 5                                                                                  prisoners in 1994 to over 245,000 in 1999. It
               Projections Responding to Change:                                                         turned out that the prison population rose to
               Nevada, 2005-2006
                                                                                                         160,000. The estimate was off by a staggering
                        13500                                                                            85,000 inmates. The primary source of the
                                                                                  July 2006 projection
                        13000                                                                            error was an assumption that all criminal cases
                        12500
                                                        Actual population
                                                                                                         that fit the criteria for either a second- or third-
              Inmates


                        12000                                                                            strike sentence would be so prosecuted. In
                        11500                                                                            reality, prosecutors used the law to plea
                                   April 2005 projection                                                 bargain a large number of cases to lesser
                        11000

                        10500
                                                                                                         charges. And in several major counties,
                        10000
                                                                                                         including San Francisco and Alameda
                            Jan   Mar   May     Jul    Sep   Nov   Jan      Mar    May     Jul   Sep     (Oakland), prosecutors rarely applied the law.10
                             05   05    05      05      05   05     06      06      06     06     06

  Source: JFA Institute                                                                                  The lesson for “projectionists” is that they
                                              The level of accuracy raises the issue of                  must anticipate adjustments that practitioners
                                              under- and overestimates. It is fair to say that           will make to new policies that strain their
                                              correctional officials are more fearful of an              agencies’ capacities or their local community
                                              underestimate, which may lead to crowding                  standards. For instance, it can’t be assumed
                                              and perhaps a more dangerous prison                        that mandatory sentencing laws will be strictly
                                              environment. Overestimates typically pose                  followed by prosecutors or the courts. For this
                                              little operational problem to prison officials             reason it is useful to discount the estimated
                                              who may welcome a surplus of vacant prison                 effects of such laws.
                                              beds or at least a reduction in existing
                                              crowding. However, overestimates are viewed
                                              with disdain by some state fiscal analysts,
                                              who may feel (rightly or wrongly) that the
                                              projections were manipulated by the prison
                                              agency to secure extra, unneeded funding.


8 Public Safety, Public Spending
National Prison Population
Projection Estimates

         o make an estimate of the


T
                                                    4. The Western region will have the largest
         U.S. prison population, the researchers       prison population increase (18 percent)
         for this report contacted each of the 50      while the Northeast will experience the
states and the federal Bureau of Prisons (BOP)         smallest growth (7 percent).
and requested their current official population     5. There is considerable variation among the
projections. Where available, projections by           states. Montana, Alaska, Arizona, Idaho,
gender were also requested.                            Vermont and Colorado all are poised to
                                                       grow by more than 30 percent under
The BOP and 42 states provided at least a five-        current criminal justice policies.
year prison population forecast. These                 Conversely, Connecticut, Delaware, New
reporting jurisdictions accounted for 92 percent      York and Maryland are expected to have
of the national prison population as of 2005.         little if any growth.
For the remaining eight states, researchers         6. Four states—Florida, California, Arizona
made estimates based on current population            and Texas—and the federal prison system
trends and extrapolated for five years.11             will account for more than 87,000
                                                      additional prisoners, or about 45 percent of
Figures 6 and 7 provide the national and              the total prison population increase.
regional estimates based on the data received
from the states and the BOP and the                 In reviewing these trends
estimates for states with no official projection.   and discussing them with               By 2011, America’s prison
Detailed tables for each state are shown in         the states, researchers                   population is projected to
the appendix. The national and state                learned that a wide array of
                                                                                          increase by 192,000 to over
estimates reveal the following major trends:        factors were influencing
                                                    these estimates. For a                         1.7 million inmates.
1. The nation’s state and federal prison            number of Southern and                     One in every 182 U.S.
   population will reach 1,722,477 by 2011—         Western states, demographic
                                                                                           residents will live in prison.
   an increase of approximately 192,000 over        growth, particularly for the
   a five-year period.                              at-risk population, was a
2. This rate of growth—about 38,400 more            major concern. This was especially true in
   inmates per year—is markedly higher than         Arizona, Nevada and Texas, all of which have
   the growth rate of the past three years.         recently increased their prison population
3. The prison incarceration rate will continue      estimates because of increases in prison
   to grow, from 491 per 100,000 U.S.               admissions for new court sentences or
   residents in 2005 to 511 per 100,000 in          probation revocations. However, incarceration
   2006, then to 550 per 100,000 in 2011.           rates in all three states will grow, meaning that


                                                                                  Public Safety Performance Project         9
inability to reduce
        FIGURE 6:                                                                                                            recidivism rates—all
        Projected National Prison Population                                                                                 contributed to the
        and Incarceration Rate, 2006-2011                                                                                    higher projections.
        US Prison Population                                                                                Inmates per
        in millions                                                                                    100,000 residents
        1.80                                                                                                         560     A region-by-region
        1.75                                                                                              550       540
                                                                                                                             summary of the
                           Incarceration Rate                                              544
                                                                         538                                                 estimates and factors
        1.70                                            530                                                         520
                                         519
                                                                                                       1,722,477             that underpin the
                      511                                                               1,686,495
        1.65                                                                                                        500      estimated growth
                                                                       1,654,668
        1.60                                                                       Prison Population                480      follows. But before
                                                      1,614,808
                                                                                                                             proceeding to these
        1.55                           1,568,822                                                                    460
                                                                                                                             regional variations, a
        1.50       1,530,454                                                                                        440      number of other
        1.45                                                                                                        420      policy-related issues
                                                                                                                             merit discussion.
        1.40                                                                                                        400
                     2006                2007           2008             2009             2010           2011                These issues emerged
                                                                                                                             during researchers’
   Source: JFA Institute                                                                                                      interviews with state
                                                                                                    correctional officials and planners who are
                                                                                                    directly involved in the states’ forecasts.

        FIGURE 7
        Projected Change in Regional                                                                Growth of Women Prisoners Will
        Incarceration Rates, 2006-2011                                                              Continue to Outpace Males
                                                                                                    The female prisoner population, while well
               16%
                                                                                                    below the size of the male prisoner
               14%
                                                                                                    population, has been growing at a faster rate
               12%

               10%
                                                                                                    for many years. The Bureau of Justice
               8%                                                                                   Statistics (BJS), part of the U.S. Department
               6%                                                                                   of Justice, notes in its most recent prison
               4%                                                                                   population report that the female population
               2%
                                                                                                    has grown by 57 percent since 1995,
               0%
                           Northeast        Midwest            South            West
                                                                                                    compared to a 34-percent increase for males.12

                                                                                                    For this forecast, 25 states, covering only
   Source: JFA Institute
                                                                                                    about one-third of the national prison
                                       the greater prison admissions or longer LOS,                 population, were able to provide their
                                       or both, are causing the prisons to grow faster              projections by gender. In these 25 states,
                                       than the general population. In these and other              females are expected to grow at a faster rate
                                       states, state officials reported that the                    (16 percent) than males (12 percent).
                                       cumulative effects of lengthy mandatory prison               Researchers’ interviews with other state
                                       terms adopted in the 1980s and 1990s, reduced                correctional officials suggest that higher
                                       parole grant rates, and high numbers of parole               female growth rates are likely to continue in
                                       and probation violators—coupled with an                      the other states as well.


10 Public Safety, Public Spending
Disaggregating in this manner is desirable         Corrections Workforce
because women have unique security and             Recruitment and Retention
programmatic needs that may not be met if          is a Growing Concern
the size of the female population is not           As their prison populations increase, states
properly estimated. For example, women are         need to find qualified applicants for
typically housed in much lower-security-level      correctional officer positions and other prison
facilities than men and require a lower staff-     jobs. Many of the state officials contacted for
to-inmate ratio. The construction of female        this report expressed concern that even if
facilities is increasingly designed to meet the    they can secure the necessary funding to
unique custody and service needs of women.         build and operate an expanded prison
Also, because the female prison population         system, it will be increasingly difficult to find
has risen faster for the past decade, failure to   qualified workers to fill these positions.
perform separate forecasts by gender could         These officials already face a high turnover
distort growth estimates for women                 rate and a growing number of “baby
prisoners.                                         boomer” employees now nearing retirement.
                                                   A number of Southern states (especially
In addition, females generally pose a              Louisiana, Mississippi and Alabama) are
significantly lower risk to public safety than     hoping to increase salary levels to attract and
males. BJS studies of female recidivism rates      retain qualified staff to work in prisons that
have consistently shown that women have a          are often located in economically depressed
lower recidivism rate than males and are far       rural areas. Such increased salaries will carry
less likely to commit a violent or sex crime       an obvious fiscal burden for state
upon release.13 The disproportionate increases     governments.
in the female prison population, then, are
somewhat ironic.                                   Methamphetamine-related
                                                   Cases are on the Rise
Age of Inmates (and the                            Many states are seeing significant growth
Cost of Their Medical Care)                        in prison admissions related to
is Expected to Rise                                methamphetamine addiction. In Georgia, for
BJS reports that the average age of prisoners      example, meth-related admissions more than
being released to parole has increased from        tripled, from 977 inmates in fiscal years 1999
31 to 34 between 1990 and 1999.14 There are        and 2000 to 3,579 in fiscal years 2004 and
no more recent national data, and states were      2005. With meth offenders currently serving
not able to provide prisoner age projections       an average of 5.5 years in prison, officials
for this report, but policy experts and state      estimate that the cumulative cost of housing
officials are concerned that the aging trend       these inmates alone will exceed $340
will accelerate largely because of the longer      million.15
prison terms being served under various
sentencing and release laws and policies. This     The rise of meth cases is not readily reflected
presents a major fiscal concern for states,        in the current forecast, but correctional
because as the prison population ages, the         officials have become increasingly concerned
medical costs of the corrections system are        that larger proportions of the probation and
expected to rise accordingly.                      parole populations are using the drug and
                                                   thereby increasing the likelihood of probation


                                                                                 Public Safety Performance Project   11
and parole revocations. To control the             The current five-year state projections do not
                      problem and its impact on prisons, many            reflect the long-term effects of such laws. The
                      correctional officials are calling for more        laws typically are not retroactive, and because
                      community-based treatment beds and wider           many of these offenders already spend longer
                      adoption of evidence-based practices for           than five years behind bars, the impact of the
                      treating meth abusers.                             longer sentences will not be felt on
                                                                         populations and budgets for some time
                      Impact of Enhanced Sex                             beyond the next five years. Over the next
                      Offender Sentences Will Be                         two decades, however, one can expect the
                      Felt Beyond Five Years                             number of prisoners convicted of sex crimes
                      Many states have recently passed sentencing        to expand rapidly.
                      laws for sex offenders that require a lengthier
                      period of incarceration and/or a lengthier and
                      more intense period of parole supervision.
                      One example is California, which under the
                      recently passed Proposition 83 requires sex
                      offenders to be tracked electronically for life.
                      This law will no doubt increase the number
                      of parolees returned to prison for technical
                      violations. In Kansas, a law enacted in 2006
                      will result in approximately 150 persons
                      convicted of child sex crimes being sentenced
                      to prison for terms approximately 16 years
                      longer than under earlier sentencing
                      practices.


12 Public Safety, Public Spending
Regional and State Trends


Northeastern Region                                  recidivism reduction initiatives. They funded
The Northeast historically has the lowest            two programs targeting violators, and required
incarceration rates, which will continue to be       the development of a comprehensive re-entry
true well into the next decade. Led by New           plan, with focus on the specific neighborhoods
York, Massachusetts, New Jersey and                  to which most prisoners were returning.
Connecticut, these states are estimating little if
any growth. Part of the explanation for this         Within two years following the development
trend is demographic, as this region is              and adoption of this strategy, Connecticut
estimated to grow slowly. Crime rates also are       went from having one of the fastest-growing
relatively low. The stability of incarceration       prison populations in the nation to
rates results from more than demography and          experiencing a decline steeper than almost
crime rates, however; states also have adopted       any other state. Crime rates in Connecticut
new policies that have controlled prison             also dropped during this period, faster than
population growth. In both Massachusetts             they were falling in the nation overall.
and New Jersey, for example, parole grant
rates have increased while state leaders have        Another big story in the
resisted calls to increase sentencing lengths.       Northeast has been New             Change in five-year projected
                                                     York, where the prison
                                                                                       state prison populations varies
Connecticut may provide one of the most              population has declined
striking and successful examples of policy           from a peak of 72,889 in            radically, from no growth in
intervention. Using data-driven analyses,            1999 to its current level of           New York, Delaware and
Connecticut policy makers identified that            about 63,000. Virtually all
                                                                                            Connecticut to 41 percent
parole and probation violators were driving          of this historic decline has
much of the prison growth. They passed               resulted from dramatic                       growth in Montana.
legislation in 2004 that set a goal of reducing      reductions both in serious
parole and probation revocations by 20               crime and in the number of felony arrests,
percent, and hired 96 new probation officers,        much of which can be linked to the well-
reducing caseloads from approximately 160            known reforms within the New York City
cases per officer in January 2004 to                 police department.16 Indeed, admissions to
approximately 100 cases per officer in June          state prison from New York City fell from
2005.                                                20,580 in 1993 to 8,490 in 2005. While the
                                                     state has not issued a formal prison
As part of a “justice reinvestment” strategy,        population forecast, the most recent trends
Connecticut redirected $13 million of the            show no reason to expect significant increases
expected savings from those reforms into             over the next five years.


                                                                                    Public Safety Performance Project    13
extending parole terms, especially for sex
                                                                                     offenders. Although the Department of
                                                                                     Corrections has expanded the programmatic
                                                                                     opportunities available to inmates, and linked
                                                                                     participation to additional good-conduct
                                                                                     credits, these efforts have not offset the
                                                                                     impact of sentencing initiatives enacted in
                                                                                     Illinois during the late 1990s.

                                                                                     Ohio had been experiencing declining prison
                                                                                     populations since 1999 as a result of a
                                                                                     sentencing reform initiative. Now the state is
                                                                                     experiencing increases because of higher-
                                                                                     than-expected prison admissions. A surge in
                                    Midwestern Region                                admissions of white females from a number
                                    The prison population of the Midwest             of rural counties has been especially
                                    continues to grow, primarily as a result of      dramatic. Based on these developments, Ohio
                                    increases in prison admissions from both new     estimates it will add over 17,000 inmates to its
                                    court admissions and parole violations. In       prison population over the next 10 years, a
                                    some states the long-term effects of truth-in-   37-percent increase. The female population
                                    sentencing laws that were enacted more than      will grow at an even faster rate of 47 percent.
                                    a decade ago are now affecting lengths of
                                    stay. In Illinois, for example, prison           Kansas is another Midwestern state that has
                                    admissions have increased every year, with       changed its direction. Between 2003 and 2006,
                                    the system thus setting new highs annually.      the prison population remained fairly stable.
                                    Parole violation rates are at a record high,     With the passage of new child sex offender
                                    and policy makers have enacted several laws      legislation and increases in the number of
                                                                                     offenders being imprisoned for violating
                                                                                     probation, the state’s latest forecast shows that
     TABLE 2
                                                                                     the prison population will increase from
     Ohio 10-Year Prison Population Projections,                                     approximately 9,000 to 11,231 by 2016. These
     2007–2016                                                                       projections would be even higher were it not
                                                                                     for recent legislative actions and correctional
     Date                      Male                    Female      Total
     2006                      43,965                   3,554      47,519            policy changes that will hold technical parole
     2007                      45,485                   3,726      49,211            violators accountable with graduated sanctions
     2008                      47,563                   3,985      51,548            prior to returning them to prison.
     2009                      49,354                   4,249      53,603
     2010                      50,889                   4,416      55,305
     2011                      52,625                   4,598      57,223            Iowa provides an interesting example of a
     2012                      53,832                   4,699      58,531            state in which the prison population is
     2013                      55,384                   4,802      60,186            projected to grow, but at a slower rate than
     2014                      56,941                   4,914      61,855
                                                                                     other Midwestern states. There have been
     2015                      58,184                   5,088      63,272
     2016                      59,756                   5,214      64,970            fewer new court commitments for the state in
     % Change                   36%                     47%         37%              recent years, although that has been
     Note: 2006 figure is the actual population as of 10/2/06.                       somewhat offset by higher rates of probation


14 Public Safety, Public Spending
and community
                               FIGURE 8
supervision (parole)
                               Projected Year-End Resident Population
admissions. To                 by Region, 2006-2011
control its prison
                                320 m
population, Iowa also
relaxed its truth-in-                                                                                      Total
                                290 m
sentencing laws,
dropping its                    120 m

requirement of time                                                                                        South
                                110 m
served from 85
percent to 70                   100 m

percent, and
                                 80 m
increased the number
of paroles. As a                 70 m                                                                      West

result of these                                                                                          Midwest
                                 60 m
changes, Iowa’s
growth rate is                   50 m
                                                                                                         Northeast

projected to be low
for the next five                40 m
                                             2006         2007          2008         2009         2010               2011
years. The long-term
                                                                                                                     Source: JFA Institute
estimates are higher,
however, because of the long-term effects of        which has one of the largest state prison
other decisions the state has made, such as         populations, is estimated to grow by an
abolishing or restricting parole for certain        additional 13,656 prisoners over the next five
crimes and increasing sentences for sex             years. Florida, another large state, will
offenders. Iowa estimates its prison                incarcerate more than 100,000 people by
population will rise from 8,737 in 2005 to          2011. At the same time, Maryland and
11,240 in 2015. As in Ohio, the female              Delaware have stable population trends.
population is projected to grow faster than         These states have been very active in
the male population.                                adopting a variety of
                                                    reforms designed to control
Southern Region                                     prison population growth.
                                                                                            By 2011, the imprisonment
The Southern states traditionally have had                                                       rate of the South will
the highest rates of incarceration, and that        Texas’s prison system will                       exceed that of the
will continue to be the case. Figure 8 shows        continue to grow in part
the projected populations of the four regions,      because of simple
                                                                                              Northeast by 80 percent.
with the South having the greatest projected        demographics: the state is
growth. Yet the forecast shows Southern             expected to grow by more than 2.3 million
states moving in different directions over the      residents over the next five years, for a total
next five years.                                    population of over 25 million. However, its
                                                    incarceration rate is projected to grow as well,
Some Southern states, such as Texas, Florida,       the result primarily of low parole grant rates
Georgia, South Carolina and West Virginia,          and a high number of probation revocations.
are projecting significant increases. Texas,        Texas policy makers have begun to evaluate


                                                                                  Public Safety Performance Project                          15
changes on both fronts to help slow the
     TABLE 3                                                                                      anticipated growth. The state parole board is
     Nevada 10-Year Prison Population Projections,                                                analyzing its compliance with parole
     2007–2016                                                                                    guidelines and may change its decision-
                                                                                                  making criteria. And in their 2007 session,
     Year                        Male                        Female      Total
                                                                                                  Texas lawmakers are expected to consider
                               Population                   Population Population
     2005                        11,075                        1,008     12,083                   major policy initiatives to reform probation,
     July 2006                   11,662                        1,134     12,796                   increase intermediate sanctions and expand
     2006                        12,081                        1,158     13,239                   treatment capacity in the correctional system.
     2007                        12,496                        1,236     13,732
     2008                        12,984                        1,305     14,289
     2009                        13,727                        1,402     15,129                   In Louisiana, partly in response to the
     2010                        14,378                        1,484     15,862                   devastation caused by hurricanes Katrina and
     2011                        15,188                        1,576     16,764                   Rita, the state legislature passed several bills
     2012                        15,935                        1,657     17,592
                                                                                                  designed to reduce the length of incarceration
     2013                        16,727                        1,755     18,482
     2014                        17,515                        1,849     19,364                   modestly by granting more good time to
     2015                        18,243                        1,957     20,200                   prisoners who complete treatment programs
     2016                        19,066                        2,057     21,123                   and have satisfactory work conduct records.
     Numeric Change 2006 – 2016   6,985                         899       7,884
                                                                                                  The state has also enacted a law limiting to
     Percent Change 2006 – 2016   57.8%                       77.6%      59.6%
     Note: Numbers represent end of calendar-year figures (with the exception of the July 2006
                                                                                                  90 days the amount of time a probation or
     figure, which represents the July 31, 2006, population). Year 2005 and July 2006 rows show   parole technical violator can serve in prison
     actual population figures.
                                                                                                  for a first revocation. Louisiana also is
                                                                                                  launching a number of reforms to expedite
                                                                                                  parole hearings. Its prison population is
     TABLE 4
                                                                                                  expected to rise by 4 percent over the next
     Arizona 10-Year Prison Population Projections,
                                                                                                  five years.
     2007–2016

     Year                       Male                         Female      Total
                                                                                                  Maryland and West Virginia have adopted
                              Population                    Population Population                 new parole guidelines that increase parole
     2005                       30,626                         2,909     33,535                   grant rates for low-risk prisoners. The
     July 2006                  31,837                         3,062     34,899                   Georgia parole board also relaxed its self-
     2006                       32,415                         3,228     35,965
     2007                       34,814                         3,375     38,189
                                                                                                  imposed rule that required certain offenders
     2008                       36,958                         3,687     40,645                   to serve 90 percent of sentence, allowing
     2009                       39,672                         3,942     43,614                   some inmates in that group to be considered
     2010                       42,182                         4,210     46,392                   for earlier release. Maryland also enacted
     2011                       43,933                         4,388     48,381
     2012                       45,834                         4,557     50,391
                                                                                                  new parole hearing procedures to ensure that
     2013                       47,243                         4,812     52,055                   prisoners who are being granted parole are
     2014                       48,650                         4,980     53,630                   actually released when they become eligible.
     2015                       49,841                         5,054     54,895                   In addition, the Maryland parole board
     2016                       51,008                         5,216     56,224
     Numeric Change 2006 – 2016 19,171                         2,154     21,325
                                                                                                  adopted narrower length-of-stay ranges to
     Percent Change 2006 – 2016 60.2%                          70.3%     61.1%                    reduce how long some offenders are
     Note: Numbers represent end of calendar year figures (with the exception of the July 2006    incarcerated before being paroled.
     figure, which represents the July 31, 2006, population). Year 2005 and July 2006 rows show
     actual population figures.


16 Public Safety, Public Spending
Western Region                                       probation for repeat                 Arizona’s prison population
Virtually all of the Western states, with the        offenders, with a few
                                                     specified exceptions. This
                                                                                             is projected to increase by
exception of California and Oregon, will
increase their prison populations by 20              collection of varied trends            more than 60 percent over
percent or more. While Montana will have             and developments could                            the next decade.
the greatest percentage increase, Arizona,           make Arizona a leader in
California and Colorado will see the greatest        prison growth. As shown in Table 4, the 10-
growth in absolute numbers in the West.              year forecast shows the state’s prison
                                                     population increasing to 56,224.
This region’s estimated growth is in part the
result of demographics. For example, while           California also is a determinate state with no
the U.S. population is expected to grow by           discretionary parole. However, it actually
approximately 4.5 percent in the next five           lowered its fall 2006 population projection
years, the Western region will increase by 6.4       from its spring 2006 estimate because of
percent. Arizona and Nevada’s populations            lower-than-expected growth in new court
are expected to increase by a dramatic 13            commitments. The long-term estimate is for
percent and 14 percent, respectively.                continued growth, because of both population
                                                     increases in the at-risk age cohort and the
Nevada, which has a mostly discretionary             cumulative effects of the state’s two- and
release system, has significantly increased its      three-strikes legislation. The state also returns
10-year forecast, as the state experienced           an extremely high number of released inmates
larger-than-expected admissions from the Las         to prison, especially for violations of their
Vegas metropolitan area. Despite efforts to          terms of supervision. These ominous trends
counteract this surge through a higher parole        have led Governor Arnold Schwarzenegger to
grant rate, Nevada is now poised to house            propose reducing or eliminating formal parole
one of the fastest-growing prisoner                  supervision for low-risk offenders and
populations in the nation. Its prison                establishing a sentencing commission.
population is projected to increase from
about 13,200 in 2006 to over 21,000 by 2016
(see Table 3). As in other states, the female
population is expected to increase at a faster
rate than the male population.

Arizona is a determinate sentencing state with
an 85-percent truth-in-sentencing law for all
prisoners, giving it little short-term flexibility
to moderate inmates’ length of sentence and
temper its growth. The recently passed
Proposition 301 negates the mandatory
probation provision in the criminal code for
first- and second-offense drug possession for
methamphetamine offenses. Further, the
Maricopa County Attorney’s Office recently
announced a new policy to disallow pleas to


                                                                                  Public Safety Performance Project        17
Estimating Current
   and Future Prison Costs

                            n addition to forecasting the


                       I
                                                                          buildings, renovation of existing structures
                            national prison population over the next      and equipment. Unlike operating costs,
                            five years, this report estimates the         capital expenditures can fluctuate
                       additional fiscal costs of the expanding state     dramatically from year to year depending on
                       and federal prison systems. Based on               decisions to build or not build new facilities.
                       calculations described in detail below,            For example, it may require at least five years
                       researchers estimate that prison operating         to open a new prison once a state has
                       costs will increase by at least $2.5 billion per   decided to build one. A significant amount of
                       year to as much as $5 billion per year by          time is needed to identify an appropriate site,
                       2011. The price of building new prison beds        develop the necessary architectural plans,
                       could reach $12.5 billion. In sum, the             prepare the site for construction and secure
                                         estimated 192,000 new            the necessary building permits from state and
         The U.S. may need an            prisoners could cost as much     local authorities. The actual construction can
    additional $27.5 billion over        as $27.5 billion over the next   often take two years with the normal delays
                                         five years.                      incident to any construction schedule. The
            the next five years to
                                                                          costs associated with a construction project
    accommodate projected prison         The cost of a prison system      can show up during the fiscal year in which
       expansion and operations.         is traditionally separated       the funds were authorized or be recorded as
                                         into two broad categories:       costs are incurred.
                       operational and capital. Operational costs
                       reflect the day-to-day expenses of operating a     Since 1984, the U.S. Department of Justice
                       correctional facility, including the central       has conducted periodic cost analyses for
                       office and support services surrounding that       each state and the District of Columbia; the
                       facility. While the largest component of           most recent study was published in 2004 and
                       operational costs is personnel (salary and         used 2001 figures.17 At that time, it was
                       fringe benefits), this category also reflects      reported that state correctional agencies
                       items such as utilities, food, office and          spent $29.5 billion on correctional facilities,
                       medical supplies, communication services,          with $28.4 billion spent on operating
                       transportation, program services and a             expenses and $1.1 billion on capital costs.
                       variety of contracted support services such as     (Approximately two-thirds of the operating
                       electrical, building maintenance and               costs were linked to salaries and fringe
                       information technology.                            benefits.) With 1,252,743 prisoners in
                                                                          custody in 2001, the average (mean) annual
                       Capital costs are generally limited to one-time    cost per prisoner was $22,650.
                       purchases of land, construction of new


18 Public Safety, Public Spending
Looking back, a comparison suggests that the     1. Regional and State Variation in Costs. As noted
costs per prisoner stabilized between 1996       above, there is considerable variation across
and 2001. The 1996 cost analysis found that      the regions and even among the states within
the average cost per inmate had steadily         a region. If one region or only certain states
increased from $16,300 in 1984 to $18,400 in     from certain regions are experiencing the bulk
1990 and $20,100 in 1996, using constant         of the increases, the cost estimates must
1996 dollars. In its more recent report, BJS     account for these regional and state variations.
noted that when adjusted for inflation, the
1996 cost per prisoner in 2001 dollars was       2. Marginal Versus “Fully Loaded” Operational
$22,515, which was only slightly below the       Costs. An increase or decrease in a state prison
actual 2001 figure of $22,650.                   population will not yield a direct,
                                                 proportionate increase or decrease in
Just as incarceration rates themselves vary      operating costs.18 This is because some states
widely by state, the 2001 BJS report found       whose prison populations may grow by only
considerable variation among state operating     a small amount likely will absorb that growth
costs. The most expensive prison systems         in existing facilities and with current staff.
tended to be in the Northeast region ($33,037    They would experience only marginal cost
per prisoner per year) and the least expensive   increases for medical care and daily costs
were in the Southern region ($16,479). The       such as water, food, electricity and gas.            Prison beds each
least expensive states were Alabama ($8,128),                                                              cost between
Mississippi ($12,795), Missouri ($12,867),       3. Tipping Point Effects. Related to the marginal
Louisiana ($12,951) and Texas ($13,808)—the      cost issue is the possibility that a very small
                                                                                                        $25,000 and
same states that tended to have the highest      increase in a state’s prison population could            $100,000 to
incarceration rates. The most expensive states   trigger a major increase in costs per prisoner.      build, depending
were Maine ($44,379), Rhode Island               This could result if in the past an agency has
($38,503), Massachusetts ($37,718),              been using controlled crowding measures to
                                                                                                              on inmate
Minnesota ($36,836), New York ($36,835),         control costs. However, at some “tipping” point          security level.
Alaska ($36,730), and Oregon ($36,060).          a modest increase in the prison population may
                                                 result in a decision to construct and staff one
While wages and benefits account for much        or more new prisons. This in turn would
of the variation among the states, the other     significantly increase the cost-per-inmate figure.
key factor is the inmate-to-staff ratio. The
BJS report showed that Maine had the lowest      4. Differences in Cost-containment Approaches
inmate per staff ratio (1.7 inmates per          Adopted by the States. States use very different
employee), while Alabama had the highest         approaches to reduce or control their costs
(6.8). Lower numbers of correctional officers    for a growing prison system. Some contract
per inmates can reduce costs but also raise      with private prisons or local jails, while
risks to the safety of staff and inmates.        others simply start reducing programs and
                                                 converting program space to housing units.
Methodological Issues                            Because each state will approach its growth
A number of methodological challenges make       situation differently, it would be useful to
estimating future prison costs problematic.      identify those approaches and make the
Several approaches are available, but each       appropriate adjustments.
must be sensitive to the following issues.


                                                                               Public Safety Performance Project            19
5. Average Costs. Related to the points above, an   private prison company, researchers made
                      estimate that uses an average cost per inmate       every attempt to ensure those costs were
                      may well overestimate true future costs if the      incorporated in the annual cost figure.
                      state applies alternative housing methods or
                      changes sentencing or release laws and              Each state’s cost-per-inmate rate was compared
                      practices, or if the projected population will      with the BJS 2001 figure. If there was a
                      include a disproportionate number of lower-         significant difference, researchers contacted the
                      cost inmates. There are significant differences     state to discuss the matter and then made a
                      in the cost of housing minimum-, medium-            determination of the most accurate cost-per-
                      and maximum-custody prisoners, males and            year figure. If a state did not reply to the
                      females, healthy and sick, young and old, etc.      request, researchers used the 2001 figures and
                      Unless these differences are accounted for, the     then adjusted them for inflation, using the
                      estimated costs may be inaccurate.                  estimates provided by the federal Bureau of
                                                                          Labor Statistics.19 Nonetheless, there were
                      Any estimate of future costs should take into       some major differences between the 2001 and
                      account, or at least acknowledge, that the          FY 2005-06 numbers that have not yet been
                      future average cost per inmate may vary             accounted for.
                      based on these and other factors, and
                      therefore is difficult to estimate.                 Using this approach, the current average
                                                                          annual operational cost per prisoner for the
                      Under ideal circumstances, another                  states was $23,876. For the federal Bureau of
                      comprehensive survey would be completed to          Prisons (BOP) the cost was $23,429. Table 5
                      duplicate the detailed state-by-state census the    summarizes the trends in costs per state
                      BJS conducted in 2001. Unfortunately, a             prisoner from 1984 to FY2005-06 based on
                      study of this nature was beyond the resources       the BJS data and this report’s survey of the
                      of this research effort. Also, the purpose of       50 states, controlling for inflation. Whether
                      this report was solely to estimate the possible     one uses 1996 or 2005 inflation-adjusted
                      cost to the state and federal government for        figures, the pattern is the same: a steady
                      corrections in 2011. It’s simply not feasible to    increase from 1984 to 1996 followed by
                      claim that such costs certainly will occur,         relative stability through 2001 and then a
                      because states could adopt a variety of yet-        decline in FY 2005-06.
                      unknown cost-saving strategies. However,
                      because it is clear that costs will increase by     The decline in FY2005-06 operating costs
                      some amount as a result of the large projected      could be the result of several factors. First, for
                      growth in the prison population, it is useful to    each of the other years, cost data were
                      estimate what those costs could be.                 obtained from BJS, and BJS data may be
                                                                          different from the information researchers
                      Current Operational Costs                           received from the states for this report. But if
                      Researchers for this report contacted each          the decline is real, then it may be attributed to
                      state to obtain its most current cost per           other factors. For example, the largest
                      inmate. These cost rates included                   increases in the nation’s prison population
                      administrative support, program services            have occurred in the West and South, where
                      (public and contracted), and facility               costs per prisoner tend to be lower, driving
                      maintenance. Where a state contracts with a         down the overall average costs. There have


20 Public Safety, Public Spending
been efforts to make
corrections more             TABLE 5

efficient through            Costs Per State Prisoner, 1984–2005
procurement reforms
                             Cost per        1984              1990            1996             2001           FY2005–
and privatization of a
                             inmate                                                                            2006
variety of services.         1996 Dollars    $16,300           $18,400         $20,100          $20,065        $19,181
And there is the             2005 Dollars    $20,289           $22,903         $25,019          $23,941        $23,876
possibility that
crowding more
prisoners in existing facilities has reduced the       Estimates of Future
average cost per prisoner.                             Operational Costs
                                                       Researchers made two estimates of future
Table A-7 in the appendix shows the 2001 and           operational costs. Under the first, researchers
FY 2005-06 costs per state, both with and              multiplied the current (FY2005-06) costs per
without adjustments for inflation. As with the         prisoner obtained from each state and the BOP
previous BJS reports, the 2005 data show               by the projected 2011 prisoner populations.
                                                                                                            Federal and state
major differences among the states and the             Through this method, they took into account           governments are
regions. The Northeast continues to have the           the significant variation in costs per prisoner by    projected to need
highest costs per prisoner, led by Rhode Island        state. However, this estimate does not control
($44,860), Massachusetts ($43,026) and New             for marginal costs, tipping effects or innovative
                                                                                                                   as much as
York ($42,202). The lowest rates are largely in        methods for controlling costs in the face of                $15 billion
the South, led by Louisiana ($13,009),                 population increases. This is the typical                 in additional
Alabama ($13,019), South Carolina ($13,170)            method used by the states in making fiscal
and Mississippi ($13,428).                             impact statements on pending legislation or
                                                                                                            operational funds
                                                       administrative reforms. There typically is no             over the next
The table also shows that some states have             effort to account for marginal costs or to assess            five years.
significantly increased or lowered their costs         what the actual cost increases have been in the
per prisoner, even when adjusted for inflation.        past for each inmate increase in the prison
States that have lowered their costs include           population. One should assume that, as a
Oregon, Maine, Minnesota, Michigan, Ohio,              result, such estimates by the states are too high.
South Carolina and Hawaii. States where the
rates have increased significantly are                 Using this approach, the state and federal
California, Alabama, Rhode Island, New York,           operational budgets, which totaled just under
Alaska and Massachusetts.                              $35 billion in 2005, would increase by an
                                                       estimated $5 billion a year to almost $40
In some of the states—New York,                        billion annually by 2011 in constant dollars.
Massachusetts, Maryland and Rhode Island—              In cumulative terms, this 14-percent increase
the cost-per-inmate rate has increased but             means the states and federal government
there has been an associated decline or                would spend a cumulative $15 billion in
leveling off in the prison population. So their        operating costs over just the next five years
prison populations have dropped or stabilized          to accommodate the projected growth.
but the “fixed costs” of operating their prison
systems continue to increase.                          Under the second (and more conservative)
                                                       method for estimating future operating costs,


                                                                                     Public Safety Performance Project            21
researchers calculated the actual cost changes     need for additional bed capacity. There also
                      between 2001 and FY2005-06 in relation to          are many ways by which states fund prison
                      the change in the prisoner population. This        construction costs that may not fully surface
                      method assumes no mechanical incremental           during the projection period. For example, if
                      increase in the operational budgets for each       prison construction is being funded through a
                      additional prisoner added to the daily             30-year bond, the “true” cost of the new beds
                      population. The BJS report and the state           will be far above the actual construction costs
                      survey conducted for this report show that         because of debt service on the bond.
                      while the prisoner population increased from
                      1,345,217 in 2001 to 1,480,223 by the end of       Nonetheless, it is important to make some
                      2005, the total operating budgets for the states   estimate of the number of new beds each
                      only increased from $28,374,273 in 2001 to an      state and the BOP would need to construct
                      estimated $30,802,574 in FY2005-06.                based on their projections and the
                                                                         construction costs associated with this bed
                      Assuming the BJS 2001 and the state-reported       demand. In general, the states reported
                      FY2005-06 cost comparisons are valid for           construction costs that ranged from $25,000
                      most states, the marginal annual cost for          for a minimum-security bed to more than
                      housing each additional prisoner was $13,797       $100,000 for a maximum-security cell.
                      (not adjusted for inflation).20 This is 57         Because there are no “average” estimates,
                      percent below the $23,876 figure cited earlier.    researchers believe the best approximation to
                      If one applies the $13,797 rate to the projected   use is a midpoint of $65,000 in capital costs
                      192,000 increase in prisoners, the projected       per bed. This figure reflects what most would
                      additional costs to state prison budgets by        consider the costs of a “typical” medium-
                      2011 would be $2.5 billon annually in              security bed, which covers the largest custody
                      constant dollars, rather than the $5 billion       level of most prison systems.
                      cited earlier. That would accumulate to an
                      additional $7.5 billion in prison operations       Applying the $65,000 estimate of
                      spending over the next five years.                 construction costs to the projected need for
                                                                         192,000 additional prison beds, the total
                      Capital Costs                                      construction costs would be approximately
                      Estimating how much money the states and           $12.5 billion in 2006 dollars. This estimate
                      the federal government are likely to spend on      may be conservative, as it excludes
                      prison construction over the next five years is    renovation or conversion of existing prison
                      a tenuous undertaking. As described above,         bed space and assumes no financing costs.
                      some of the projected inmate growth may be         For example, California’s Governor
                      averted by changes in sentencing or release        Schwarzenegger recently requested a total of
                      policies. Even if growth is not averted, states    $10.9 billion in mostly bond financing to
                      may choose to accommodate new inmates in           construct a combination of 78,000 jail, prison,
                      existing facilities by double- or triple-celling   and juvenile correctional beds—an average of
                      inmates, converting program space into             approximately $135,000 per bed. Similarly,
                      dormitories or other means. On the other           Colorado has announced that it will need to
                      hand, in some states construction costs may        build a number of 1,000-bed prisons at a cost
                      be related to the need to replace aging and        of $87,000 per bed.
                      dysfunctional facilities, not any projected


22 Public Safety, Public Spending
The Relationship
Between Incarceration
and Crime Rates
          iven the projected increase


G
                                                                                                                  To demonstrate that incarceration causes
          in the prison population and                                                                            crime to go up or down, one must show (1)
          associated costs, it is useful to                                                                       that there was an increase or decrease in
review the potential impact of further                                                                            incarceration before the crime rate changed
incarceration on public safety. There has been                                                                    (temporal assumption); (2) that a statistical
much political and academic debate on the                                                                         relationship existed between crime and
relationship between the use of incarceration                                                                     imprisonment rates after the change in
and crime rates.21 The common expectation is                                                                      incarceration rate (empirical association); and
that crime rates will decline as the number of                                                                    (3) that there are no other factors that could
people in prison increases, and that crime will                                                                   explain the change in the crime rate (non-
increase if incarceration rates fall. The logic of                                                                spurious assumption). For example, crime rates
this argument is that the crime rate falls when                                                                   may have declined as a result of a decline in
we incapacitate people who are committing                                                                         the number of welfare recipients, the aging of
crimes and deter those who might otherwise                                                                        the baby boomers, more effective community
become involved in criminal activities absent                                                                     policing, or many other factors.
the threat of imprisonment. A different
contention is that other social and economic                                                                      Figure 9 shows that the increase in national
factors, such as poverty rates and education                                                                      crime rates beginning in 1964 was not
levels, have a greater
impact on crime than
imprisonment rates.                                     FIGURE 9
The general                                             National Crime and Imprisonment Trends, 1931-2005
consensus among                                                                                                                                                                            (Sentenced Inmates in State and Federal Institutions,
                                                    (Sentenced Inmates in State and Federal Institutions,


                                                                                                            600                                                                     7000
criminologists is that
crime rates are the                                                                                         500                                                                     6000

product of a complex
                                                                  per 100,000 residents)


                                                                                                                                                                                    5000
                               Incarceration Rate


                                                                                                                                                                                                         per 100,000 residents)


                                                                                                            400
set of factors,
                                                                                                                                                                                                                                                   Crime Rate


                                                                                                                                                                                    4000
including but not                                                                                           300
                                                                                                                                Crime Rate

limited to                                                                                                                                                                          3000

                                                                                                            200
imprisonment.                                                                                                                                             Incarceration Rate        2000

                                                                                                            100                                                                     1000


                                                                                                             0                                                                      0
                                                                                                                  1931
                                                                                                                  1933
                                                                                                                  1935
                                                                                                                  1937
                                                                                                                  1939
                                                                                                                  1941
                                                                                                                  1943
                                                                                                                  1945
                                                                                                                  1947
                                                                                                                  1949
                                                                                                                  1951
                                                                                                                  1953
                                                                                                                  1955
                                                                                                                  1957
                                                                                                                  1959
                                                                                                                  1961
                                                                                                                  1963
                                                                                                                  1965
                                                                                                                  1967
                                                                                                                  1969
                                                                                                                  1971
                                                                                                                  1973
                                                                                                                  1975
                                                                                                                  1977
                                                                                                                  1979
                                                                                                                  1981
                                                                                                                  1983
                                                                                                                  1985
                                                                                                                  1987
                                                                                                                  1989
                                                                                                                  1991
                                                                                                                  1993
                                                                                                                  1995
                                                                                                                  1997
                                                                                                                  1999
                                                                                                                  2001
                                                                                                                  2003
                                                                                                                  2005


                                                                                                                                                              Source: FBI Uniform Crime Reports, BJS


                                                                                                                                               Public Safety Performance Project                                                                                23
predated by a drop in the incarceration rate.    A recent review conducted by the Vera
                      Whatever caused the crime rate to increase       Institute of Justice of all the major studies of
                      from 1965 to 1974, therefore, was not a          the relationship between incarceration and
                      change in imprisonment, which remained           crime shows disparate findings, with different
                      stable until 1975 and then started increasing    estimates of whether the relationship exists,
                      after crime rates had stabilized.22 Some         what the relationship may be, and even
                      experts posit that while the increase in crime   whether incarceration rates at some point
                      rates that began in 1965 may have been           may actually increase crime.25 The Vera
                      caused by other socio-economic and               review found that “the most sophisticated
                      demographic factors, the significant increase    analyses generally agree that increased
                      in the use of imprisonment has helped lower      incarceration rates have some effect on
                      crime rates. Meanwhile, after 1975, policy       reducing crime,” accounting for perhaps 25
                      makers passed many laws that increased the       percent of the drop in crime during the
                      probability of being sentenced to prison         1990s. But “analysts are nearly unanimous in
                      rather than to jail or probation, and            their conclusion that continued growth in
                      dramatically increased the length of those       incarceration will prevent considerably fewer,
                      prison sentences.                                if any, crimes than past increases did and will
                                                                       cost taxpayers substantially more to
                      A decade ago, James Q. Wilson suggested          achieve.”26
                      that the U.S. had reached a tipping point of
                      “diminishing returns” from our investment in
                      prisons.23 According to Wilson, judges have
                      always been tough on violent offenders and
                      have incarcerated them for relatively long
                      sentences. However, as states expanded
                      incarceration, they dipped “deeper into the
                      bucket of persons eligible for prison,
                      dredging up offenders with shorter and
                      shorter criminal records.”24 Increasing the
                      proportion of convicted criminals sent to
                      prison, like lengthening time served beyond
                      some point, has produced diminishing
                      marginal returns in crime reductions. This
                      does not mean an absence of returns—just
                      that the benefit to public safety of each
                      additional prisoner consistently decreases.


24 Public Safety, Public Spending
Public Safety,
Public Spending:
The Challenge Ahead
for State Policy Makers
     t’s hard to place a value on the


I
                                                   system to produce the best possible outcomes
     peace of mind and sense of justice that a     at the best price. This means less crime and
     victim, his or her loved ones, and society    fewer victims, lower recidivism rates, and
as a whole, receive when an assailant is locked    more resources for investments like education,
away behind bars. This powerful and rightful       health and economic development.
response, perhaps more than any other factor,
drives states to build more and more prisons.      Driven by hard data, the projections in this
                                                   report clearly outline for state policy makers
But Americans expect the corrections system        the increases in their prison populations, and
to do more than just punish.27 They expect it      worsening cost crises some are facing. States
to protect public safety and reduce crime—by       will ignore these facts at their own peril. If
deterring would-be criminals, by separating        nothing changes, taxpayers will spend as much
the most dangerous people from society, and        as $27.5 billion more on prisons over the next
by helping lower-risk offenders and inmates        five years, and the jury is still out as to
returning to society become productive, crime-     whether that investment will yield
free citizens.                                     commensurate results in crime control.


States pay a high price for these services.        This report does raise red flags, but it also can
Prisons are the fourth-largest state budget item   be used to help diagnose problems rooted
behind health, education and transportation.       within state corrections systems. Throughout
And the effect of corrections spending on          the report, and in accompanying state profiles,
other state priorities is particularly strong as   Pew’s Public Safety Performance Project
almost all of it comes from the states’ own        showcases states that are examining the
coffers, with minimal reliance on federal aid.     performance of their sentencing and
By contrast, the majority of health care           corrections systems and using that data to
funding in many states comes from the federal      determine the steps necessary to improve their
government, primarily through Medicaid.            outcomes.


The high cost and high stakes of corrections       The profiles highlight states that have
rightly puts a premium on performance.             broadened their approaches to criminal justice,
Taxpayers, victims of crime, prosecutors,          making prisons one item on a larger menu of
police, judges–everyone wants the corrections      options for dealing with the wide spectrum of


                                                                                  Public Safety Performance Project   25
criminal behavior. They have employed new,
                      cost effective strategies for managing their
                      prison populations, such as establishing
                      sentencing guidelines, improving parole release
                      practices, and holding probation and parole
                      violators accountable with graduated
                      sanctions. They have developed new
                      programs proven effective at reducing
                      recidivism, such as drug courts, day reporting
                      centers and comprehensive re-entry programs.
                      And states have deployed new technologies,
                      such as instant-result drug tests and risk
                      assessments that help judges and corrections
                      professionals match offenders with the right
                      levels and types of supervision and services.

                      The increases in prison populations and costs
                      predicted in this report are worrisome, but
                      they are not inevitable. These projections and
                      the Public Safety Performance Project’s
                      profiles on innovative states should serve as
                      tools for policy makers and others, who can
                      use the data and lessons learned across the
                      country to boost the performance of the
                      corrections systems in their own states.


26 Public Safety, Public Spending
Appendix
TABLE A-1 Key State Data
State/Region                                Prison Population   Incarceration    Projection
                                                    2005          Rate 2005     Methodology
U.S. total*                                     1,480,223            500               –
Federala*                                          187,394            56          Simulation
State*                                           1,292,829           435               –
Northeast*                                         164,074           298               –
Connecticutb                                        13,121           373            None
Maine                                                1,905           144          Simulation
Massachusettsc*                                     10,385           239          Simulation
New Hampshire                                        2,520           192         Time Series
New Jerseyd*                                        26,746           313             Flow
New York                                            62,743           326            None
                                                                                                      *   State population differs from
Pennsylvania                                        42,345           340          Simulation              BJS report to mirror projections
Rhode Islande*                                       2,767           189          Simulation              populations
Vermontb                                             1,542           247            None              a   Federal prison population
                                                                                                          provided by the Bureau of
Midwest*                                           252,438           383               –                  Prisons.
Illinoisf                                           44,919           351          Simulation          b   Prisons and jails form one
Indiana                                             24,416           388          Simulation              integrated system. Figures here
                                                                                                          include sentenced prisoners
Iowag*                                               8,737           294          Simulation              only.
Kansasf                                              9,068           330          Simulation          c   Prison population on December
Michigan                                            49,546           489          Simulation              27, 2005 from 'Quarterly Report
                                                                                                          on the Status of Prison
Minnesotak*                                          8,874           180          Simulation              Overcrowding, Fourth Quarter
Missourif                                           30,803           529         Time Series              2005', Massachusetts
Nebraska                                             4,330           245          Simulation              Department of Correction,
                                                                                                          January 2006
North Dakota                                         1,327           208          Simulation              (http://www.mass.gov/Eeops/d
Ohiof                                               45,854           400          Simulation              ocs/doc/research_reports/4th_0
South Dakota                                         3,454           443          Simulation              5_overcrowding.pdf).
                                                                                                      d   New Jersey 2005 prison total
Wisconsin                                           21,110           380            None                  taken from New Jersey
South*                                             580,860           539               –                  Department of Corrections
Alabama                                             27,003           591               –                  Offender Characteristics
                                                                                                          Report, Policy Analysis &
Arkansas                                            13,383           479          Simulation              Planning and represent
Delawareb                                            3,972           467          Simulation              population on January 9, 2006
Floridaj*                                           86,563           499          Simulation              (http://www.nj.gov/corrections/
                                                                                                          offender_statistics/2006/Whole
Georgiah*                                           51,904           572          Simulation              Doc_Off_Char2006.PDF).
Kentucky                                            19,215           459          Simulation          e   Prison population provided by
Louisiana                                           36,083           797          Simulation              Rhode Island Department of
                                                                                                          Corrections.
Maryland                                            22,143           394          Simulation          f   Includes some inmates
Mississippi                                         19,335           660          Simulation              sentenced to 1 year or less.
North Carolinai*                                    36,620           360          Simulation          g   Iowa prison population
                                                                                                          extrapolated using fiscal year
Oklahomaf                                           23,245           652          Simulation              end counts.
South Carolina                                      22,464           525          Simulation          h   Prison population provided by
Tennesseef                                          26,369           440          Simulation              Georgia Department of
                                                                                                          Corrections.
Texasm*                                            151,925           691          Simulation          i   North Carolina prison
Virginia                                            35,344           464          Simulation              population data obtained from
West Virginia                                        5,292           291          Simulation              NCDOC web page database.
                                                                                                      j   Prison population from 'Trends
West*                                              295,457           431               –                  in Florida Prison Admissions
Alaskab                                              2,781           414            None                  and Populations December
Arizona                                             31,411           521         Time Series              2005', Florida Department of
                                                                                                          Corrections
California                                         168,982           466          Simulation              (www.dc.state.fl.us/pub/pop/20
Coloradof                                           21,456           457         Time Series              05/pop.pdf)
Hawaiib                                              4,422           340          Simulation          k   Prison population on January 1,
                                                                                                          2006 from 'An Outcome
Idaho                                                6,818           472            None                  Evaluation of the Challenge
Montanan*                                            2,625           373            None                  Incarceration Program',
Nevada                                              11,644           474          Simulation              Minnesota Department of
                                                                                                          Corrections, October 2006
New Mexico                                           6,292           323          Simulation              (http://www.corr.state.mn.us/p
Oregon                                              13,390           365          Simulation              ublications/documents/CIPEval
Utah                                                 6,269           252            None                  uationReport10-06.pdf)
                                                                                                      m   Prison population from Texas
Washington                                          17,320           273          Simulation              Department of Criminal Justice.
Wyoming                                              2,047           400            None              n   Institutional prisoners only.

Source: Bureau of Justice Statistics, JFA Institute


                                                                                      Public Safety Performance Project                      27
TABLE A-2 Actual & Projected Resident Population

   State/Region                Estimated            Projected           Projected            Projected         Projected      Projected      Projected
                                 End of              End of              End of               End of            End of          End of        End of       % Change
                                FY 2005             Year 2006           Year 2007            Year 2008         Year 2009      Year 2010      Year 2011     2006-2011
   U.S. total                 296,410,404          299,565,081         302,255,297          304,935,021       307,603,988    310,268,231    312,940,989       4.5%
   Northeast                    54,641,895           55,125,296          55,326,451           55,517,038        55,697,475     55,869,287     56,034,887      1.7%
   Connecticut                   3,510,297            3,527,755           3,542,998            3,557,405         3,570,942      3,583,757      3,596,091      1.9%
   Maine                         1,321,505            1,330,601           1,338,420            1,346,036         1,353,460      1,360,672      1,367,596      2.8%
   Massachusetts                 6,398,743            6,561,571           6,588,248            6,613,573         6,637,676      6,660,827      6,683,355      1.9%
   New Hampshire                 1,309,940            1,336,023           1,350,148            1,364,301         1,378,473      1,392,698      1,406,971      5.3%
   New Jersey                    8,717,925            8,832,766           8,888,287            8,941,682         8,993,050      9,042,819      9,091,630      2.9%
   New York                     19,254,630           19,325,562          19,364,721           19,399,297        19,429,579     19,456,238     19,480,389      0.8%
   Pennsylvania                 12,429,616           12,477,239          12,509,376           12,540,294        12,569,978     12,598,434     12,625,803      1.2%
   Rhode Island                  1,076,189            1,096,344           1,102,511            1,108,389         1,113,952      1,119,205      1,124,186      2.5%
   Vermont                         623,050              637,437             641,745              646,063           650,367        654,640        658,868      3.4%
   Midwest                      65,971,974           66,440,637          66,721,923           66,995,549        67,260,924     67,517,883     67,767,236      2.0%
   Illinois                     12,763,371           12,769,657          12,814,117           12,856,636        12,897,157     12,935,988     12,973,810      1.6%
   Indiana                       6,271,973            6,294,276           6,323,155            6,351,281         6,378,648      6,405,269      6,431,257      2.2%
   Iowa                          2,966,334            2,986,331           2,993,970            3,000,886         3,007,035      3,012,367      3,016,907      1.0%
   Kansas                        2,744,687            2,768,324           2,779,287            2,789,995         2,800,366      2,810,442      2,820,284      1.9%
   Michigan                     10,120,860           10,277,845          10,322,902           10,366,379        10,408,204     10,448,077     10,485,819      2.0%
   Minnesota                     5,132,799            5,247,934           5,296,992            5,346,312         5,395,836      5,445,509      5,495,282      4.7%
   Missouri                      5,800,310            5,813,035           5,844,610            5,875,874         5,906,750      5,937,243      5,967,445      2.7%
   Nebraska                      1,758,787            1,752,320           1,757,362            1,762,181         1,766,765      1,771,126      1,775,300      1.3%
   North Dakota                    636,677              636,036             636,323              636,532           636,618        636,578        636,442      0.1%
   Ohio                         11,464,042           11,510,978          11,531,425           11,550,391        11,567,842     11,583,777     11,598,234      0.8%
   South Dakota                    775,933              776,480             779,477              782,351           785,077        787,646        790,056      1.7%
   Wisconsin                     5,536,201            5,607,424           5,642,306            5,676,735         5,710,628      5,743,865      5,776,403      3.0%
   South                       106,954,892          108,364,091         109,700,000          111,039,357       112,381,872    113,729,952    115,088,601      6.2%
   Alabama                       4,557,808            4,548,208           4,562,068            4,575,841         4,589,514      4,603,075      4,616,554      1.5%
   Arkansas                      2,779,154            2,807,016           2,826,758            2,846,270         2,865,500      2,884,503      2,903,384      3.4%
   Delaware                        843,524              851,327             860,938              870,411           879,730        888,882        897,843      5.5%
   Florida                      17,789,864           18,015,259          18,359,934           18,711,584        19,070,439     19,437,214     19,813,082     10.0%
   Georgia                       9,072,576            9,126,400           9,259,442            9,391,842         9,523,469      9,654,210      9,784,054      7.2%
   Kentucky                      4,173,405            4,195,783           4,216,491            4,236,461         4,255,690      4,274,242      4,292,249      2.3%
   Louisiana                     4,523,628            4,559,786           4,575,884            4,591,185         4,605,658      4,619,402      4,632,560      1.6%
   Maryland                      5,600,388            5,692,070           5,752,927            5,813,760         5,874,573      5,935,371      5,996,219      5.3%
   Mississippi                   2,921,088            2,933,689           2,945,086            2,955,983         2,966,363      2,976,225      2,985,630      1.8%
   North Carolina                8,683,242            8,893,893           9,022,205            9,151,193         9,280,841      9,411,179      9,542,453      7.3%
   Oklahoma                      3,547,884            3,542,715           3,556,830            3,570,816         3,584,641      3,598,415      3,612,293      2.0%
   South Carolina                4,255,083            4,302,577           4,344,306            4,385,599         4,426,424      4,466,747      4,506,628      4.7%
   Tennessee                     5,962,959            6,044,730           6,097,782            6,150,954         6,204,210      6,257,637      6,311,407      4.4%
   Texas                        22,859,968           23,336,489          23,711,224           24,086,241        24,461,352     24,837,867     25,218,315      8.1%
   Virginia                      7,567,465            7,690,340           7,781,912            7,873,339         7,964,633      8,055,867      8,147,172      5.9%
   West Virginia                 1,816,856            1,823,813           1,826,218            1,827,882         1,828,840      1,829,120      1,828,762      0.3%
   West                         68,291,122           69,090,218          69,966,312           70,846,733        71,731,725     72,623,572     73,527,265      6.4%
   Alaska                          663,661              670,332             676,799              683,524           690,537        697,745        705,148      5.2%
   Arizona                       5,939,292            6,091,570           6,243,949            6,399,280         6,557,534      6,719,039      6,884,382     13.0%
   California                   36,132,147           36,653,225          37,059,690           37,464,007        37,866,419     38,268,509     38,673,873      5.5%
   Colorado                      4,665,177            4,682,434           4,725,181            4,767,794         4,810,307      4,852,893      4,895,793      4.6%
   Hawaii                        1,275,194            1,297,844           1,311,156            1,323,543         1,335,077      1,346,002      1,356,313      4.5%
   Idaho                         1,429,096            1,439,585           1,461,544            1,483,723         1,506,077      1,528,573      1,551,126      7.7%
   Montana                         935,670              943,862             951,064              958,172           965,145        971,931        978,498      3.7%
   Nevada                        2,414,807            2,450,937           2,518,059            2,586,289         2,655,610      2,726,022      2,797,632     14.1%
   New Mexico                    1,928,384            1,927,339           1,943,387            1,958,693         1,973,191      1,986,937      2,000,105      3.8%
   Oregon                        3,641,056            3,651,845           3,690,289            3,729,815         3,770,424      3,812,060      3,854,789      5.6%
   Utah                          2,469,585            2,470,439           2,505,704            2,541,227         2,577,036      2,613,198      2,649,851      7.3%
   Washington                    6,287,759            6,299,318           6,365,366            6,434,081         6,505,545      6,579,809      6,657,015      5.7%
   Wyoming                         509,294              511,492             514,128              516,588           518,827        520,859        522,743      2.2%

   Source: U.S. Census Bureau mid-year projections, www.census.gov.
   Notes: US totals include Distrcit of Columbia population counts not included within a state
   End of year number estimated by calculating the mid-point population for mid-year estimates/projections.


28 Public Safety, Public Spending
TABLE A-3 State Prison Populations by Region, 2006-2011

State/Region                                     Estimated            Projected            Projected    Projected    Projected    Projected    % Change
                                                   End of              End of               End of       End of       End of       End of      2006-2011
                                                 Year 2006            Year 2007            Year 2008    Year 2009    Year 2010    Year 2011
U.S. total                                       1,530,454            1,568,822            1,614,808    1,654,668    1,686,495    1,722,477       13%
Federal1                                            192,584              200,696              206,982      212,283      217,385      221,882      15%
State                                             1,337,870            1,368,126            1,407,826    1,442,385    1,469,110    1,500,595      12%
Northeast                                           168,176              170,838              173,076      175,349      177,585      180,154       7%
Connecticut                                          14,000               14,000               14,000       14,000       14,000       14,000       0%
Maine4                                                1,978                2,053                2,131        2,212        2,296        2,383      21%
Massachusetts6                                       10,670               10,780               10,910       11,040       11,180       11,310       6%
New Hampshire                                         2,620                2,699                2,780        2,863        2,949        3,037      16%
New Jersey                                           27,309               28,051               28,369       28,704       29,100       29,586       8%
New York                                             63,000               63,000               63,000       63,000       63,000       63,000       0%
Pennsylvania                                         44,096               45,596               47,096       48,596       50,096       51,596      17%
Rhode Island                                          2,853                2,901                2,924        2,960        2,882        3,052       7%
Vermont                                               1,650                1,758                1,866        1,974        2,082        2,190      33%
Midwest                                             256,613              261,076              267,174      274,877      281,289      287,622      12%
Illinois3                                            45,687               46,273               46,967       47,708       48,539       49,497       8%
Indiana                                              25,061               25,249               26,179       27,058       28,154       28,728      15%
Iowa3                                                 8,857                9,282                9,659        9,898       10,071       10,284      16%
Kansas                                                8,924                9,185                9,383        9,505        9,821       10,074      13%
Michigan2                                            49,974               50,743               51,857       53,044       54,441       55,687      11%
Minnesota                                             8,899                9,115                9,385        9,609        9,701       10,063      13%
Missouri                                             30,135               29,824               29,512       31,216       31,577       31,937       6%
Nebraska                                              4,706                4,953                5,052        5,182        5,243        5,273      12%
North Dakota                                          1,384                1,420                1,458        1,499        1,535        1,580      14%
Ohio3                                                47,519               49,211               51,548       53,603       55,305       57,223      20%
South Dakota                                          3,442                3,594                3,745        3,904        4,069        4,241      23%
Wisconsin4                                           22,025               22,227               22,429       22,651       22,833       23,035       5%
South                                               603,876              615,562              635,968      649,085      656,408      669,072      11%
Alabama                                              28,430               28,789               28,966       29,298       29,739       30,461       7%
Arkansas                                             13,737               14,264               14,790       15,246       15,703       16,057      17%
Delaware                                              3,972                3,972                3,972        3,972        3,972        3,972       0%
Florida                                              89,815               92,569               96,568      100,482      103,158      106,042      18%
Georgia                                              53,685               55,051               56,310       57,463       58,509       59,449      11%
Kentucky                                             21,459               21,650               23,690       24,525       25,455       26,209      22%
Louisiana                                            38,094               38,488               38,738       38,951       39,241       39,491       4%
Maryland3                                            23,156               23,220               23,270       23,320       23,370       23,420       1%
Mississippi                                          22,812               23,288               23,746       24,005       24,367       24,673       8%
North Carolina3                                      38,257               38,865               39,394       40,059       40,860       41,676       9%
Oklahoma3                                            25,089               26,175               31,992       32,633       28,058       28,345      13%
South Carolina                                       24,070               24,819               25,568       26,317       27,066       27,815      16%
Tennessee                                            26,186               26,590               26,965       27,273       27,388       27,582       5%
Texas                                               152,671              154,766              158,090      160,555      163,331      166,327       9%
Virginia                                             37,198               37,686               38,330       39,304       40,383       41,476      12%
West Virginia                                         5,246                5,370                5,579        5,682        5,808        6,077      16%
West                                                309,205              320,651              331,608      343,075      353,829      363,748      18%
Alaska4                                               2,951                3,130                3,321        3,523        3,737        3,964      34%
Arizona                                              35,965               38,189               40,645       43,614       46,392       48,381      35%
California                                          173,100              177,573              180,979      183,955      186,565      188,772       9%
Colorado2                                            22,624               23,927               25,357       26,894       28,261       29,685      31%
Hawaii                                                4,105                4,281                4,457        4,633        4,809        4,985      21%
Idaho5                                                7,206                7,669                8,141        8,625        9,125        9,654      34%
Montana5                                              2,812                3,017                3,233        3,464        3,712        3,977      41%
Nevada                                               13,239               13,732               14,289       15,129       15,862       16,764      27%
New Mexico                                            7,006                7,431                7,795        8,044        8,244        8,477      21%
Oregon2                                              13,411               13,600               13,924       14,294       14,719       15,110      13%
Utah4                                                 6,552                6,848                7,157        7,480        7,818        8,171      25%
Washington2                                          18,088               19,000               19,945       20,937       21,978       23,071      28%
Wyoming4                                              2,147                2,254                2,366        2,483        2,607        2,737      27%
Source: JFA Institute
1   Source: Bureau of Prisons
2   State provided projections short of 2011. Similar growth rates were applied to complete.
3   State provided projections on a FY basis. December figures were extrapolated in these states.
4   Average annual change from 2001-2005 applied yearly to generate forecast.
5   Both FY adjusted and short of 2011.
6   Massachusetts represents both civil and criminal inmates.


                                                                                                                Public Safety Performance Project          29
TABLE A-4 Prison Populations by Growth Rate, 2006-2011

   State/Region                                     Estimated            Projected            Projected    Projected    Projected    Projected    % Change
                                                      End of              End of               End of       End of       End of       End of      2006-2011
                                                    Year 2006            Year 2007            Year 2008    Year 2009    Year 2010    Year 2011
   U.S. total                                       1,530,454            1,568,822            1,614,808    1,654,668    1,686,495    1,722,477       13%
   Federal1                                            192,584              200,696              206,982      212,283      217,385      221,882      15%
   State                                             1,337,870            1,368,126            1,407,826    1,442,385    1,469,110    1,500,595      12%
   Montana5                                              2,812                3,017                3,233        3,464        3,712        3,977      41%
   Arizona                                              35,965               38,189               40,645       43,614       46,392       48,381      35%
   Alaska4                                               2,951                3,130                3,321        3,523        3,737        3,964      34%
   Idaho5                                                7,206                7,669                8,141        8,625        9,125        9,654      34%
   Vermont                                               1,650                1,758                1,866        1,974        2,082        2,190      33%
   Colorado2                                            22,624               23,927               25,357       26,894       28,261       29,685      31%
   Washington2                                          18,088               19,000               19,945       20,937       21,978       23,071      28%
   Wyoming4                                              2,147                2,254                2,366        2,483        2,607        2,737      27%
   Nevada                                               13,239               13,732               14,289       15,129       15,862       16,764      27%
   Utah4                                                 6,552                6,848                7,157        7,480        7,818        8,171      25%
   South Dakota                                          3,442                3,594                3,745        3,904        4,069        4,241      23%
   Kentucky                                             21,459               21,650               23,690       24,525       25,455       26,209      22%
   Hawaii                                                4,105                4,281                4,457        4,633        4,809        4,985      21%
   New Mexico                                            7,006                7,431                7,795        8,044        8,244        8,477      21%
   Maine4                                                1,978                2,053                2,131        2,212        2,296        2,383      21%
   Ohio3                                                47,519               49,211               51,548       53,603       55,305       57,223      20%
   Florida                                              89,815               92,569               96,568      100,482      103,158      106,042      18%
   Pennsylvania                                         44,096               45,596               47,096       48,596       50,096       51,596      17%
   Arkansas                                             13,737               14,264               14,790       15,246       15,703       16,057      17%
   Iowa3                                                 8,857                9,282                9,659        9,898       10,071       10,284      16%
   New Hampshire                                         2,620                2,699                2,780        2,863        2,949        3,037      16%
   West Virginia                                         5,246                5,370                5,579        5,682        5,808        6,077      16%
   South Carolina                                       24,070               24,819               25,568       26,317       27,066       27,815      16%
   Indiana                                              25,061               25,249               26,179       27,058       28,154       28,728      15%
   North Dakota                                          1,384                1,420                1,458        1,499        1,535        1,580      14%
   Minnesota                                             8,899                9,115                9,385        9,609        9,701       10,063      13%
   Oklahoma3                                            25,089               26,175               31,992       32,633       28,058       28,345      13%
   Kansas                                                8,924                9,185                9,383        9,505        9,821       10,074      13%
   Oregon2                                              13,411               13,600               13,924       14,294       14,719       15,110      13%
   Nebraska                                              4,706                4,953                5,052        5,182        5,243        5,273      12%
   Virginia                                             37,198               37,686               38,330       39,304       40,383       41,476      12%
   Michigan2                                            49,974               50,743               51,857       53,044       54,441       55,687      11%
   Georgia                                              53,685               55,051               56,310       57,463       58,509       59,449      11%
   California                                          173,100              177,573              180,979      183,955      186,565      188,772       9%
   Texas                                               152,671              154,766              158,090      160,555      163,331      166,327       9%
   North Carolina3                                      38,257               38,865               39,394       40,059       40,860       41,676       9%
   Illinois3                                            45,687               46,273               46,967       47,708       48,539       49,497       8%
   New Jersey                                           27,309               28,051               28,369       28,704       29,100       29,586       8%
   Mississippi                                          22,812               23,288               23,746       24,005       24,367       24,673       8%
   Alabama                                              28,430               28,789               28,966       29,298       29,739       30,461       7%
   Rhode Island                                          2,853                2,901                2,924        2,960        2,882        3,052       7%
   Massachusetts6                                       10,670               10,780               10,910       11,040       11,180       11,310       6%
   Missouri                                             30,135               29,824               29,512       31,216       31,577       31,937       6%
   Tennessee                                            26,186               26,590               26,965       27,273       27,388       27,582       5%
   Wisconsin4                                           22,025               22,227               22,429       22,651       22,833       23,035       5%
   Louisiana                                            38,094               38,488               38,738       38,951       39,241       39,491       4%
   Maryland3                                            23,156               23,220               23,270       23,320       23,370       23,420       1%
   Connecticut                                          14,000               14,000               14,000       14,000       14,000       14,000       0%
   New York                                             63,000               63,000               63,000       63,000       63,000       63,000       0%
   Delaware                                              3,972                3,972                3,972        3,972        3,972        3,972       0%
   Source: JFA Institute
   1   Source: U.S. Bureau of Prisons
   2   State provided projections short of 2011. Similar growth rates were applied to complete.
   3   State provided projections on a FY basis. December figures were extrapolated in these states.
   4   Average annual change from 2001-2005 applied yearly to generate forecast
   5   Both FY adjusted and short of 2011
   6   Massachusetts represents both civil and criminal inmates.


30 Public Safety, Public Spending
TABLE A-5 Projected Incarceration Rates (by Region)

State/Region                                          Projected           Projected              Projected            Projected     Projected   Projected   % Change
                                                       End of              End of                 End of               End of        End of      End of     2006-2011
                                                      Year 2006           Year 2007              Year 2008            Year 2009     Year 2010   Year 2011
U.S. total                                               511                  519                   530                  538           544          550         8%
Federal                                                    64                  66                     68                   69            70          71        10%
State                                                     447                 453                    462                  470           474         480         7%
Northeast                                                 305                 309                    312                  315           318         322         5%
Connecticut                                               397                 395                    394                  392           391         389        -2%
Maine                                                     149                 153                    158                  163           169         174        17%
Massachusetts                                             163                 164                    165                  166           168         169         4%
New Hampshire                                             196                 200                    204                  208           212         216        10%
New Jersey                                                309                 316                    317                  319           322         325         5%
New York                                                  326                 325                    325                  324           324         323        -1%
Pennsylvania                                              353                 364                    376                  387           398         409        16%
Rhode Island                                              260                 263                    264                  266           258         271         4%
Vermont                                                   259                 274                    289                  304           318         332        28%
Midwest                                                   386                 391                    399                  409           417         424        10%
Illinois                                                  358                 361                    365                  370           375         382         7%
Indiana                                                   398                 399                    412                  424           440         447        12%
Iowa                                                      297                 310                    322                  329           334         341        15%
Kansas                                                    322                 330                    336                  339           349         357        11%
Michigan                                                  486                 492                    500                  510           521         531         9%
Minnesota                                                 170                 172                    176                  178           178         183         8%
Missouri                                                  518                 510                    502                  528           532         535         3%
Nebraska                                                  269                 282                    287                  293           296         297        11%
North Dakota                                              218                 223                    229                  235           241         248        14%
Ohio                                                      413                 427                    446                  463           477         493        20%
South Dakota                                              443                 461                    479                  497           517         537        21%
Wisconsin                                                 393                 394                    395                  397           398         399         2%
South                                                     557                 561                    573                  578           577         581         4%
Alabama                                                   625                 631                    633                  638           646         660         6%
Arkansas                                                  489                 505                    520                  532           544         553        13%
Delaware                                                  467                 461                    456                  452           447         442        -5%
Florida                                                   499                 504                    516                  527           531         535         7%
Georgia                                                   588                 595                    600                  603           606         608         3%
Kentucky                                                  511                 513                    559                  576           596         611        19%
Louisiana                                                 835                 841                    844                  846           849         852         2%
Maryland                                                  407                 404                    400                  397           394         391        -4%
Mississippi                                               778                 791                    803                  809           819         826         6%
North Carolina                                            430                 431                    430                  432           434         437         2%
Oklahoma                                                  708                 736                    896                  910           780         785        11%
South Carolina                                            559                 571                    583                  595           606         617        10%
Tennessee                                                 433                 436                    438                  440           438         437         1%
Texas                                                     654                 653                    656                  656           658         660         1%
Virginia                                                  484                 484                    487                  493           501         509         5%
West Virginia                                             288                 294                    305                  311           318         332        16%
West                                                      448                 458                    468                  478           487         495        11%
Alaska                                                    440                 462                    486                  510           536         562        28%
Arizona                                                   590                 612                    635                  665           690         703        19%
California                                                472                 479                    483                  486           488         488         3%
Colorado                                                  483                 506                    532                  559           582         606        25%
Hawaii                                                    316                 327                    337                  347           357         368        16%
Idaho                                                     501                 525                    549                  573           597         622        24%
Montana                                                   298                 317                    337                  359           382         406        36%
Nevada                                                    540                 545                    552                  570           582         599        11%
New Mexico                                                364                 382                    398                  408           415         424        17%
Oregon                                                    367                 369                    373                  379           386         392         7%
Utah                                                      265                 273                    282                  290           299         308        16%
Washington                                                287                 298                    310                  322           334         347        21%
Wyoming                                                   420                 438                    458                  479           501         524        25%

Source: JFA Institute
Notes: The forecasted incarceration rates are calculated using adjusted Census projections and state prison population forecasts.
This table has been updated with revised population estimates.


                                                                                                                             Public Safety Performance Project          31
TABLE A-6 Projected Incarceration Rates (by Growth Rate)

   State/Region                                          Projected           Projected              Projected            Projected     Projected   Projected   % Change
                                                          End of              End of                 End of               End of        End of      End of     2006-2011
                                                         Year 2006           Year 2007              Year 2008            Year 2009     Year 2010   Year 2011
   U.S. total                                               511                  519                   530                  538           544          550         8%
   Federal                                                    64                  66                     68                   69            70          71        10%
   State                                                     447                 453                    462                  470           474         480         7%
   Montana                                                   298                 317                    337                  359           382         406        36%
   Vermont                                                   259                 274                    289                  304           318         332        28%
   Alaska                                                    440                 462                    486                  510           536         562        28%
   Colorado                                                  483                 506                    532                  559           582         606        25%
   Wyoming                                                   420                 438                    458                  479           501         524        25%
   Idaho                                                     501                 525                    549                  573           597         622        24%
   South Dakota                                              443                 461                    479                  497           517         537        21%
   Washington                                                287                 298                    310                  322           334         347        21%
   Ohio                                                      413                 427                    446                  463           477         493        20%
   Kentucky                                                  511                 513                    559                  576           596         611        19%
   Arizona                                                   590                 612                    635                  665           690         703        19%
   Maine                                                     149                 153                    158                  163           169         174        17%
   New Mexico                                                364                 382                    398                  408           415         424        17%
   Utah                                                      265                 273                    282                  290           299         308        16%
   Hawaii                                                    316                 327                    337                  347           357         368        16%
   Pennsylvania                                              353                 364                    376                  387           398         409        16%
   West Virginia                                             288                 294                    305                  311           318         332        16%
   Iowa                                                      297                 310                    322                  329           334         341        15%
   North Dakota                                              218                 223                    229                  235           241         248        14%
   Arkansas                                                  489                 505                    520                  532           544         553        13%
   Indiana                                                   398                 399                    412                  424           440         447        12%
   Nevada                                                    540                 545                    552                  570           582         599        11%
   Kansas                                                    322                 330                    336                  339           349         357        11%
   Oklahoma                                                  708                 736                    896                  910           780         785        11%
   Nebraska                                                  269                 282                    287                  293           296         297        11%
   South Carolina                                            559                 571                    583                  595           606         617        10%
   New Hampshire                                             196                 200                    204                  208           212         216        10%
   Michigan                                                  486                 492                    500                  510           521         531         9%
   Minnesota                                                 170                 172                    176                  178           178         183         8%
   Florida                                                   499                 504                    516                  527           531         535         7%
   Oregon                                                    367                 369                    373                  379           386         392         7%
   Illinois                                                  358                 361                    365                  370           375         382         7%
   Mississippi                                               778                 791                    803                  809           819         826         6%
   Alabama                                                   625                 631                    633                  638           646         660         6%
   New Jersey                                                309                 316                    317                  319           322         325         5%
   Virginia                                                  484                 484                    487                  493           501         509         5%
   Rhode Island                                              260                 263                    264                  266           258         271         4%
   Massachusetts                                             163                 164                    165                  166           168         169         4%
   California                                                472                 479                    483                  486           488         488         3%
   Georgia                                                   588                 595                    600                  603           606         608         3%
   Missouri                                                  518                 510                    502                  528           532         535         3%
   Louisiana                                                 835                 841                    844                  846           849         852         2%
   North Carolina                                            430                 431                    430                  432           434         437         2%
   Wisconsin                                                 393                 394                    395                  397           398         399         2%
   Tennessee                                                 433                 436                    438                  440           438         437         1%
   Texas                                                     654                 653                    656                  656           658         660         1%
   New York                                                  326                 325                    325                  324           324         323        -1%
   Connecticut                                               397                 395                    394                  392           391         389        -2%
   Maryland                                                  407                 404                    400                  397           394         391        -4%
   Delaware                                                  467                 461                    456                  452           447         442        -5%

   Notes: The forecasted incarceration rates are calculated using adjusted Census projections and state prison population forecasts.
   This table has been updated with revised population estimates.


32 Public Safety, Public Spending
TABLE A-7 Annual Operating Costs per Inmate

State/Region                     Annual Operating Cost     Annual 2001 Costs        Annual Operating Cost   Change from Inflation
                                   Per Inmate 2001       Adjusted to 2005 Dollars     Per Inmate 2005       Adjusted 2001 Costs to
                                                                                                              Actual 2005 Costs
Federal                                      $22,632              24,010                   23,429                     -581
State                                        $22,650              23,941                   23,876                      -65
Northeast                                    $33,037              35,048                   35,584                      536
Connecticut                                  $26,856              28,467                   29,527                    1,060
Maine                                        $44,379              47,042                   35,012                  -12,030
Massachusetts                                $37,718              39,981                   43,026                    3,045
New Hampshire                                $25,949              27,506                   28,143                      637
New Jersey                                   $27,347              28,988                   28,000                     -988
New York                                     $36,835              39,045                   42,202                    3,157
Pennsylvania                                 $31,900              33,814                   31,029                   -2,785
Rhode Island                                 $38,503              40,813                   44,860                    4,047
Vermont                                      $25,178              26,689                   28,846                    2,157
Midwest                                      $24,779              26,228                   23,296                   -2,932
Illinois                                     $21,844              23,155                   21,622                   -1,533
Indiana                                      $21,841              23,151                   21,531                   -1,620
Iowa                                         $22,997              24,377                   23,383                     -994
Kansas                                       $21,381              22,664                   21,944                     -720
Michigan                                     $32,525              34,477                   28,743                   -5,734
Minnesota                                    $36,836              39,046                   29,260                   -9,786
Missouri                                     $12,867              13,639                   14,183                      544
Nebraska                                     $25,321              26,840                   25,079                   -1,761
North Dakota                                 $22,425              23,771                   25,692                    1,921
Ohio                                         $26,295              27,873                   23,011                   -4,862
South Dakota                                 $13,853              14,684                   14,157                     -527
Wisconsin                                    $28,622              30,339                   28,932                   -1,407
South                                        $16,479              18,476                   17,991                     -485
Alabama                                       $8,128               8,616                   13,019                    4,403
Arkansas                                     $15,619              16,556                   17,608                    1,052
Delaware                                     $22,802              24,170                   24,500                      330
Florida                                      $20,190              21,401                   22,211                      810
Georgia                                      $19,860              21,052                   17,017                   -4,035
Kentucky                                     $17,818              18,887                   18,170                     -717
Louisiana                                    $12,951              13,728                   13,009                     -719
Maryland                                     $26,398              27,982                   30,244                    2,262
Mississippi                                  $12,795              13,563                   13,428                     -135
North Carolina                               $26,984              28,603                   24,986                   -3,617
Oklahoma                                     $16,309              17,288                   16,986                     -302
South Carolina                               $16,762              17,768                   13,170                   -4,598
Tennessee                                    $18,206              19,298                   20,940                    1,642
Texas                                        $13,808              14,636                   14,622                      -14
Virginia                                     $22,942              24,319                   21,248                   -3,071
West Virginia                                $14,817              15,706                   16,976                    1,270
West                                         $25,231              26,720                   29,608                    2,888
Alaska                                       $36,730              38,934                   42,082                    3,148
Arizona                                      $22,476              23,825                   19,795                   -4,030
California                                   $25,053              26,556                   34,150                    7,594
Colorado                                     $25,408              26,932                   26,248                     -684
Hawaii                                       $21,637              22,935                   18,370                   -4,565
Idaho                                        $16,319              17,298                   16,115                   -1,183
Montana                                      $21,898              23,212                   25,710                    2,498
Nevada                                       $17,572              18,626                   17,676                     -950
New Mexico                                   $28,035              29,717                   26,971                   -2,746
Oregon                                       $36,060              38,224                   24,665                  -13,559
Utah                                         $24,574              26,048                   23,000                   -3,048
Washington                                   $30,168              31,978                   29,005                   -2,973
Wyoming                                      $28,845              30,576                   33,048                    2,472
Source: Bureau of Justice Statistics and JFA Institute
Note: Inflation assumed at 1.5% per year.


                                                                                          Public Safety Performance Project          33
TABLE A-8 Sources of State Prison Population Projections

   State           Projections Source
   Alabama         Addressing the Crisis: Charting the Course for Reform, Alabama Sentencing Commission 2006, p. 62
   Alaska          N/A
   Arizona         JFA
   Arkansas        Arkansas Department of Correction, Sentencing Commission, and Department of Community Correction Ten
                   Year Adult Secure Population Projection 2006-2016, produced for the Arkansas Sentencing Commission by JFA
                   Associates, LLC, authors: Roger Ocker & Wendy Ware, July 2006
   California      California Department of Corrections and Rehabilitation website
                   (http://www.cya.ca.gov/ReportsResearch/OffenderInfoServices/Projections/F06pub.pdf)
   Colorado        Colorado Division of Criminal Justice December 2005 Prison Projections & Legislative Council Staff December
                   2005 Prison Population Projections
   Connecticut     N/A
   Delaware        N/A
   Florida         Detailed Monthly Forecast: October 12, 2006, Florida Criminal Justice Estimating Conference
                   (http://edr.state.fl.us/conferences/criminaljustice/ES10122006.pdf)
   Georgia         Georgia Department of Corrections
   Hawaii          10-Year Corrections Master Plan Update, pg. 2-9, December 2003, Carter Goble Associates, Inc.
   Idaho           Idaho Offender Population Forecast FY 2007 through 2010, August 30, 2006, State of Idaho Department of
                   Correction (http://www.corr.state.id.us/facts/monthly_stats/FY2007Forecast.pdf)
   Illinois        Illinois Department of Corrections
   Indiana         Indiana Department of Correction
   Iowa            Iowa Prison Population Forecast, Iowa Department of Human Rights Division of Criminal and Juvenile Justice
                   Planning, November 2006
   Kansas          2006 Corrections Briefing Report, Kansas Department of Corrections
                   (http://www.dc.state.ks.us/briefrep/2006BriefRep.pdf)
   Kentucky        Kentucky Department of Corrections
   Louisiana       Louisiana Department of Public Safety and Corrections
   Maine           N/A
   Maryland        Maryland Department of Public Safety and Correctional Services
   Massachusetts   Massachusetts Department of Correction
   Michigan        Report to the Legislature Pursuant to P.A. 154 of 2005 Section 401, Prison Population Projection Report January
                   2006, MDOC Office of Research & Planning
   Minnesota       Minnesota Prison Population Projections Fiscal Year 2006 Report, p.9, Minnesota Department of Corrections
                   (http://www.corr.state.mn.us/publications/documents/ProjectionsReport-FY06_000.pdf)
   Mississippi     Mississippi Department of Corrections Ten Year Adult Secure Population Projection: 2004-2015, produced for
                   the Mississippi Department of Corrections by JFA Associates, LLC, authors: Gillian Thompson & Wendy Ware,
                   November 2006
   Missouri        Missouri Department of Corrections
   Montana         Montana Department of Corrections webpage
                   (http://www.cor.mt.gov/resources/reports/PopulationForecast.pdf)
   Nebraska        Nebraska Department of Correctional Services Ten Year Adult Secure Population Projection 2007-2017,
                   produced for the Nebraska Department of Correctional Services by JFA Associates, LLC, authors: Roger Ocker
                   & Wendy Ware, July 2006
                                                                                                              continued next page


34 Public Safety, Public Spending
TABLE A-8 Sources of State Prison Population Projections (continued)

State                   Projections Source
Nevada                  Nevada Department of Corrections Ten Year Adult Secure Population Projection, produced for the Nevada
                        Department of Administration, Budget Division by JFA Associates, LLC, authors: Gillian Thompson & Wendy
                        Ware, November 2006
New Hampshire           New Hampshire Department of Corrections
New Jersey              New Jersey Department of Corrections, Office of Policy & Planning
New Mexico              New Mexico Corrections Department Ten Year Adult Secure Population Projection, Revision C, FY 2007-2016,
                        produced under contract for the New Mexico Corrections Department by JFA Associates, LLC, authors: Roger
                        Ocker & Wendy Ware, June 2006
New York                N/A
North Carolina          North Carolina Sentencing & Policy Advisory Commission FY 2005-2015 Population Projections, prepared in
                        conjunction with Department of Correction's Office of Research and Planning, January 2006
North Dakota            Study of the Facilities and Operations of the North Dakota Department of Corrections, Vol. II: Population
                        Projections and Capacity Needs Analysis, June 15, 2002, Security Response Technologies, Inc.
Ohio                    Ohio Prison Population Projections and Intake Estimates, Bureau of Research, Office of Policy and Offender
                        Reentry, Ohio Department of Rehabilitation and Correction, author: Brian Martin, February 2006
Oklahoma                Oklahoma Criminal Justice Resource Center, April 2006 Oklahoma Prison Population Projection
                        (http://www.ocjrc.net/pubFiles/InmatePopulation/OklahomaPrisonPopulationProjection_2006.pdf)
Oregon                  Oregon Corrections Population Forecast October 2006, Vol. XII No. 2, Office of Economic Analysis, Department
                        of Administrative Services
Pennsylvania            Pennsylvania Population Projection Committee Report Update, September 2005
Rhode Island            Rhode Island Department of Corrections Adult Prison Population Forecast FY 2006, produced for the Rhode
                        Island Department of Corrections by JFA Associates, LLC, authors: Roger Ocker & Wendy Ware.
South Carolina          South Carolina Department of Corrections
South Dakota            South Dakota Department of Corrections
Tennessee               The Tennessee Department of Correction Fiscal Year 2005-2006 Annual Report Coordinated and Published by
                        the Policy, Planning, and Research Division, authors: Linda M. Nutt, Cynthia Taylor, Sara Conte
                        (http://www.state.tn.us/correction/pdf/0506anlrpt.pdf)
Texas                   Adult Incarceration Projected Population, Texas Legislative Budget Board, January 2007
Utah                    N/A
Vermont                 Vermont Department of Corrections
Virginia                Virginia Secretary of Public Safety & Policy Advisory Commission
Washington              Washington State Department of Corrections
West Virginia           West Virginia Correctional Population Forecast: 2004-2014: A Study of the State's Prison Population, December
                        2006, Criminal Justice Statistical Analysis Center, authors: Theresa K. Lester & Stephen M. Haas
Wisconsin               N/A
Wyoming                 N/A
Source: JFA Institute


                                                                                           Public Safety Performance Project            35
TABLE A-9 Sources of State Inmate Costs

   State            Cost Source
   Alabama          http://www.doc.state.al.us/docs/AnnualRpts/2005AnnualReport.pdf
   Alaska           http://www.gov.state.ak.us/omb/06_OMB/budget/DOC/dept20.pdf
   Arizona          http://www.azcorrections.gov/adc/reports/CAG/CAGJun05.pdf
   Arkansas         Arkansas Department of Corrections
   California       http://www.cya.ca.gov/divisionsboards/aoap/factfiguresarchive/factsfigures3rdq2005.html
   Colorado         Colorado Department of Corrections Statistical Report Fiscal Year 2004, Office of Planning & Analysis,
                    Kristi L. Rosten
   Connecticut      http://www.ct.gov/doc/cwp/view.asp?a=1492&q=265472
   Delaware         http://www.state.de.us/correct/pdfs/BudgetInformationFY05.pdf & Delaware DOC
   Florida          Florida Department of Corrections; ttp://www.dc.state.fl.us/upu/annual/0405/budget.html
   Georgia          http://www.dcor.state.ga.us/pdf/FY05AnnualReportPart2.pdf
   Hawaii           http://www.hawaii.gov/psd/documents/reports/PSD_AnnualReport_2004.pdf;
                    http://www.ojp.usdoj.gov/bjs/pub/pdf/p04.pdf
   Idaho            http://www.corr.state.id.us/facts/fact_sheets/QuickFactsJuly2006.pdf
   Illinois         http://www.idoc.state.il.us/subsections/reports/department_data/Department%20Data%202005.pdf
   Indiana          http://www.in.gov/indcorrection/facts.htm
   Iowa             http://www.doc.state.ia.us/Documents/QuickFacts.pdf
   Kansas           2007 Corrections Briefing Report', Kansas Department of Corrections
                    (http://www.dc.state.ks.us/briefrep/2006BriefRep.pdf)
   Kentucky         Kentucky Department of Corrections
   Louisiana        Louisiana Department of Public Safety and Corrections
   Maine            Regional Average
   Maryland         Maryland Department of Public Safety and Correctional Services
   Massachusetts    http://www.mass.gov
   Michigan         http://www.michigan.gov/documents/2004_Annual_Report_147719_7.pdf
   Minnesota        http://www.doc.state.mn.us/aboutdoc/stats/documents/NotableStatistics7-06_000.pdf
   Mississippi      http://www.mdoc.state.ms.us/Research%20and%20Statistics/OffenderCostPerday/
                    Cost%20Per%20Inmate%20Day%20FY%202005.pdf
   Missouri         http://www.doc.mo.gov/pdf/AR%202005.pdf
   Montana          http://www.cor.mt.gov/Facts/FAQ.asp; http://www.cor.mt.gov/Resources/Reports/PopulationForecast.pdf
   Nebraska         http://www.corrections.state.ne.us/administration/statistics/reportdocs/05annualreport.pdf
   Nevada           http://www.doc.nv.gov/stats/annual/fy2005.pdf
   New Hampshire    http://www.nh.gov/nhdoc/divisions/publicinformation/documents/annual2005.pdf
   New Jersey       http://www.state.nj.us/corrections/freqntlyasked.html
   New Mexico       Regional Average
   New York         New York Department of Correctional Services
   North Carolina   http://www.doc.state.nc.us/dop/cost/
   North Dakota     http://www.state.nd.us/docr/docr/BiennialReport03-05.pdf
   Ohio             http://www.drc.state.oh.us/web/Reports/FactSheet/July%202005.pdf
   Oklahoma         http://www.doc.state.ok.us/newsroom/facts/06-01%20Facts%20at%20a%20Glance.pdf
   Oregon           http://www.oregon.gov/DOC/PUBAFF/docs/pdf/quickfacts.pdf
   Pennsylvania     http://www.cor.state.pa.us/stats/lib/stats/2006budgetpresentation.pdf
   Rhode Island     http://www.doc.ri.gov/administration/Cost%20Per%20Offender%20-%202006.pdf
                                                                                                                 continued next page


36 Public Safety, Public Spending
TABLE A-9 Sources of State Inmate Costs (continued)

State                   Cost Source
South Carolina          http://www.doc.sc.gov/FAQs/FAQs.html
South Dakota            http://www.state.sd.us/corrections/miscellaneous_stats.htm
Tennessee               http://www.state.tn.us/correction/faq.html
Texas                   Texas Department of Criminal Justice
Utah                    http://corrections.utah.gov/faq.html
Vermont                 http://www.doc.state.vt.us/pageflip/pageflip.pl/picture?book=FF2006&seqno=1196
Virginia                http://www.vadoc.state.va.us/about/facts/financial/2005/05percapita.pdf
Washington              http://www.doc.wa.gov/BudgetAndResearch/ResearchData/DOCStatisticalBrochureNov06P282.pdf
West Virginia           West Virginia Division of Corrections
Wisconsin               http://www.wi-doc.com/index_adult.htm
Wyoming                 Regional Average
Source: JFA Institute


                                                                                        Public Safety Performance Project   37
Endnotes


   1    U.S. Department of Justice, Office of Justice Programs. Prisoners in 2005, Bureau         14   http://www.ojp.usdoj.gov/bjs/reentry/characteristics.htm
        of Justice Statistics Bulletin, by Paige M. Harrison and Allen J. Beck (Washington,
                                                                                                  15   Data from Georgia Department of Corrections, Georgia Board of Pardons and
        D.C.: November 2006), NCJ 215092 and U.S. Department of Justice, Office of
                                                                                                       Paroles, and Georgia Criminal Justice Coordinating Council.
        Justice Programs. Prison and Jail Inmates at Midyear 2005, Bureau of Justice Statistics
        Bulletin, by Paige M. Harrison and Allen J. Beck (Washington, D.C.: May                   16   For a detailed presentation of the New York experience, see Michael Jacobson,
        2006), NCJ 213133.                                                                             Downsizing Prisons: How to Reduce Crime and End Mass Incarceration (New York: New
                                                                                                       York University Press, 2005), Chapter 4.
   2    U.S. Department of Justice, Office of Justice Programs. Prevalence of Imprisonment
        in the U.S. Population, 1974-2001, by Thomas P. Bonczar (Washington, D.C.:                17   Stephen, James J. (June 2004). State Prison Expenditures 2001. Washington, D.C.:
        August 2003), NCJ 197976.                                                                      U.S. Department of Justice, Bureau of Justice Statistics.
   3    King’s College, London, International Centre for Prison Studies. Prison Brief—            18   The one exception to this rule is where a state is contracting out to private
        Highest to Lowest Rates. Online. Available:                                                    prisons or local jails and where the contract allows for the cost to the private or
        http://www.kcl.ac.uk/depsta/rel/icps/world brief. Accessed: 2006.                              local facility to vary directly to the number of inmates it is housing. For
                                                                                                       example, in Louisiana, local jails bill the state for each state inmate it houses on
   4    A common error is to lump together the terms “jail” and “prison.” In general,
                                                                                                       each day at a cost of $22 per day.
        jails are operated by county government and are reserved for persons who are
        awaiting trial or who have been sentenced to a term of less than one year.                19   U.S. Department of Labor, Bureau of Labor Statistics. http://data.bls.gov/cgi-
        Prisons are operated by state agencies and typically house persons with felony                 bin/cpicalc.pl.
        sentences of one year or more.
                                                                                                  20   There were some states where the differences between 2001 and FY2005-06
   5    U.S. Department of Justice, Office of Justice Programs. Prisoners in 2005, Bureau              were so large that researchers decided to exclude them based on face validity
        of Justice Statistics Bulletin, by Paige M. Harrison and Allen J. Beck (Washington,            concerns. Also excluded were states that showed significant declines in their
        D.C.: November 2006), NCJ 215092                                                               costs between 2001 and FY 2005-06.
   6    Ibid.                                                                                     21   For a review of the more recent studies on the link between incarceration rates
                                                                                                       and crime rates, see the following reports: Michael Jacobson, Downsizing Prisons:
   7    http://www.ojp.usdoj.gov/bjs/glance/tables/exptyptab.htm
                                                                                                       How to Reduce Crime and End Mass Incarceration (New York: New York University
   8    The formula actually requires one to specify the LOS in years to produce an                    Press, 2005), Chapter 4. Michael Lynch, “Beating a Dead Horse: Is There Any
        annualized ADP. So if the LOS is not in years but days, one must divide the                    Basic Empirical Evidence of the Deterrent Effect of Imprisonment,” Crime, Law
        sum by 365 days to produce an LOS in years.                                                    and Social Change vol. 31, no. 4 (1999) p. 361. Tomislav V. Kocandizic and
                                                                                                       Lynne M. Vieraitis, “The Effect of County-Level Prison Population Growth on
   9    The amount of discretion correctional authorities have to release prisoners
                                                                                                       Crime Rates,” Criminology & Public Policy, vol, 5, no. 2 (May 2006), p. 234.
        varies according to each state’s sentencing structure. The majority of states
                                                                                                       Raymond V. Leidka, et al, “The Crime-Control Effect of Incarceration: Does
        have indeterminate sentencing systems, which offer the greatest amount of dis-
                                                                                                       Scale Matter?” Criminology & Public Policy, vol. 5, no. 2 (May 2006), pp. 245-276.
        cretion since they allow parole boards to release inmates once they have served
                                                                                                       William Spelman, “The Limited Importance of Prison Expansion,” in The
        their minimum sentence. States with determinate sentencing structures provide
                                                                                                       Crime Drop in America, Alfred Blumstein and Joel Wallman, eds., Revised
        some level of discretion to release prisoners based on good-time and special
                                                                                                       Edition, (New York: Cambridge University Press, 2006), pp. 97-129.
        program credits.
                                                                                                  22   For all historical incarceration rates presented in the figures in this section, the
   10   Austin, James, John Clark, Patricia Hardyman, and D. Alan Henry. 1999. “The
                                                                                                       source is the Sourcebook of Criminal Justice Statistics Online,
        Impact of ‘Three Strikes and You’re Out’,” Punishment and Society, Vol 1(2):
                                                                                                       http://www.albany.edu/sourcebook/wk1/t6292004.wk1. The U.S. crime rate and
        131-162.
                                                                                                       state crime rates presented in this section are those compiled and reported by
   11   For six of the eight states, the average annual percent change was calculated                  the National Disaster Center, at
        from 2001 to 2005 and applied each year to future years. The other two states,                 http://www.disastercenter.com/crime/uscrime.htm
        Delaware and New York, have been showing declines over this time frame.
                                                                                                  23   James Q. Wilson, “Crime and Public Policy” in James Q. Wilson and Joan
        Researchers contacted both states to determine if the downward trends might
                                                                                                       Petersilia, Crime ICS Press, Oakland, California 1995, p. 489-507.
        continue. Based on these contacts and a review of recent prison population
        trend data, this report assumes no growth over the next five years. It should be          24   Ibid, p. 501.
        emphasized that for these eight non-reporting states the estimates used in this
                                                                                                  25   Don Stemen, “Reconsidering Incarceration: New Directions for Reducing
        report are not official forecasts.
                                                                                                       Crime,” Vera Institute of Justice, New York, New York, January 2007.
   12   U.S. Department of Justice, Office of Justice Programs. Prisoners in 2005, Bureau
                                                                                                  26   Ibid, p. i.
        of Justice Statistics Bulletin, by Paige M. Harrison and Allen J. Beck (Washington,
        D.C.: November 2006), NCJ 215092.                                                         27   See, for instance, “The National Center for State Courts Sentencing Attitudes
                                                                                                       Survey,” July 2006. Findings from a poll of 1,502 randomly selected adults
   13   U.S. Department of Justice, Bureau of Justice Statistics. Recidivism of Prisoners
                                                                                                       included that 76 percent of Americans “would rather see their tax dollars
        Released in 1994, (Washington, D.C.: Bureau of Justice Statistics, June 2002),
                                                                                                       support programs that try to prevent crime by helping offenders find jobs and
        NCJ 193427.
                                                                                                       get treatment than be used to build more prisons.”


38 Public Safety, Public Spending
1025 F Street NW, 9th Floor
     Washington, DC 20004-1409
phone 202.552.2000 | fax 202.552.2299

Pspp prison projections_0207

  • 1.
    Public Safety, Public Spending ForecastingAmerica’s Prison Population 2007–2011
  • 2.
    Revised June 2007.The projected incarceration rates in this report have been updated with revised population estimates.
  • 3.
    About the PublicSafety Performance Project A n operating project of The Pew Charitable Justice, and former bureau chief of the Bureau of Trusts, the Public Safety Performance Project Research and Data Analysis for the Florida Department seeks to help states advance fiscally sound, data- of Corrections. driven policies and practices in sentencing and corrections • Richard Berk, professor of criminology and statistics, that protect public safety, hold offenders accountable and University of Pennsylvania, and former Distinguished control corrections costs. The project helps states Professor of Statistics and Sociology at UCLA. diagnose the factors driving prison growth and provides • Gerald Gaes, visiting scientist at the National Institute policy audits to identify options for reform, drawing on of Justice, criminal justice consultant and former solid research, promising approaches and best practices in director of research for the Federal Bureau of Prisons. other states. The initiative also helps state officials, practitioners and others share state-of-the-art knowledge While these experts have screened the report for and ideas through policy forums, public opinion surveys, methodology and accuracy, neither they nor their current multi-state meetings, national, regional and state-level or former organizations necessarily endorse its findings convenings, and online information about what works. or conclusions. The project works closely with the Pew Center on the Substantial contributions to the report also were made by States (PCS), a division of Pew. By conducting nonpartisan the Vera Institute of Justice and the Council of State research and analysis, educating the public and federal and Governments Justice Center, partners of the Public Safety state policy makers, bringing together diverse stakeholders, Performance Project. Staff of both organizations reviewed and encouraging pragmatic, consensus-based solutions, drafts of the report and offered excellent comments and PCS identifies and advances effective public policy insights that were instrumental to its completion. approaches to critical issues facing states. We also would like to thank the 50 state correctional agencies and the federal Bureau of Prisons, which About this Report provided much of the data used to create the national forecast and other parts of this report. This report was prepared for the Public Safety Performance Project by the JFA Institute, a well-respected, Washington-based, nonprofit consulting firm. JFA is led by James Austin, Wendy Naro and Tony Fabelo, three Contact Information nationally renowned researchers with deep expertise in For more information, please visit www.pewpublicsafety.org state criminal justice policy and statistics. JFA conducts or contact Project Director Adam Gelb at prison population forecasts under contract with a number agelb@pewtrusts.org or (404) 848-0186. of states, and several other states use JFA’s software to make their projections. The Pew Charitable Trusts is driven by the power of knowledge to solve today’s most challenging problems. Pew applies a rigorous, analytical approach to improve public policy, inform the The report was reviewed by three independent specialists public and stimulate civic life. We partner with a diverse range of in prison population forecasting: donors, public and private organizations and concerned citizens • William Bales, associate professor, Florida State who share our commitment to fact-based solutions and goal-driven University, College of Criminology and Criminal investments to improve society. Public Safety Performance Project i
  • 4.
    Executive Summary fter a 700-percent increase in A The national price tag is staggering. The the U.S. prison population between projected 192,023 new prisoners—leave aside 1970 and 2005, you’d think the the current population of more than 1.5 nation would finally have run out of million inmates—could cost as much as $27.5 lawbreakers to put behind bars. billion: potentially a cumulative $15 billion in new operating costs and $12.5 billion in new But according to Public Safety, Public Spending: construction costs by 2011. Every additional Forecasting America’s Prison Population 2007- dollar spent on prisons, of course, is one 2011, a first-of-its-kind projection, state and dollar less that can go to preparing for the federal prisons will swell by more than next Hurricane Katrina, educating young 192,000 inmates over the next five years. people, providing health care to the elderly, This 13-percent jump triples the projected or repairing roads and bridges. growth of the general U.S. population, and will raise the prison census to a total of more Don’t picture this parade of prisoners as an than 1.7 million people. Imprisonment levels exclusively male group. Nationwide, men are expected to keep rising in all but four outnumber women behind bars, but women states, reaching a national rate of 550 per are playing a dubious kind of catch-up here. 100,000, or one of every 182 Americans. If The number of women prisoners is projected you put them all together in one place, the to grow by 16 percent by 2011, while the incarcerated population in just five years will male population will increase 12 percent. In outnumber the residents of Atlanta, some states this disparity is particularly Baltimore and Denver combined. striking. Nevada, for example, is projecting a 36-percent increase in female prisoners over the next half-decade. National Prison Population, 1980-2011 2,000,000 1,800,000 Gender differences aren’t the only area in 1,600,000 which trends vary widely among states and 1,400,000 Projected 1,200,000 regions. Although national prison populations 1,000,000 Actual aren’t currently growing at the same furious 800,000 600,000 pace as they were a few years back, in some 400,000 200,000 states and regions growth rates remain in 0 crisis mode. Prison populations in the West, 1980 1983 1986 1989 1992 1995 1998 2001 2004 2007 2011 Midwest and South are expected to increase Sources: Bureau of Justice Statistics (historical) and JFA Institute ii Public Safety, Public Spending
  • 5.
    by double-digit percentagesbetween 2006 and 2011, led by the West with a projected National Prison Incarceration Rate, 1980-2011 growth rate of 18 percent. The Northeast, 600 Prisoners per 100,000 residents with its slow population growth and steady 500 crime rates, will see slower but still costly Projected 400 growth of 7 percent during the same period. Actual 300 200 A few other trends add to the image of states’ 100 prisons and budgets stretched at the seams: • Over the next five years, the average 0 1980 1983 1986 1989 1992 1995 1998 2001 2004 2007 2011 inmate will be more likely to be female or elderly—both groups that have special Sources: Bureau of Justice Statistics (historical) and JFA Institute needs and higher costs. • In some states, corrections officials, already State Highlights having difficulty hiring and keeping guards on the job, are becoming more and more This report provides forecasts for prison concerned about finding and retaining populations and incarceration rates for all 50 qualified personnel to staff new prisons. states. Among its findings: • In some states, especially in the West, • By 2011, without changes in sentencing or Midwest and South, methamphetamine release policies, Alaska, Arizona, Idaho, cases have become significant contributors Montana and Vermont can expect to see to prison growth. one new prisoner for every three currently • In the past few years, many states have in the system. enacted enhanced penalties for sex crimes. • Similarly, barring reforms, there will be one The impact of most of these laws on prison new prisoner for every four now in prison populations and state budgets will be felt in Colorado, Washington, Wyoming, beyond the five-year window of this report. Nevada, Utah and South Dakota. • Incarceration rates are expected to spike in Arizona and Nevada, from 590 and 540 prisoners per 100,000 residents, respectively, to 703 and 599. Particularly worrisome is the growth in the population of young males, the group at highest risk of 10 Highest-Growth States criminal activity. Both states have recently (by percent increase) increased their prison population forecasts because of the combined impact of Montana 41% demographics and policies that increase Arizona 35% prison terms. Alaska 34% Idaho 34% • Louisiana, which has the highest Vermont 33% incarceration rate among states, with 835 Colorado 31% prisoners per 100,000 residents, expects Washington 28% that figure to hit 852 by 2011. Wyoming 27% Nevada 27% • Florida is anticipated to cross the 100,000- Utah 25% prisoner threshold within the next five Public Safety Performance Project iii
  • 6.
    years, the onlystate other than Texas and heinous crime can have on the public’s views California to do so. about the appropriate punishment for that • None of the states is projecting an actual type of offense and incarceration in general. decrease in its number of prisoners between 2006 and 2011. The report projects no The size of a state’s prison system is growth in Connecticut, Delaware and New determined by two simple factors: how many York. people come in and how long they stay. Yet • The Midwest’s prison population continues both variables are the products of a dizzying to rise primarily because of increases in new array of influences, from policy-level decisions prison admissions and parole violations. and the discretion that judges, prosecutors Iowa’s prison population is expected to and corrections officials exercise in individual increase at a slower rate than other cases, to the larger forces at work in society. Midwest states. • Though the Northeast boasts the lowest During the past three decades, a number of incarceration rates, it has the highest costs changes in states’ sentencing and corrections per prisoner, led by Rhode Island ($44,860), policies have been particularly significant. Massachusetts ($43,026) and New York These include movement from indeterminate ($42,202). The lowest costs are generally in to determinate sentencing; abolition of parole the South, led by Louisiana ($13,009), and adoption of truth-in-sentencing Alabama ($13,019) and South Carolina requirements; lower parole grant rates; passage ($13,170). of “three-strikes” laws; and establishment of sentencing guidelines. While the impact of reforms varies in each state, the states report Driving Forces that these policy decisions are among the major drivers of their prison populations. Predicting the future is a risky business, of course. In Charles Dickens’ Christmas Carol, Scrooge asks the last ghost that appears to Implications for Public him, “Are these the shadows of the things Safety and Public Policy that Will be? Or are they shadows of things that May be, only?” It’s a tempting leap of logic to assume that the more people behind bars, the less crime In the world of criminal justice policy, as much there will be. But despite public expectations as in Dickens’ famed tale, nothing is inevitable. to the contrary, there is no clear cause and The size and attributes of a state’s prison effect. In fact, the question of the effect that population are linked to an array of factors. imprisonment has on crime rates cannot be Population growth and crime rates can be the solved with simple arithmetic. It requires fuel for this fast-moving train, but the throttle something more like a social policy calculus. is in the hands of state leaders who make related policy choices. Some of these decisions The central questions are ones of are made on the basis of careful analysis of effectiveness and cost. Total national facts and history. Others are predicated on spending on corrections has jumped to more anecdote and the impact a single, particularly than $60 billion from just $9 billion in 1980, iv Public Safety, Public Spending
  • 7.
    and yet recidivismrates have barely changed. More than half of released prisoners are back Methodology Overview behind bars within three years. If states want the best results from their correctional Forecasting prison populations has grown more sophisticated since systems over the next five years—both in the days of estimating using time series or trend analysis, which showed what had already happened but failed to make accurate terms of public safety and public spending— projections of future patterns. Today’s more advanced models are how should they approach the significant designed to mimic the flow of the correctional system based on prison population growth that is anticipated? probabilities of prison admissions and inmate lengths of stay. That question is the chief challenge states are facing. They are not fated to such high rates This national prison projection report was generated from data from of prison growth by factors out of their the states themselves. The federal Bureau of Prisons and 42 states (including the 36 states that use advanced simulation methods) control. The policy choices they make—the provided their official forecasts to form the basis of this report. Those sentencing and release laws, programs and jurisdictions accounted for 92 percent of the national prison population practices they enact and fund—are principal as of 2005. The remaining eight states were unable to provide determinates of the size, effectiveness and projections, so researchers calculated estimates using the states’ own cost of their corrections systems. most recent monthly population counts and available admission and release data. Those estimates—for Alaska, Connecticut, Delaware, The key is for policy makers to base their Maine, New York, Utah, Wisconsin and Wyoming—are not official forecasts. decisions on a clear understanding of the costs and benefits of incarceration—and of Researchers also contacted each state to obtain the most current costs data-driven, evidence-based alternatives that per prisoner. The cost figures included administrative support, program can preserve public safety while saving much- services and facility maintenance. If a state contracts with a private needed tax dollars. To begin the process of prison company, researchers attempted to incorporate those into the looking at costs and benefits, state policy annual cost figure. makers need to know whether, and at what It’s important to note that an increase or decrease in a state prison rate, their correctional system is likely to population will not yield a direct change in operating costs. Some grow, and how their system’s growth rate states whose prison populations grow by only a small amount will compares to that of other states. By providing experience only marginal cost increases, such as the costs of medical this comparative data, this forecast can assist care and food; they will likely not need to hire additional staff or build states in their efforts to develop cost-effective new cells. Other states may pass a tipping point and proceed with options that reduce corrections expenditures constructing new prisons and taking on new staff. while protecting public safety. It’s possible, too, that the projected population may involve disproportionately lower-custody inmates or that a state may employ Those last two words—public safety—are of alternative, lower-cost housing methods and divert some offenders into particular consequence. No policy maker is community punishments. These scenarios would result in an likely to (or should) pursue a path that saves overestimate of future costs if the estimate is made using an average prison money if it runs a substantial risk of cost per inmate. increasing recidivism or crime rates. On the Capital costs for corrections are more difficult to project than operating other hand, an option that can lead to better costs. Prison beds cost about $65,000 to construct, but total public safety outcomes while saving money is construction cost figures exclude renovation and conversion of the picture that goes alongside the dictionary existing bed space. definition of win-win. For these reasons, the report does not provide cost estimates for each individual state. Public Safety Performance Project v
  • 9.
    Table of Contents Introduction .....................................................................................................................1 Forecasting Correctional Populations ........................................................................3 Micro-simulation Models ..........................................................................................................6 Accuracy of the Projection Models...........................................................................................7 National Prison Population Projection Estimates ...................................................9 Growth of Women Prisoners Will Continue to Outpace Males............................................10 Age of Inmates (and the Cost of Their Medical Care) is Expected to Rise .........................11 Corrections Workforce Recruitment and Retention is a Growing Concern .........................11 Rise in Methamphetamine-related Cases ...............................................................................11 Impact of Enhanced Sex Offender Sentences Will Be Felt Beyond Five Years .....................12 Regional and State Trends..........................................................................................13 Northeastern Region ...............................................................................................................13 Midwestern Region .................................................................................................................14 Southern Region .....................................................................................................................15 Western Region .......................................................................................................................17 Estimating Current and Future Prison Costs .........................................................18 Methodological Issues.............................................................................................................19 Current Operational Costs .....................................................................................................20 Estimates of Future Operational Costs ..................................................................................21 Capital Costs...........................................................................................................................22 The Relationship Between Incarceration and Crime Rates.................................23 Public Safety, Public Spending: The Challenge Ahead for State Policy Makers........................................................25 Appendix.........................................................................................................................27 Public Safety Performance Project vii
  • 10.
    Tables and Figures Table 1: Adult Correctional Populations, 1980-2005..........................................................2 Figure 1: Schematic Flow of Prison Population Components..............................................4 Figure 2: Crime and Incarceration Rates by State, 2004 .....................................................5 Figure 3: National At-Risk Population: Males Between 18-34.............................................6 Figure 4: Accurate Projections: West Virginia, 2004-2006 ..................................................8 Figure 5: Projections Responding to Change: Nevada, 2005-2006 .....................................8 Figure 6: Projected National Prison Population and Incarceration Rate, 2006-2011 ........10 Figure 7: Projected Change in Regional Incarceration Rates, 2006-2011 .........................10 Table 2: Ohio 10-Year Prison Population Projections, 2007-2016 .....................................14 Figure 8: Projected Year-End Resident Population by Region, 2006-2011 ........................15 Table 3: Nevada 10-Year Prison Population Projections, 2007-2016.................................16 Table 4: Arizona 10-Year Prison Population Projections, 2007-2016 ................................16 Table 5: Costs Per State Prisoner, 1984-2005 ...................................................................21 Figure 9: National Crime and Imprisonment Trends, 1931-2005 .....................................23 Appendix Table A-1: Key State Data, 2005 ...........................................................................................27 Table A-2: State, Regional and National Residential Populations, 2005-2011.....................28 Table A-3: State Prison Populations by Region, 2006-2011 .................................................29 Table A-4: State Prison Populations by Growth Rate, 2006-2011 .......................................30 Table A-5: State Incarceration Rates by Region, 2006-2011 ................................................31 Table A-6: State Incarceration Rates by Growth Rate, 2006-2011.......................................32 Table A-7: Annual Operating Costs per Inmate...................................................................33 Table A-8: Sources of State Prison Population Projections...................................................34 Table A-9: Sources of State Inmate Costs .............................................................................36 viii Public Safety, Public Spending
  • 11.
    Introduction his report estimates the T world in incarceration rates, well above Russia future size and cost of the state and and Cuba, which have the next highest rates federal prison systems. It examines of 607 and 487 per 100,000. Western the reasons for the projected growth and, since European countries have incarceration rates prison expansion is generally intended to that range from 78 to 145 per 100,000.3 reduce crime, it outlines what we currently know about the relationship between Probation and parole populations have incarceration and crime rates. Finally, the skyrocketed alongside the rapid growth in the report highlights the efforts of some states to state and federal prison systems. Since 1980, control corrections spending while protecting the total correctional population has grown public safety and holding offenders from 1.8 million to over 7 million people accountable for their actions. (Table 1). While the prison population has grown at the fastest rate, more than 4 million The past three decades have witnessed an adults are on probation, making that the At year-end historic increase in the nation’s penal system largest component of the correctional system; 2005, there were at all levels. In 1970, the state and federal it too has nearly tripled since 1980. prison population was less than 190,000. The almost 2.2 million latest report by the U.S. Department of Justice While noteworthy in their own right, national people—one in puts the 2005 population at nearly 1.5 trends tend to mask significant state-level every 136 U.S. million. Further, almost 750,000 people are variation. This is the case both for incarcerated in local jails, resulting in a total incarceration (covering jails and prisons)4 and residents— incarcerated population of almost 2.2 million, the population under community supervision in U.S. jails or 737 per 100,000 U.S. population.1 Put (including parole and probation). For and prisons. differently, for every 1,000 U.S. residents, example, while the national prison seven are incarcerated either in jail or prison incarceration rate in 2005 was 491 per on any given day. Each year, over 600,000 100,000 residents, Louisiana had the highest people are admitted to state and federal prison incarceration rate (797 per 100,000) prisons. A much larger number (over 10 followed by fellow Southern states Texas million) go to local jails. There are another (691), Mississippi (660) and Oklahoma (652). 4.3 million ex-convicts living in the U.S.2 Maine had the lowest incarceration rate (144), followed by Minnesota (180), Rhode Island The U.S. imprisons significantly more people (189) and New Hampshire (192).5 than any other nation. China ranks second, imprisoning 1.5 million of its much larger While it is generally true that Southern states citizen population. The U.S. also leads the have high incarceration rates while Public Safety Performance Project 1
  • 12.
    national correctional system.Currently, each TABLE 1 state bears responsibility for forecasting its Adult Correctional Populations, 1980–2005 own population. A national forecast such as this will have several important uses. Population 1980 2005 % Change Probation 1,118,097 4,162,536 272% First, state policy makers need to know how Jail 183,988 747,529 306% Prison 319,598 1,461,132 357% much their correctional system is likely to Parole 220,438 784,408 255% grow, if at all, so that they at least can ensure Total Adults that sufficient funds are available to support Under Corrections 1,842,100 7,155,605 288% growth. This is especially true for the jail and Adult Population 162.8 Million 222.3 million 36% prison systems that must maintain standards of % of Adults Under care for their prisoners. Second, because Corrections 1.1% 3.2% differences in population increases often reflect Sources: U.S. Department of Justice, Office of Justice Programs. Prisoners in 2005, Bureau of Justice Statistics Bulletin, by Paige M. Harrison and Allen J. Beck (Washington, D.C.: differences in criminal justice policies, November 2006), NCJ 215092; U.S. Department of Justice, Office of Justice Programs. Prison and Jail Inmates at Midyear 2005, Bureau of Justice Statistics Bulletin, by Paige M. understanding such policy differences and their Harrison and Allen J. Beck (Washington, D.C.: May 2006), NCJ 213133 and U.S. Department of Justice, Office of Justice Programs. Probation and Parole in the US 2005, Bureau of impact on prison populations and costs can Justice Statistics Bulletin, by Lauren E. Glaze and Thomas P. Bonozar (Washington, D.C.: November 2006), NCJ 215091 help policy makers better evaluate whether they should pursue reforms. Third, given the Northeastern states have low rates, there is large and increasing amount of taxpayer funds considerable variation even among states being devoted to prison systems, policy makers from the same region or sharing similar want to ensure that their investments in public crime rates. For example, North and South safety are generating their intended results. If Dakota had low but very different other states are slowing the growth of their incarceration rates in 2005: 208 per 100,000 prison populations while achieving better for North Dakota versus double that—443— public safety outcomes, such as lower for South Dakota. In the South, North recidivism rates or lower crime rates, policy Carolina’s incarceration rate is 360 while makers want to know that. South Carolina’s is 525.6 As discussed later, these pronounced differences in incarceration Finally, the costs of constructing and operating rates often reflect different sentencing laws and jail and prison systems are an ongoing concern correctional policies that have been adopted by for policy makers. Between 1982 and 2003, policy makers. In other words, the size and national spending on criminal justice increased attributes of a state’s prison population are from $36 billion to $186 billion. Over $61 heavily determined by policy choices. billion of that total is allocated to local, state, and federal corrections.7 Indeed, corrections In light of that, it would be valuable for policy spending—which consists primarily of budgets makers and the public to understand the likely for jails and prisons—grew by more than 570 future outcomes in states that have adopted percent during that period, faster than any varying policies. While the U.S. Department other aspect of the criminal justice system. of Justice provides accurate and Given the phenomenal period of growth in comprehensive historical data on the size and correctional populations and its associated attributes of the various correctional costs to the taxpayer, public officials are populations, there is no organization or agency becoming increasingly concerned about what that provides estimates of the future size of the the costs will look like in the future. 2 Public Safety, Public Spending
  • 13.
    Forecasting Correctional Populations stimating the future size of any E The basic formula is: correctional system is part science and Prison admissions x length of stay (LOS) = part judgment. Criminal justice policy Average Daily Population (ADP)8 is a dynamic phenomenon and is difficult to predict with a high degree of certainty. This simplistic formula becomes far more During the past three decades, we have complex when one begins to understand the witnessed a wide array of policy shifts in myriad factors that can influence admissions sentencing, including some states abolishing and the LOS. Relatively minor changes in parole, moving from indeterminate to admissions or LOS can have an enormous determinate sentencing, establishing impact on the ADP. For example, if the LOS sentencing guidelines, and adopting truth-in- in a prison system is 30 months, an increase sentencing and “three-strikes” laws. Many of of three months in the LOS would increase these changes were intended to remove repeat the ADP by 10 percent. Changes in the LOS offenders from the streets. But as the cost of can be achieved by modifying sentence corrections has skyrocketed, so has interest in lengths, awarding or rescinding good time finding cost-effective options that could credits, changing parole eligibility dates, and reduce expenditures without jeopardizing paroling (or not paroling) offenders at either public safety. their initial parole date or at a subsequent parole Between probation, parole, Identifying these options requires sound hearing. jail and prison, the U.S. research, comprehensive analysis and reliable forecasting techniques to better inform Figure 1 illustrates the correctional population policy makers and the public about the various internal and exceeds 7 million people. consequences of current and proposed external factors that One in every 32 U.S. adult policies. Estimating the future prison influence ADP and population is the beginning of this enterprise, therefore influence a residents is currently under not the end. Decision makers need to forecast of the future ADPs. correctional supervision. understand why prison populations are External factors reflect the growing and how future changes will affect interplay of demographic, socio-economic and the system. crime trends that produce arrests, and offenders’ initial entry into the criminal justice In the simplest terms, prison populations process. Criminologists have long noted that (and all correctional populations) are the certain segments of the population have higher result of two factors: the number of people rates or chances of becoming involved in admitted to prison and how long they stay. crime, being arrested and being incarcerated. Public Safety Performance Project 3
  • 14.
    FIGURE 1 Schematic Flow of Prison Population Components Demographics—at risk population Crime Arrests New New Charge Convictions Charge Probation Prison Technical Violator Technical Violator Parole/Community Supervision Release to Community 4 Public Safety, Public Spending
  • 15.
    FIGURE 2 Crime and Incarceration Rates by State, 2005 800 LA 700 Incarceration Rate per 100,000 residents TX MS OK 600 AL MO GA SC AZ 500 ID MI FL KYVA DECA AR NV SD CO TN WY AK 400 CTWI MT IN OH MD IL NC OR NY NJPA KS NM HI 300 WV IA WA VT MA NE UT 200 NH ND RI MN ME 100 0 0 1000 2000 3000 4000 5000 6000 Crime Rate per 100,000 residents Source: FBI Uniform Crime Report and BJS This is known as the “at-risk” population, It is unfortunate but true that African- which generally consists of younger males. Americans and Hispanics have significantly The high crime rate ages are 15-25, while the higher arrest and incarceration rates than high adult incarceration rate is between the whites. One must also factor in the extent to ages of 18 and 35. When the at-risk which these racial and ethnic groups within population is expected to increase in a these age ranges are also projected to jurisdiction, one can also expect some increase. As shown in Figure 3, the number additional pressure on criminal justice of at-risk African-American and Hispanic resources, all things being equal. males has been increasing over the past few years. States that are projected to have a Figure 2 shows the association between crime larger at-risk population over the next decade rates (which are produced in part by also are likely to experience continued demographic and socio-economic trends) and pressures on criminal justice and correctional incarceration rates. The figure plots the crime resources based on demographic growth. and incarceration rates for each state, showing that states with low crime rates tend to have Internal factors reflect the various decision lower incarceration rates. The spread of states points within the criminal justice system that up and to the right on the graph shows that cumulatively determine prison admissions states with higher crime rates tend to have high and LOS. These decisions begin with police incarceration rates. The last section of this and end with correctional officials who, report summarizes what is known about the within the context of the court-imposed relationship between crime and incarceration. sentences, have the authority to release, Public Safety Performance Project 5
  • 16.
    criminal justice systemsoften vest considerable FIGURE 3 discretion in their public leaders who construct National At-Risk Population: these policies and procedures. A complete Males Between 18-34 understanding of these complex influences is 25 m essential to the accuracy of planning and 20 m White forecasting a prison or jail population. 8m Hispanic Micro-simulation Models 7m Traditionally, prison populations were 6m estimated using time series or trends analysis. 5m Black This was easy to do since the historic counts 4m were readily available and it required little 2000 2001 2002 2003 2004 2005 2006 2007 2008 2009 2010 2011 — skill to use such methods. These methods Source: U.S. Census Bureau were very inaccurate, however, especially in recommit, give and restore a wide array of an environment where policy is very good time credits, and offer supervision and dynamic. Time series models can show only services that may reduce recidivism.9 what has already occurred; they cannot estimate future populations based on current For example, one of the most difficult or future criminal justice policies and numbers to estimate is the number of prison sentencing legislation. admissions for the next five years. As suggested by Figure 1, people come to prison To better account for such a complex and for three basic reasons: (1) they have been dynamic system, a new generation of micro- directly sentenced by the courts to a prison simulation models has been developed to help term (new court commitments); (2) they have decision makers estimate the effects of current failed to complete their term of probation and policies and the likely consequences of specific are now being sentenced to prison for a policy proposals. These micro-simulation violation of the conditions of their release or models are designed to mimic the flow of (1) new crime; or, (3) they have failed their term the current prisoner population, and (2) the of parole (or post-release supervision) and are expected new admissions over the projection being returned to prison for a violation of the horizon based on these internal factors. Based conditions of their release or new crime. on stochastic entity simulation methods, the Almost two-thirds of the estimated 600,000- models mimic the actual flow of the plus people who are admitted to prison are correctional system based on current and future those who have failed to complete probation probabilities of being admitted to prison under a or parole. A projection model thus should particular legal status, with a certain sentence have a “feedback loop” that captures the for a certain crime, and being released at a expected rate of probation and parole failures. certain time based on probabilities of receiving good time and being released on parole. The impact of recently enacted sentencing Similarly, each person released to probation or laws, judicial decisions and other criminal parole has a certain probability of being justice policy choices also must be considered revoked for a new crime or technical violation in a population forecast. These complex factors and being returned to prison for a certain also vary from state to state. State and local period of time before being re-released. All of 6 Public Safety, Public Spending
  • 17.
    these “probabilities” arebased on the current Time series or regression models are not able behavior of the decision makers. to employ such techniques and thus are less able to demonstrate their accuracy. Moreover, Accuracy of the because they are based on historical patterns Projection Models that do not account for contemporary policies A recurring question about any projection or laws, they often either over- or model is its accuracy. In one sense this is the underestimate short-term developments. wrong question to ask, since a forecast of any correctional system is predicated upon the Figures 4 and 5 highlight recent accuracy assumptions of future criminal justice policy. analyses for West Virginia and Nevada, both Because such policies are constantly in flux, of which employ simulation models. West the projection must be modified as lawmakers Virginia reflects a fairly stable policy adopt new policies and correctional officials environment, so the 2004 projection has been adjust their administrative procedures. For quite accurate for the past two years. example, if a parole board implements new Conversely, the Nevada estimate issued in parole guidelines that serve to increase the March 2005 began to display an rate of parole for low-risk prisoners from 35 underestimate in fall 2005. This was caused percent to 50 percent, the projection model’s by a significant and unexpected surge in new parole grant rates must be similarly adjusted court commitments, largely from the Las and thus show a lower forecast. If the Vegas metropolitan area. The model’s new legislature adopts a longer sentencing range court intake estimates were then adjusted for drug dealers that is not retroactive to the with the assumption that new admissions current prisoner population, the new would continue to grow at the 2006 rather admission stream must be altered and will than the 2005 rate. As shown in the graph, show a higher projection. this single change in the new admission assumption increased the 10-year forecast by Despite the nuances of the dynamic policy over 900 prisoners. arena, the models must demonstrate that they would be accurate if policies remain constant. The micro-simulation models are especially adept in this regard if they are designed to model both the current and future correctional populations. For the first 12 to 18 months of a projection, the current parole and prison populations have a large influence on the forecast since it takes that long for large numbers of that population to exit. Further, the micro-simulation models are loaded with the most current data to reflect current practices and are then “started” several months in the past to see if they are mimicking actual monthly counts of admissions, releases and populations. Only when this test has been successful is the forecast deemed “accurate.” Public Safety Performance Project 7
  • 18.
    Two of themost significant examples of FIGURE 4 overestimates occurred in Virginia after it Accurate Projections: West Virginia, 2004-2006 adopted truth-in-sentencing laws and in 5800 California after it adopted its “three-strikes” 5600 mandatory sentencing laws. The Virginia 5400 error resulted in a massive over-construction Actual plan to build prison beds that were not Inmates 5200 Projected 5000 needed. In subsequent years Virginia was able 4800 to cancel some of its construction plans and 4600 recoup some of its losses by renting out the 4400 surplus prison beds at a profit to states that 4200 had crowded systems. Jan Apr Jul Oct Jan Apr Jul Oct Jan Apr Jul 04 04 04 04 05 05 05 05 06 06 06 In California, the original estimate was that the Source: JFA Institute “three-strikes” legislation would more than double the inmate population from 121,000 FIGURE 5 prisoners in 1994 to over 245,000 in 1999. It Projections Responding to Change: turned out that the prison population rose to Nevada, 2005-2006 160,000. The estimate was off by a staggering 13500 85,000 inmates. The primary source of the July 2006 projection 13000 error was an assumption that all criminal cases 12500 Actual population that fit the criteria for either a second- or third- Inmates 12000 strike sentence would be so prosecuted. In 11500 reality, prosecutors used the law to plea April 2005 projection bargain a large number of cases to lesser 11000 10500 charges. And in several major counties, 10000 including San Francisco and Alameda Jan Mar May Jul Sep Nov Jan Mar May Jul Sep (Oakland), prosecutors rarely applied the law.10 05 05 05 05 05 05 06 06 06 06 06 Source: JFA Institute The lesson for “projectionists” is that they The level of accuracy raises the issue of must anticipate adjustments that practitioners under- and overestimates. It is fair to say that will make to new policies that strain their correctional officials are more fearful of an agencies’ capacities or their local community underestimate, which may lead to crowding standards. For instance, it can’t be assumed and perhaps a more dangerous prison that mandatory sentencing laws will be strictly environment. Overestimates typically pose followed by prosecutors or the courts. For this little operational problem to prison officials reason it is useful to discount the estimated who may welcome a surplus of vacant prison effects of such laws. beds or at least a reduction in existing crowding. However, overestimates are viewed with disdain by some state fiscal analysts, who may feel (rightly or wrongly) that the projections were manipulated by the prison agency to secure extra, unneeded funding. 8 Public Safety, Public Spending
  • 19.
    National Prison Population ProjectionEstimates o make an estimate of the T 4. The Western region will have the largest U.S. prison population, the researchers prison population increase (18 percent) for this report contacted each of the 50 while the Northeast will experience the states and the federal Bureau of Prisons (BOP) smallest growth (7 percent). and requested their current official population 5. There is considerable variation among the projections. Where available, projections by states. Montana, Alaska, Arizona, Idaho, gender were also requested. Vermont and Colorado all are poised to grow by more than 30 percent under The BOP and 42 states provided at least a five- current criminal justice policies. year prison population forecast. These Conversely, Connecticut, Delaware, New reporting jurisdictions accounted for 92 percent York and Maryland are expected to have of the national prison population as of 2005. little if any growth. For the remaining eight states, researchers 6. Four states—Florida, California, Arizona made estimates based on current population and Texas—and the federal prison system trends and extrapolated for five years.11 will account for more than 87,000 additional prisoners, or about 45 percent of Figures 6 and 7 provide the national and the total prison population increase. regional estimates based on the data received from the states and the BOP and the In reviewing these trends estimates for states with no official projection. and discussing them with By 2011, America’s prison Detailed tables for each state are shown in the states, researchers population is projected to the appendix. The national and state learned that a wide array of increase by 192,000 to over estimates reveal the following major trends: factors were influencing these estimates. For a 1.7 million inmates. 1. The nation’s state and federal prison number of Southern and One in every 182 U.S. population will reach 1,722,477 by 2011— Western states, demographic residents will live in prison. an increase of approximately 192,000 over growth, particularly for the a five-year period. at-risk population, was a 2. This rate of growth—about 38,400 more major concern. This was especially true in inmates per year—is markedly higher than Arizona, Nevada and Texas, all of which have the growth rate of the past three years. recently increased their prison population 3. The prison incarceration rate will continue estimates because of increases in prison to grow, from 491 per 100,000 U.S. admissions for new court sentences or residents in 2005 to 511 per 100,000 in probation revocations. However, incarceration 2006, then to 550 per 100,000 in 2011. rates in all three states will grow, meaning that Public Safety Performance Project 9
  • 20.
    inability to reduce FIGURE 6: recidivism rates—all Projected National Prison Population contributed to the and Incarceration Rate, 2006-2011 higher projections. US Prison Population Inmates per in millions 100,000 residents 1.80 560 A region-by-region 1.75 550 540 summary of the Incarceration Rate 544 538 estimates and factors 1.70 530 520 519 1,722,477 that underpin the 511 1,686,495 1.65 500 estimated growth 1,654,668 1.60 Prison Population 480 follows. But before 1,614,808 proceeding to these 1.55 1,568,822 460 regional variations, a 1.50 1,530,454 440 number of other 1.45 420 policy-related issues merit discussion. 1.40 400 2006 2007 2008 2009 2010 2011 These issues emerged during researchers’ Source: JFA Institute interviews with state correctional officials and planners who are directly involved in the states’ forecasts. FIGURE 7 Projected Change in Regional Growth of Women Prisoners Will Incarceration Rates, 2006-2011 Continue to Outpace Males The female prisoner population, while well 16% below the size of the male prisoner 14% population, has been growing at a faster rate 12% 10% for many years. The Bureau of Justice 8% Statistics (BJS), part of the U.S. Department 6% of Justice, notes in its most recent prison 4% population report that the female population 2% has grown by 57 percent since 1995, 0% Northeast Midwest South West compared to a 34-percent increase for males.12 For this forecast, 25 states, covering only Source: JFA Institute about one-third of the national prison the greater prison admissions or longer LOS, population, were able to provide their or both, are causing the prisons to grow faster projections by gender. In these 25 states, than the general population. In these and other females are expected to grow at a faster rate states, state officials reported that the (16 percent) than males (12 percent). cumulative effects of lengthy mandatory prison Researchers’ interviews with other state terms adopted in the 1980s and 1990s, reduced correctional officials suggest that higher parole grant rates, and high numbers of parole female growth rates are likely to continue in and probation violators—coupled with an the other states as well. 10 Public Safety, Public Spending
  • 21.
    Disaggregating in thismanner is desirable Corrections Workforce because women have unique security and Recruitment and Retention programmatic needs that may not be met if is a Growing Concern the size of the female population is not As their prison populations increase, states properly estimated. For example, women are need to find qualified applicants for typically housed in much lower-security-level correctional officer positions and other prison facilities than men and require a lower staff- jobs. Many of the state officials contacted for to-inmate ratio. The construction of female this report expressed concern that even if facilities is increasingly designed to meet the they can secure the necessary funding to unique custody and service needs of women. build and operate an expanded prison Also, because the female prison population system, it will be increasingly difficult to find has risen faster for the past decade, failure to qualified workers to fill these positions. perform separate forecasts by gender could These officials already face a high turnover distort growth estimates for women rate and a growing number of “baby prisoners. boomer” employees now nearing retirement. A number of Southern states (especially In addition, females generally pose a Louisiana, Mississippi and Alabama) are significantly lower risk to public safety than hoping to increase salary levels to attract and males. BJS studies of female recidivism rates retain qualified staff to work in prisons that have consistently shown that women have a are often located in economically depressed lower recidivism rate than males and are far rural areas. Such increased salaries will carry less likely to commit a violent or sex crime an obvious fiscal burden for state upon release.13 The disproportionate increases governments. in the female prison population, then, are somewhat ironic. Methamphetamine-related Cases are on the Rise Age of Inmates (and the Many states are seeing significant growth Cost of Their Medical Care) in prison admissions related to is Expected to Rise methamphetamine addiction. In Georgia, for BJS reports that the average age of prisoners example, meth-related admissions more than being released to parole has increased from tripled, from 977 inmates in fiscal years 1999 31 to 34 between 1990 and 1999.14 There are and 2000 to 3,579 in fiscal years 2004 and no more recent national data, and states were 2005. With meth offenders currently serving not able to provide prisoner age projections an average of 5.5 years in prison, officials for this report, but policy experts and state estimate that the cumulative cost of housing officials are concerned that the aging trend these inmates alone will exceed $340 will accelerate largely because of the longer million.15 prison terms being served under various sentencing and release laws and policies. This The rise of meth cases is not readily reflected presents a major fiscal concern for states, in the current forecast, but correctional because as the prison population ages, the officials have become increasingly concerned medical costs of the corrections system are that larger proportions of the probation and expected to rise accordingly. parole populations are using the drug and thereby increasing the likelihood of probation Public Safety Performance Project 11
  • 22.
    and parole revocations.To control the The current five-year state projections do not problem and its impact on prisons, many reflect the long-term effects of such laws. The correctional officials are calling for more laws typically are not retroactive, and because community-based treatment beds and wider many of these offenders already spend longer adoption of evidence-based practices for than five years behind bars, the impact of the treating meth abusers. longer sentences will not be felt on populations and budgets for some time Impact of Enhanced Sex beyond the next five years. Over the next Offender Sentences Will Be two decades, however, one can expect the Felt Beyond Five Years number of prisoners convicted of sex crimes Many states have recently passed sentencing to expand rapidly. laws for sex offenders that require a lengthier period of incarceration and/or a lengthier and more intense period of parole supervision. One example is California, which under the recently passed Proposition 83 requires sex offenders to be tracked electronically for life. This law will no doubt increase the number of parolees returned to prison for technical violations. In Kansas, a law enacted in 2006 will result in approximately 150 persons convicted of child sex crimes being sentenced to prison for terms approximately 16 years longer than under earlier sentencing practices. 12 Public Safety, Public Spending
  • 23.
    Regional and StateTrends Northeastern Region recidivism reduction initiatives. They funded The Northeast historically has the lowest two programs targeting violators, and required incarceration rates, which will continue to be the development of a comprehensive re-entry true well into the next decade. Led by New plan, with focus on the specific neighborhoods York, Massachusetts, New Jersey and to which most prisoners were returning. Connecticut, these states are estimating little if any growth. Part of the explanation for this Within two years following the development trend is demographic, as this region is and adoption of this strategy, Connecticut estimated to grow slowly. Crime rates also are went from having one of the fastest-growing relatively low. The stability of incarceration prison populations in the nation to rates results from more than demography and experiencing a decline steeper than almost crime rates, however; states also have adopted any other state. Crime rates in Connecticut new policies that have controlled prison also dropped during this period, faster than population growth. In both Massachusetts they were falling in the nation overall. and New Jersey, for example, parole grant rates have increased while state leaders have Another big story in the resisted calls to increase sentencing lengths. Northeast has been New Change in five-year projected York, where the prison state prison populations varies Connecticut may provide one of the most population has declined striking and successful examples of policy from a peak of 72,889 in radically, from no growth in intervention. Using data-driven analyses, 1999 to its current level of New York, Delaware and Connecticut policy makers identified that about 63,000. Virtually all Connecticut to 41 percent parole and probation violators were driving of this historic decline has much of the prison growth. They passed resulted from dramatic growth in Montana. legislation in 2004 that set a goal of reducing reductions both in serious parole and probation revocations by 20 crime and in the number of felony arrests, percent, and hired 96 new probation officers, much of which can be linked to the well- reducing caseloads from approximately 160 known reforms within the New York City cases per officer in January 2004 to police department.16 Indeed, admissions to approximately 100 cases per officer in June state prison from New York City fell from 2005. 20,580 in 1993 to 8,490 in 2005. While the state has not issued a formal prison As part of a “justice reinvestment” strategy, population forecast, the most recent trends Connecticut redirected $13 million of the show no reason to expect significant increases expected savings from those reforms into over the next five years. Public Safety Performance Project 13
  • 24.
    extending parole terms,especially for sex offenders. Although the Department of Corrections has expanded the programmatic opportunities available to inmates, and linked participation to additional good-conduct credits, these efforts have not offset the impact of sentencing initiatives enacted in Illinois during the late 1990s. Ohio had been experiencing declining prison populations since 1999 as a result of a sentencing reform initiative. Now the state is experiencing increases because of higher- than-expected prison admissions. A surge in Midwestern Region admissions of white females from a number The prison population of the Midwest of rural counties has been especially continues to grow, primarily as a result of dramatic. Based on these developments, Ohio increases in prison admissions from both new estimates it will add over 17,000 inmates to its court admissions and parole violations. In prison population over the next 10 years, a some states the long-term effects of truth-in- 37-percent increase. The female population sentencing laws that were enacted more than will grow at an even faster rate of 47 percent. a decade ago are now affecting lengths of stay. In Illinois, for example, prison Kansas is another Midwestern state that has admissions have increased every year, with changed its direction. Between 2003 and 2006, the system thus setting new highs annually. the prison population remained fairly stable. Parole violation rates are at a record high, With the passage of new child sex offender and policy makers have enacted several laws legislation and increases in the number of offenders being imprisoned for violating probation, the state’s latest forecast shows that TABLE 2 the prison population will increase from Ohio 10-Year Prison Population Projections, approximately 9,000 to 11,231 by 2016. These 2007–2016 projections would be even higher were it not for recent legislative actions and correctional Date Male Female Total 2006 43,965 3,554 47,519 policy changes that will hold technical parole 2007 45,485 3,726 49,211 violators accountable with graduated sanctions 2008 47,563 3,985 51,548 prior to returning them to prison. 2009 49,354 4,249 53,603 2010 50,889 4,416 55,305 2011 52,625 4,598 57,223 Iowa provides an interesting example of a 2012 53,832 4,699 58,531 state in which the prison population is 2013 55,384 4,802 60,186 projected to grow, but at a slower rate than 2014 56,941 4,914 61,855 other Midwestern states. There have been 2015 58,184 5,088 63,272 2016 59,756 5,214 64,970 fewer new court commitments for the state in % Change 36% 47% 37% recent years, although that has been Note: 2006 figure is the actual population as of 10/2/06. somewhat offset by higher rates of probation 14 Public Safety, Public Spending
  • 25.
    and community FIGURE 8 supervision (parole) Projected Year-End Resident Population admissions. To by Region, 2006-2011 control its prison 320 m population, Iowa also relaxed its truth-in- Total 290 m sentencing laws, dropping its 120 m requirement of time South 110 m served from 85 percent to 70 100 m percent, and 80 m increased the number of paroles. As a 70 m West result of these Midwest 60 m changes, Iowa’s growth rate is 50 m Northeast projected to be low for the next five 40 m 2006 2007 2008 2009 2010 2011 years. The long-term Source: JFA Institute estimates are higher, however, because of the long-term effects of which has one of the largest state prison other decisions the state has made, such as populations, is estimated to grow by an abolishing or restricting parole for certain additional 13,656 prisoners over the next five crimes and increasing sentences for sex years. Florida, another large state, will offenders. Iowa estimates its prison incarcerate more than 100,000 people by population will rise from 8,737 in 2005 to 2011. At the same time, Maryland and 11,240 in 2015. As in Ohio, the female Delaware have stable population trends. population is projected to grow faster than These states have been very active in the male population. adopting a variety of reforms designed to control Southern Region prison population growth. By 2011, the imprisonment The Southern states traditionally have had rate of the South will the highest rates of incarceration, and that Texas’s prison system will exceed that of the will continue to be the case. Figure 8 shows continue to grow in part the projected populations of the four regions, because of simple Northeast by 80 percent. with the South having the greatest projected demographics: the state is growth. Yet the forecast shows Southern expected to grow by more than 2.3 million states moving in different directions over the residents over the next five years, for a total next five years. population of over 25 million. However, its incarceration rate is projected to grow as well, Some Southern states, such as Texas, Florida, the result primarily of low parole grant rates Georgia, South Carolina and West Virginia, and a high number of probation revocations. are projecting significant increases. Texas, Texas policy makers have begun to evaluate Public Safety Performance Project 15
  • 26.
    changes on bothfronts to help slow the TABLE 3 anticipated growth. The state parole board is Nevada 10-Year Prison Population Projections, analyzing its compliance with parole 2007–2016 guidelines and may change its decision- making criteria. And in their 2007 session, Year Male Female Total Texas lawmakers are expected to consider Population Population Population 2005 11,075 1,008 12,083 major policy initiatives to reform probation, July 2006 11,662 1,134 12,796 increase intermediate sanctions and expand 2006 12,081 1,158 13,239 treatment capacity in the correctional system. 2007 12,496 1,236 13,732 2008 12,984 1,305 14,289 2009 13,727 1,402 15,129 In Louisiana, partly in response to the 2010 14,378 1,484 15,862 devastation caused by hurricanes Katrina and 2011 15,188 1,576 16,764 Rita, the state legislature passed several bills 2012 15,935 1,657 17,592 designed to reduce the length of incarceration 2013 16,727 1,755 18,482 2014 17,515 1,849 19,364 modestly by granting more good time to 2015 18,243 1,957 20,200 prisoners who complete treatment programs 2016 19,066 2,057 21,123 and have satisfactory work conduct records. Numeric Change 2006 – 2016 6,985 899 7,884 The state has also enacted a law limiting to Percent Change 2006 – 2016 57.8% 77.6% 59.6% Note: Numbers represent end of calendar-year figures (with the exception of the July 2006 90 days the amount of time a probation or figure, which represents the July 31, 2006, population). Year 2005 and July 2006 rows show parole technical violator can serve in prison actual population figures. for a first revocation. Louisiana also is launching a number of reforms to expedite parole hearings. Its prison population is TABLE 4 expected to rise by 4 percent over the next Arizona 10-Year Prison Population Projections, five years. 2007–2016 Year Male Female Total Maryland and West Virginia have adopted Population Population Population new parole guidelines that increase parole 2005 30,626 2,909 33,535 grant rates for low-risk prisoners. The July 2006 31,837 3,062 34,899 Georgia parole board also relaxed its self- 2006 32,415 3,228 35,965 2007 34,814 3,375 38,189 imposed rule that required certain offenders 2008 36,958 3,687 40,645 to serve 90 percent of sentence, allowing 2009 39,672 3,942 43,614 some inmates in that group to be considered 2010 42,182 4,210 46,392 for earlier release. Maryland also enacted 2011 43,933 4,388 48,381 2012 45,834 4,557 50,391 new parole hearing procedures to ensure that 2013 47,243 4,812 52,055 prisoners who are being granted parole are 2014 48,650 4,980 53,630 actually released when they become eligible. 2015 49,841 5,054 54,895 In addition, the Maryland parole board 2016 51,008 5,216 56,224 Numeric Change 2006 – 2016 19,171 2,154 21,325 adopted narrower length-of-stay ranges to Percent Change 2006 – 2016 60.2% 70.3% 61.1% reduce how long some offenders are Note: Numbers represent end of calendar year figures (with the exception of the July 2006 incarcerated before being paroled. figure, which represents the July 31, 2006, population). Year 2005 and July 2006 rows show actual population figures. 16 Public Safety, Public Spending
  • 27.
    Western Region probation for repeat Arizona’s prison population Virtually all of the Western states, with the offenders, with a few specified exceptions. This is projected to increase by exception of California and Oregon, will increase their prison populations by 20 collection of varied trends more than 60 percent over percent or more. While Montana will have and developments could the next decade. the greatest percentage increase, Arizona, make Arizona a leader in California and Colorado will see the greatest prison growth. As shown in Table 4, the 10- growth in absolute numbers in the West. year forecast shows the state’s prison population increasing to 56,224. This region’s estimated growth is in part the result of demographics. For example, while California also is a determinate state with no the U.S. population is expected to grow by discretionary parole. However, it actually approximately 4.5 percent in the next five lowered its fall 2006 population projection years, the Western region will increase by 6.4 from its spring 2006 estimate because of percent. Arizona and Nevada’s populations lower-than-expected growth in new court are expected to increase by a dramatic 13 commitments. The long-term estimate is for percent and 14 percent, respectively. continued growth, because of both population increases in the at-risk age cohort and the Nevada, which has a mostly discretionary cumulative effects of the state’s two- and release system, has significantly increased its three-strikes legislation. The state also returns 10-year forecast, as the state experienced an extremely high number of released inmates larger-than-expected admissions from the Las to prison, especially for violations of their Vegas metropolitan area. Despite efforts to terms of supervision. These ominous trends counteract this surge through a higher parole have led Governor Arnold Schwarzenegger to grant rate, Nevada is now poised to house propose reducing or eliminating formal parole one of the fastest-growing prisoner supervision for low-risk offenders and populations in the nation. Its prison establishing a sentencing commission. population is projected to increase from about 13,200 in 2006 to over 21,000 by 2016 (see Table 3). As in other states, the female population is expected to increase at a faster rate than the male population. Arizona is a determinate sentencing state with an 85-percent truth-in-sentencing law for all prisoners, giving it little short-term flexibility to moderate inmates’ length of sentence and temper its growth. The recently passed Proposition 301 negates the mandatory probation provision in the criminal code for first- and second-offense drug possession for methamphetamine offenses. Further, the Maricopa County Attorney’s Office recently announced a new policy to disallow pleas to Public Safety Performance Project 17
  • 28.
    Estimating Current and Future Prison Costs n addition to forecasting the I buildings, renovation of existing structures national prison population over the next and equipment. Unlike operating costs, five years, this report estimates the capital expenditures can fluctuate additional fiscal costs of the expanding state dramatically from year to year depending on and federal prison systems. Based on decisions to build or not build new facilities. calculations described in detail below, For example, it may require at least five years researchers estimate that prison operating to open a new prison once a state has costs will increase by at least $2.5 billion per decided to build one. A significant amount of year to as much as $5 billion per year by time is needed to identify an appropriate site, 2011. The price of building new prison beds develop the necessary architectural plans, could reach $12.5 billion. In sum, the prepare the site for construction and secure estimated 192,000 new the necessary building permits from state and The U.S. may need an prisoners could cost as much local authorities. The actual construction can additional $27.5 billion over as $27.5 billion over the next often take two years with the normal delays five years. incident to any construction schedule. The the next five years to costs associated with a construction project accommodate projected prison The cost of a prison system can show up during the fiscal year in which expansion and operations. is traditionally separated the funds were authorized or be recorded as into two broad categories: costs are incurred. operational and capital. Operational costs reflect the day-to-day expenses of operating a Since 1984, the U.S. Department of Justice correctional facility, including the central has conducted periodic cost analyses for office and support services surrounding that each state and the District of Columbia; the facility. While the largest component of most recent study was published in 2004 and operational costs is personnel (salary and used 2001 figures.17 At that time, it was fringe benefits), this category also reflects reported that state correctional agencies items such as utilities, food, office and spent $29.5 billion on correctional facilities, medical supplies, communication services, with $28.4 billion spent on operating transportation, program services and a expenses and $1.1 billion on capital costs. variety of contracted support services such as (Approximately two-thirds of the operating electrical, building maintenance and costs were linked to salaries and fringe information technology. benefits.) With 1,252,743 prisoners in custody in 2001, the average (mean) annual Capital costs are generally limited to one-time cost per prisoner was $22,650. purchases of land, construction of new 18 Public Safety, Public Spending
  • 29.
    Looking back, acomparison suggests that the 1. Regional and State Variation in Costs. As noted costs per prisoner stabilized between 1996 above, there is considerable variation across and 2001. The 1996 cost analysis found that the regions and even among the states within the average cost per inmate had steadily a region. If one region or only certain states increased from $16,300 in 1984 to $18,400 in from certain regions are experiencing the bulk 1990 and $20,100 in 1996, using constant of the increases, the cost estimates must 1996 dollars. In its more recent report, BJS account for these regional and state variations. noted that when adjusted for inflation, the 1996 cost per prisoner in 2001 dollars was 2. Marginal Versus “Fully Loaded” Operational $22,515, which was only slightly below the Costs. An increase or decrease in a state prison actual 2001 figure of $22,650. population will not yield a direct, proportionate increase or decrease in Just as incarceration rates themselves vary operating costs.18 This is because some states widely by state, the 2001 BJS report found whose prison populations may grow by only considerable variation among state operating a small amount likely will absorb that growth costs. The most expensive prison systems in existing facilities and with current staff. tended to be in the Northeast region ($33,037 They would experience only marginal cost per prisoner per year) and the least expensive increases for medical care and daily costs were in the Southern region ($16,479). The such as water, food, electricity and gas. Prison beds each least expensive states were Alabama ($8,128), cost between Mississippi ($12,795), Missouri ($12,867), 3. Tipping Point Effects. Related to the marginal Louisiana ($12,951) and Texas ($13,808)—the cost issue is the possibility that a very small $25,000 and same states that tended to have the highest increase in a state’s prison population could $100,000 to incarceration rates. The most expensive states trigger a major increase in costs per prisoner. build, depending were Maine ($44,379), Rhode Island This could result if in the past an agency has ($38,503), Massachusetts ($37,718), been using controlled crowding measures to on inmate Minnesota ($36,836), New York ($36,835), control costs. However, at some “tipping” point security level. Alaska ($36,730), and Oregon ($36,060). a modest increase in the prison population may result in a decision to construct and staff one While wages and benefits account for much or more new prisons. This in turn would of the variation among the states, the other significantly increase the cost-per-inmate figure. key factor is the inmate-to-staff ratio. The BJS report showed that Maine had the lowest 4. Differences in Cost-containment Approaches inmate per staff ratio (1.7 inmates per Adopted by the States. States use very different employee), while Alabama had the highest approaches to reduce or control their costs (6.8). Lower numbers of correctional officers for a growing prison system. Some contract per inmates can reduce costs but also raise with private prisons or local jails, while risks to the safety of staff and inmates. others simply start reducing programs and converting program space to housing units. Methodological Issues Because each state will approach its growth A number of methodological challenges make situation differently, it would be useful to estimating future prison costs problematic. identify those approaches and make the Several approaches are available, but each appropriate adjustments. must be sensitive to the following issues. Public Safety Performance Project 19
  • 30.
    5. Average Costs.Related to the points above, an private prison company, researchers made estimate that uses an average cost per inmate every attempt to ensure those costs were may well overestimate true future costs if the incorporated in the annual cost figure. state applies alternative housing methods or changes sentencing or release laws and Each state’s cost-per-inmate rate was compared practices, or if the projected population will with the BJS 2001 figure. If there was a include a disproportionate number of lower- significant difference, researchers contacted the cost inmates. There are significant differences state to discuss the matter and then made a in the cost of housing minimum-, medium- determination of the most accurate cost-per- and maximum-custody prisoners, males and year figure. If a state did not reply to the females, healthy and sick, young and old, etc. request, researchers used the 2001 figures and Unless these differences are accounted for, the then adjusted them for inflation, using the estimated costs may be inaccurate. estimates provided by the federal Bureau of Labor Statistics.19 Nonetheless, there were Any estimate of future costs should take into some major differences between the 2001 and account, or at least acknowledge, that the FY 2005-06 numbers that have not yet been future average cost per inmate may vary accounted for. based on these and other factors, and therefore is difficult to estimate. Using this approach, the current average annual operational cost per prisoner for the Under ideal circumstances, another states was $23,876. For the federal Bureau of comprehensive survey would be completed to Prisons (BOP) the cost was $23,429. Table 5 duplicate the detailed state-by-state census the summarizes the trends in costs per state BJS conducted in 2001. Unfortunately, a prisoner from 1984 to FY2005-06 based on study of this nature was beyond the resources the BJS data and this report’s survey of the of this research effort. Also, the purpose of 50 states, controlling for inflation. Whether this report was solely to estimate the possible one uses 1996 or 2005 inflation-adjusted cost to the state and federal government for figures, the pattern is the same: a steady corrections in 2011. It’s simply not feasible to increase from 1984 to 1996 followed by claim that such costs certainly will occur, relative stability through 2001 and then a because states could adopt a variety of yet- decline in FY 2005-06. unknown cost-saving strategies. However, because it is clear that costs will increase by The decline in FY2005-06 operating costs some amount as a result of the large projected could be the result of several factors. First, for growth in the prison population, it is useful to each of the other years, cost data were estimate what those costs could be. obtained from BJS, and BJS data may be different from the information researchers Current Operational Costs received from the states for this report. But if Researchers for this report contacted each the decline is real, then it may be attributed to state to obtain its most current cost per other factors. For example, the largest inmate. These cost rates included increases in the nation’s prison population administrative support, program services have occurred in the West and South, where (public and contracted), and facility costs per prisoner tend to be lower, driving maintenance. Where a state contracts with a down the overall average costs. There have 20 Public Safety, Public Spending
  • 31.
    been efforts tomake corrections more TABLE 5 efficient through Costs Per State Prisoner, 1984–2005 procurement reforms Cost per 1984 1990 1996 2001 FY2005– and privatization of a inmate 2006 variety of services. 1996 Dollars $16,300 $18,400 $20,100 $20,065 $19,181 And there is the 2005 Dollars $20,289 $22,903 $25,019 $23,941 $23,876 possibility that crowding more prisoners in existing facilities has reduced the Estimates of Future average cost per prisoner. Operational Costs Researchers made two estimates of future Table A-7 in the appendix shows the 2001 and operational costs. Under the first, researchers FY 2005-06 costs per state, both with and multiplied the current (FY2005-06) costs per without adjustments for inflation. As with the prisoner obtained from each state and the BOP previous BJS reports, the 2005 data show by the projected 2011 prisoner populations. Federal and state major differences among the states and the Through this method, they took into account governments are regions. The Northeast continues to have the the significant variation in costs per prisoner by projected to need highest costs per prisoner, led by Rhode Island state. However, this estimate does not control ($44,860), Massachusetts ($43,026) and New for marginal costs, tipping effects or innovative as much as York ($42,202). The lowest rates are largely in methods for controlling costs in the face of $15 billion the South, led by Louisiana ($13,009), population increases. This is the typical in additional Alabama ($13,019), South Carolina ($13,170) method used by the states in making fiscal and Mississippi ($13,428). impact statements on pending legislation or operational funds administrative reforms. There typically is no over the next The table also shows that some states have effort to account for marginal costs or to assess five years. significantly increased or lowered their costs what the actual cost increases have been in the per prisoner, even when adjusted for inflation. past for each inmate increase in the prison States that have lowered their costs include population. One should assume that, as a Oregon, Maine, Minnesota, Michigan, Ohio, result, such estimates by the states are too high. South Carolina and Hawaii. States where the rates have increased significantly are Using this approach, the state and federal California, Alabama, Rhode Island, New York, operational budgets, which totaled just under Alaska and Massachusetts. $35 billion in 2005, would increase by an estimated $5 billion a year to almost $40 In some of the states—New York, billion annually by 2011 in constant dollars. Massachusetts, Maryland and Rhode Island— In cumulative terms, this 14-percent increase the cost-per-inmate rate has increased but means the states and federal government there has been an associated decline or would spend a cumulative $15 billion in leveling off in the prison population. So their operating costs over just the next five years prison populations have dropped or stabilized to accommodate the projected growth. but the “fixed costs” of operating their prison systems continue to increase. Under the second (and more conservative) method for estimating future operating costs, Public Safety Performance Project 21
  • 32.
    researchers calculated theactual cost changes need for additional bed capacity. There also between 2001 and FY2005-06 in relation to are many ways by which states fund prison the change in the prisoner population. This construction costs that may not fully surface method assumes no mechanical incremental during the projection period. For example, if increase in the operational budgets for each prison construction is being funded through a additional prisoner added to the daily 30-year bond, the “true” cost of the new beds population. The BJS report and the state will be far above the actual construction costs survey conducted for this report show that because of debt service on the bond. while the prisoner population increased from 1,345,217 in 2001 to 1,480,223 by the end of Nonetheless, it is important to make some 2005, the total operating budgets for the states estimate of the number of new beds each only increased from $28,374,273 in 2001 to an state and the BOP would need to construct estimated $30,802,574 in FY2005-06. based on their projections and the construction costs associated with this bed Assuming the BJS 2001 and the state-reported demand. In general, the states reported FY2005-06 cost comparisons are valid for construction costs that ranged from $25,000 most states, the marginal annual cost for for a minimum-security bed to more than housing each additional prisoner was $13,797 $100,000 for a maximum-security cell. (not adjusted for inflation).20 This is 57 Because there are no “average” estimates, percent below the $23,876 figure cited earlier. researchers believe the best approximation to If one applies the $13,797 rate to the projected use is a midpoint of $65,000 in capital costs 192,000 increase in prisoners, the projected per bed. This figure reflects what most would additional costs to state prison budgets by consider the costs of a “typical” medium- 2011 would be $2.5 billon annually in security bed, which covers the largest custody constant dollars, rather than the $5 billion level of most prison systems. cited earlier. That would accumulate to an additional $7.5 billion in prison operations Applying the $65,000 estimate of spending over the next five years. construction costs to the projected need for 192,000 additional prison beds, the total Capital Costs construction costs would be approximately Estimating how much money the states and $12.5 billion in 2006 dollars. This estimate the federal government are likely to spend on may be conservative, as it excludes prison construction over the next five years is renovation or conversion of existing prison a tenuous undertaking. As described above, bed space and assumes no financing costs. some of the projected inmate growth may be For example, California’s Governor averted by changes in sentencing or release Schwarzenegger recently requested a total of policies. Even if growth is not averted, states $10.9 billion in mostly bond financing to may choose to accommodate new inmates in construct a combination of 78,000 jail, prison, existing facilities by double- or triple-celling and juvenile correctional beds—an average of inmates, converting program space into approximately $135,000 per bed. Similarly, dormitories or other means. On the other Colorado has announced that it will need to hand, in some states construction costs may build a number of 1,000-bed prisons at a cost be related to the need to replace aging and of $87,000 per bed. dysfunctional facilities, not any projected 22 Public Safety, Public Spending
  • 33.
    The Relationship Between Incarceration andCrime Rates iven the projected increase G To demonstrate that incarceration causes in the prison population and crime to go up or down, one must show (1) associated costs, it is useful to that there was an increase or decrease in review the potential impact of further incarceration before the crime rate changed incarceration on public safety. There has been (temporal assumption); (2) that a statistical much political and academic debate on the relationship existed between crime and relationship between the use of incarceration imprisonment rates after the change in and crime rates.21 The common expectation is incarceration rate (empirical association); and that crime rates will decline as the number of (3) that there are no other factors that could people in prison increases, and that crime will explain the change in the crime rate (non- increase if incarceration rates fall. The logic of spurious assumption). For example, crime rates this argument is that the crime rate falls when may have declined as a result of a decline in we incapacitate people who are committing the number of welfare recipients, the aging of crimes and deter those who might otherwise the baby boomers, more effective community become involved in criminal activities absent policing, or many other factors. the threat of imprisonment. A different contention is that other social and economic Figure 9 shows that the increase in national factors, such as poverty rates and education crime rates beginning in 1964 was not levels, have a greater impact on crime than imprisonment rates. FIGURE 9 The general National Crime and Imprisonment Trends, 1931-2005 consensus among (Sentenced Inmates in State and Federal Institutions, (Sentenced Inmates in State and Federal Institutions, 600 7000 criminologists is that crime rates are the 500 6000 product of a complex per 100,000 residents) 5000 Incarceration Rate per 100,000 residents) 400 set of factors, Crime Rate 4000 including but not 300 Crime Rate limited to 3000 200 imprisonment. Incarceration Rate 2000 100 1000 0 0 1931 1933 1935 1937 1939 1941 1943 1945 1947 1949 1951 1953 1955 1957 1959 1961 1963 1965 1967 1969 1971 1973 1975 1977 1979 1981 1983 1985 1987 1989 1991 1993 1995 1997 1999 2001 2003 2005 Source: FBI Uniform Crime Reports, BJS Public Safety Performance Project 23
  • 34.
    predated by adrop in the incarceration rate. A recent review conducted by the Vera Whatever caused the crime rate to increase Institute of Justice of all the major studies of from 1965 to 1974, therefore, was not a the relationship between incarceration and change in imprisonment, which remained crime shows disparate findings, with different stable until 1975 and then started increasing estimates of whether the relationship exists, after crime rates had stabilized.22 Some what the relationship may be, and even experts posit that while the increase in crime whether incarceration rates at some point rates that began in 1965 may have been may actually increase crime.25 The Vera caused by other socio-economic and review found that “the most sophisticated demographic factors, the significant increase analyses generally agree that increased in the use of imprisonment has helped lower incarceration rates have some effect on crime rates. Meanwhile, after 1975, policy reducing crime,” accounting for perhaps 25 makers passed many laws that increased the percent of the drop in crime during the probability of being sentenced to prison 1990s. But “analysts are nearly unanimous in rather than to jail or probation, and their conclusion that continued growth in dramatically increased the length of those incarceration will prevent considerably fewer, prison sentences. if any, crimes than past increases did and will cost taxpayers substantially more to A decade ago, James Q. Wilson suggested achieve.”26 that the U.S. had reached a tipping point of “diminishing returns” from our investment in prisons.23 According to Wilson, judges have always been tough on violent offenders and have incarcerated them for relatively long sentences. However, as states expanded incarceration, they dipped “deeper into the bucket of persons eligible for prison, dredging up offenders with shorter and shorter criminal records.”24 Increasing the proportion of convicted criminals sent to prison, like lengthening time served beyond some point, has produced diminishing marginal returns in crime reductions. This does not mean an absence of returns—just that the benefit to public safety of each additional prisoner consistently decreases. 24 Public Safety, Public Spending
  • 35.
    Public Safety, Public Spending: TheChallenge Ahead for State Policy Makers t’s hard to place a value on the I system to produce the best possible outcomes peace of mind and sense of justice that a at the best price. This means less crime and victim, his or her loved ones, and society fewer victims, lower recidivism rates, and as a whole, receive when an assailant is locked more resources for investments like education, away behind bars. This powerful and rightful health and economic development. response, perhaps more than any other factor, drives states to build more and more prisons. Driven by hard data, the projections in this report clearly outline for state policy makers But Americans expect the corrections system the increases in their prison populations, and to do more than just punish.27 They expect it worsening cost crises some are facing. States to protect public safety and reduce crime—by will ignore these facts at their own peril. If deterring would-be criminals, by separating nothing changes, taxpayers will spend as much the most dangerous people from society, and as $27.5 billion more on prisons over the next by helping lower-risk offenders and inmates five years, and the jury is still out as to returning to society become productive, crime- whether that investment will yield free citizens. commensurate results in crime control. States pay a high price for these services. This report does raise red flags, but it also can Prisons are the fourth-largest state budget item be used to help diagnose problems rooted behind health, education and transportation. within state corrections systems. Throughout And the effect of corrections spending on the report, and in accompanying state profiles, other state priorities is particularly strong as Pew’s Public Safety Performance Project almost all of it comes from the states’ own showcases states that are examining the coffers, with minimal reliance on federal aid. performance of their sentencing and By contrast, the majority of health care corrections systems and using that data to funding in many states comes from the federal determine the steps necessary to improve their government, primarily through Medicaid. outcomes. The high cost and high stakes of corrections The profiles highlight states that have rightly puts a premium on performance. broadened their approaches to criminal justice, Taxpayers, victims of crime, prosecutors, making prisons one item on a larger menu of police, judges–everyone wants the corrections options for dealing with the wide spectrum of Public Safety Performance Project 25
  • 36.
    criminal behavior. Theyhave employed new, cost effective strategies for managing their prison populations, such as establishing sentencing guidelines, improving parole release practices, and holding probation and parole violators accountable with graduated sanctions. They have developed new programs proven effective at reducing recidivism, such as drug courts, day reporting centers and comprehensive re-entry programs. And states have deployed new technologies, such as instant-result drug tests and risk assessments that help judges and corrections professionals match offenders with the right levels and types of supervision and services. The increases in prison populations and costs predicted in this report are worrisome, but they are not inevitable. These projections and the Public Safety Performance Project’s profiles on innovative states should serve as tools for policy makers and others, who can use the data and lessons learned across the country to boost the performance of the corrections systems in their own states. 26 Public Safety, Public Spending
  • 37.
    Appendix TABLE A-1 KeyState Data State/Region Prison Population Incarceration Projection 2005 Rate 2005 Methodology U.S. total* 1,480,223 500 – Federala* 187,394 56 Simulation State* 1,292,829 435 – Northeast* 164,074 298 – Connecticutb 13,121 373 None Maine 1,905 144 Simulation Massachusettsc* 10,385 239 Simulation New Hampshire 2,520 192 Time Series New Jerseyd* 26,746 313 Flow New York 62,743 326 None * State population differs from Pennsylvania 42,345 340 Simulation BJS report to mirror projections Rhode Islande* 2,767 189 Simulation populations Vermontb 1,542 247 None a Federal prison population provided by the Bureau of Midwest* 252,438 383 – Prisons. Illinoisf 44,919 351 Simulation b Prisons and jails form one Indiana 24,416 388 Simulation integrated system. Figures here include sentenced prisoners Iowag* 8,737 294 Simulation only. Kansasf 9,068 330 Simulation c Prison population on December Michigan 49,546 489 Simulation 27, 2005 from 'Quarterly Report on the Status of Prison Minnesotak* 8,874 180 Simulation Overcrowding, Fourth Quarter Missourif 30,803 529 Time Series 2005', Massachusetts Nebraska 4,330 245 Simulation Department of Correction, January 2006 North Dakota 1,327 208 Simulation (http://www.mass.gov/Eeops/d Ohiof 45,854 400 Simulation ocs/doc/research_reports/4th_0 South Dakota 3,454 443 Simulation 5_overcrowding.pdf). d New Jersey 2005 prison total Wisconsin 21,110 380 None taken from New Jersey South* 580,860 539 – Department of Corrections Alabama 27,003 591 – Offender Characteristics Report, Policy Analysis & Arkansas 13,383 479 Simulation Planning and represent Delawareb 3,972 467 Simulation population on January 9, 2006 Floridaj* 86,563 499 Simulation (http://www.nj.gov/corrections/ offender_statistics/2006/Whole Georgiah* 51,904 572 Simulation Doc_Off_Char2006.PDF). Kentucky 19,215 459 Simulation e Prison population provided by Louisiana 36,083 797 Simulation Rhode Island Department of Corrections. Maryland 22,143 394 Simulation f Includes some inmates Mississippi 19,335 660 Simulation sentenced to 1 year or less. North Carolinai* 36,620 360 Simulation g Iowa prison population extrapolated using fiscal year Oklahomaf 23,245 652 Simulation end counts. South Carolina 22,464 525 Simulation h Prison population provided by Tennesseef 26,369 440 Simulation Georgia Department of Corrections. Texasm* 151,925 691 Simulation i North Carolina prison Virginia 35,344 464 Simulation population data obtained from West Virginia 5,292 291 Simulation NCDOC web page database. j Prison population from 'Trends West* 295,457 431 – in Florida Prison Admissions Alaskab 2,781 414 None and Populations December Arizona 31,411 521 Time Series 2005', Florida Department of Corrections California 168,982 466 Simulation (www.dc.state.fl.us/pub/pop/20 Coloradof 21,456 457 Time Series 05/pop.pdf) Hawaiib 4,422 340 Simulation k Prison population on January 1, 2006 from 'An Outcome Idaho 6,818 472 None Evaluation of the Challenge Montanan* 2,625 373 None Incarceration Program', Nevada 11,644 474 Simulation Minnesota Department of Corrections, October 2006 New Mexico 6,292 323 Simulation (http://www.corr.state.mn.us/p Oregon 13,390 365 Simulation ublications/documents/CIPEval Utah 6,269 252 None uationReport10-06.pdf) m Prison population from Texas Washington 17,320 273 Simulation Department of Criminal Justice. Wyoming 2,047 400 None n Institutional prisoners only. Source: Bureau of Justice Statistics, JFA Institute Public Safety Performance Project 27
  • 38.
    TABLE A-2 Actual& Projected Resident Population State/Region Estimated Projected Projected Projected Projected Projected Projected End of End of End of End of End of End of End of % Change FY 2005 Year 2006 Year 2007 Year 2008 Year 2009 Year 2010 Year 2011 2006-2011 U.S. total 296,410,404 299,565,081 302,255,297 304,935,021 307,603,988 310,268,231 312,940,989 4.5% Northeast 54,641,895 55,125,296 55,326,451 55,517,038 55,697,475 55,869,287 56,034,887 1.7% Connecticut 3,510,297 3,527,755 3,542,998 3,557,405 3,570,942 3,583,757 3,596,091 1.9% Maine 1,321,505 1,330,601 1,338,420 1,346,036 1,353,460 1,360,672 1,367,596 2.8% Massachusetts 6,398,743 6,561,571 6,588,248 6,613,573 6,637,676 6,660,827 6,683,355 1.9% New Hampshire 1,309,940 1,336,023 1,350,148 1,364,301 1,378,473 1,392,698 1,406,971 5.3% New Jersey 8,717,925 8,832,766 8,888,287 8,941,682 8,993,050 9,042,819 9,091,630 2.9% New York 19,254,630 19,325,562 19,364,721 19,399,297 19,429,579 19,456,238 19,480,389 0.8% Pennsylvania 12,429,616 12,477,239 12,509,376 12,540,294 12,569,978 12,598,434 12,625,803 1.2% Rhode Island 1,076,189 1,096,344 1,102,511 1,108,389 1,113,952 1,119,205 1,124,186 2.5% Vermont 623,050 637,437 641,745 646,063 650,367 654,640 658,868 3.4% Midwest 65,971,974 66,440,637 66,721,923 66,995,549 67,260,924 67,517,883 67,767,236 2.0% Illinois 12,763,371 12,769,657 12,814,117 12,856,636 12,897,157 12,935,988 12,973,810 1.6% Indiana 6,271,973 6,294,276 6,323,155 6,351,281 6,378,648 6,405,269 6,431,257 2.2% Iowa 2,966,334 2,986,331 2,993,970 3,000,886 3,007,035 3,012,367 3,016,907 1.0% Kansas 2,744,687 2,768,324 2,779,287 2,789,995 2,800,366 2,810,442 2,820,284 1.9% Michigan 10,120,860 10,277,845 10,322,902 10,366,379 10,408,204 10,448,077 10,485,819 2.0% Minnesota 5,132,799 5,247,934 5,296,992 5,346,312 5,395,836 5,445,509 5,495,282 4.7% Missouri 5,800,310 5,813,035 5,844,610 5,875,874 5,906,750 5,937,243 5,967,445 2.7% Nebraska 1,758,787 1,752,320 1,757,362 1,762,181 1,766,765 1,771,126 1,775,300 1.3% North Dakota 636,677 636,036 636,323 636,532 636,618 636,578 636,442 0.1% Ohio 11,464,042 11,510,978 11,531,425 11,550,391 11,567,842 11,583,777 11,598,234 0.8% South Dakota 775,933 776,480 779,477 782,351 785,077 787,646 790,056 1.7% Wisconsin 5,536,201 5,607,424 5,642,306 5,676,735 5,710,628 5,743,865 5,776,403 3.0% South 106,954,892 108,364,091 109,700,000 111,039,357 112,381,872 113,729,952 115,088,601 6.2% Alabama 4,557,808 4,548,208 4,562,068 4,575,841 4,589,514 4,603,075 4,616,554 1.5% Arkansas 2,779,154 2,807,016 2,826,758 2,846,270 2,865,500 2,884,503 2,903,384 3.4% Delaware 843,524 851,327 860,938 870,411 879,730 888,882 897,843 5.5% Florida 17,789,864 18,015,259 18,359,934 18,711,584 19,070,439 19,437,214 19,813,082 10.0% Georgia 9,072,576 9,126,400 9,259,442 9,391,842 9,523,469 9,654,210 9,784,054 7.2% Kentucky 4,173,405 4,195,783 4,216,491 4,236,461 4,255,690 4,274,242 4,292,249 2.3% Louisiana 4,523,628 4,559,786 4,575,884 4,591,185 4,605,658 4,619,402 4,632,560 1.6% Maryland 5,600,388 5,692,070 5,752,927 5,813,760 5,874,573 5,935,371 5,996,219 5.3% Mississippi 2,921,088 2,933,689 2,945,086 2,955,983 2,966,363 2,976,225 2,985,630 1.8% North Carolina 8,683,242 8,893,893 9,022,205 9,151,193 9,280,841 9,411,179 9,542,453 7.3% Oklahoma 3,547,884 3,542,715 3,556,830 3,570,816 3,584,641 3,598,415 3,612,293 2.0% South Carolina 4,255,083 4,302,577 4,344,306 4,385,599 4,426,424 4,466,747 4,506,628 4.7% Tennessee 5,962,959 6,044,730 6,097,782 6,150,954 6,204,210 6,257,637 6,311,407 4.4% Texas 22,859,968 23,336,489 23,711,224 24,086,241 24,461,352 24,837,867 25,218,315 8.1% Virginia 7,567,465 7,690,340 7,781,912 7,873,339 7,964,633 8,055,867 8,147,172 5.9% West Virginia 1,816,856 1,823,813 1,826,218 1,827,882 1,828,840 1,829,120 1,828,762 0.3% West 68,291,122 69,090,218 69,966,312 70,846,733 71,731,725 72,623,572 73,527,265 6.4% Alaska 663,661 670,332 676,799 683,524 690,537 697,745 705,148 5.2% Arizona 5,939,292 6,091,570 6,243,949 6,399,280 6,557,534 6,719,039 6,884,382 13.0% California 36,132,147 36,653,225 37,059,690 37,464,007 37,866,419 38,268,509 38,673,873 5.5% Colorado 4,665,177 4,682,434 4,725,181 4,767,794 4,810,307 4,852,893 4,895,793 4.6% Hawaii 1,275,194 1,297,844 1,311,156 1,323,543 1,335,077 1,346,002 1,356,313 4.5% Idaho 1,429,096 1,439,585 1,461,544 1,483,723 1,506,077 1,528,573 1,551,126 7.7% Montana 935,670 943,862 951,064 958,172 965,145 971,931 978,498 3.7% Nevada 2,414,807 2,450,937 2,518,059 2,586,289 2,655,610 2,726,022 2,797,632 14.1% New Mexico 1,928,384 1,927,339 1,943,387 1,958,693 1,973,191 1,986,937 2,000,105 3.8% Oregon 3,641,056 3,651,845 3,690,289 3,729,815 3,770,424 3,812,060 3,854,789 5.6% Utah 2,469,585 2,470,439 2,505,704 2,541,227 2,577,036 2,613,198 2,649,851 7.3% Washington 6,287,759 6,299,318 6,365,366 6,434,081 6,505,545 6,579,809 6,657,015 5.7% Wyoming 509,294 511,492 514,128 516,588 518,827 520,859 522,743 2.2% Source: U.S. Census Bureau mid-year projections, www.census.gov. Notes: US totals include Distrcit of Columbia population counts not included within a state End of year number estimated by calculating the mid-point population for mid-year estimates/projections. 28 Public Safety, Public Spending
  • 39.
    TABLE A-3 StatePrison Populations by Region, 2006-2011 State/Region Estimated Projected Projected Projected Projected Projected % Change End of End of End of End of End of End of 2006-2011 Year 2006 Year 2007 Year 2008 Year 2009 Year 2010 Year 2011 U.S. total 1,530,454 1,568,822 1,614,808 1,654,668 1,686,495 1,722,477 13% Federal1 192,584 200,696 206,982 212,283 217,385 221,882 15% State 1,337,870 1,368,126 1,407,826 1,442,385 1,469,110 1,500,595 12% Northeast 168,176 170,838 173,076 175,349 177,585 180,154 7% Connecticut 14,000 14,000 14,000 14,000 14,000 14,000 0% Maine4 1,978 2,053 2,131 2,212 2,296 2,383 21% Massachusetts6 10,670 10,780 10,910 11,040 11,180 11,310 6% New Hampshire 2,620 2,699 2,780 2,863 2,949 3,037 16% New Jersey 27,309 28,051 28,369 28,704 29,100 29,586 8% New York 63,000 63,000 63,000 63,000 63,000 63,000 0% Pennsylvania 44,096 45,596 47,096 48,596 50,096 51,596 17% Rhode Island 2,853 2,901 2,924 2,960 2,882 3,052 7% Vermont 1,650 1,758 1,866 1,974 2,082 2,190 33% Midwest 256,613 261,076 267,174 274,877 281,289 287,622 12% Illinois3 45,687 46,273 46,967 47,708 48,539 49,497 8% Indiana 25,061 25,249 26,179 27,058 28,154 28,728 15% Iowa3 8,857 9,282 9,659 9,898 10,071 10,284 16% Kansas 8,924 9,185 9,383 9,505 9,821 10,074 13% Michigan2 49,974 50,743 51,857 53,044 54,441 55,687 11% Minnesota 8,899 9,115 9,385 9,609 9,701 10,063 13% Missouri 30,135 29,824 29,512 31,216 31,577 31,937 6% Nebraska 4,706 4,953 5,052 5,182 5,243 5,273 12% North Dakota 1,384 1,420 1,458 1,499 1,535 1,580 14% Ohio3 47,519 49,211 51,548 53,603 55,305 57,223 20% South Dakota 3,442 3,594 3,745 3,904 4,069 4,241 23% Wisconsin4 22,025 22,227 22,429 22,651 22,833 23,035 5% South 603,876 615,562 635,968 649,085 656,408 669,072 11% Alabama 28,430 28,789 28,966 29,298 29,739 30,461 7% Arkansas 13,737 14,264 14,790 15,246 15,703 16,057 17% Delaware 3,972 3,972 3,972 3,972 3,972 3,972 0% Florida 89,815 92,569 96,568 100,482 103,158 106,042 18% Georgia 53,685 55,051 56,310 57,463 58,509 59,449 11% Kentucky 21,459 21,650 23,690 24,525 25,455 26,209 22% Louisiana 38,094 38,488 38,738 38,951 39,241 39,491 4% Maryland3 23,156 23,220 23,270 23,320 23,370 23,420 1% Mississippi 22,812 23,288 23,746 24,005 24,367 24,673 8% North Carolina3 38,257 38,865 39,394 40,059 40,860 41,676 9% Oklahoma3 25,089 26,175 31,992 32,633 28,058 28,345 13% South Carolina 24,070 24,819 25,568 26,317 27,066 27,815 16% Tennessee 26,186 26,590 26,965 27,273 27,388 27,582 5% Texas 152,671 154,766 158,090 160,555 163,331 166,327 9% Virginia 37,198 37,686 38,330 39,304 40,383 41,476 12% West Virginia 5,246 5,370 5,579 5,682 5,808 6,077 16% West 309,205 320,651 331,608 343,075 353,829 363,748 18% Alaska4 2,951 3,130 3,321 3,523 3,737 3,964 34% Arizona 35,965 38,189 40,645 43,614 46,392 48,381 35% California 173,100 177,573 180,979 183,955 186,565 188,772 9% Colorado2 22,624 23,927 25,357 26,894 28,261 29,685 31% Hawaii 4,105 4,281 4,457 4,633 4,809 4,985 21% Idaho5 7,206 7,669 8,141 8,625 9,125 9,654 34% Montana5 2,812 3,017 3,233 3,464 3,712 3,977 41% Nevada 13,239 13,732 14,289 15,129 15,862 16,764 27% New Mexico 7,006 7,431 7,795 8,044 8,244 8,477 21% Oregon2 13,411 13,600 13,924 14,294 14,719 15,110 13% Utah4 6,552 6,848 7,157 7,480 7,818 8,171 25% Washington2 18,088 19,000 19,945 20,937 21,978 23,071 28% Wyoming4 2,147 2,254 2,366 2,483 2,607 2,737 27% Source: JFA Institute 1 Source: Bureau of Prisons 2 State provided projections short of 2011. Similar growth rates were applied to complete. 3 State provided projections on a FY basis. December figures were extrapolated in these states. 4 Average annual change from 2001-2005 applied yearly to generate forecast. 5 Both FY adjusted and short of 2011. 6 Massachusetts represents both civil and criminal inmates. Public Safety Performance Project 29
  • 40.
    TABLE A-4 PrisonPopulations by Growth Rate, 2006-2011 State/Region Estimated Projected Projected Projected Projected Projected % Change End of End of End of End of End of End of 2006-2011 Year 2006 Year 2007 Year 2008 Year 2009 Year 2010 Year 2011 U.S. total 1,530,454 1,568,822 1,614,808 1,654,668 1,686,495 1,722,477 13% Federal1 192,584 200,696 206,982 212,283 217,385 221,882 15% State 1,337,870 1,368,126 1,407,826 1,442,385 1,469,110 1,500,595 12% Montana5 2,812 3,017 3,233 3,464 3,712 3,977 41% Arizona 35,965 38,189 40,645 43,614 46,392 48,381 35% Alaska4 2,951 3,130 3,321 3,523 3,737 3,964 34% Idaho5 7,206 7,669 8,141 8,625 9,125 9,654 34% Vermont 1,650 1,758 1,866 1,974 2,082 2,190 33% Colorado2 22,624 23,927 25,357 26,894 28,261 29,685 31% Washington2 18,088 19,000 19,945 20,937 21,978 23,071 28% Wyoming4 2,147 2,254 2,366 2,483 2,607 2,737 27% Nevada 13,239 13,732 14,289 15,129 15,862 16,764 27% Utah4 6,552 6,848 7,157 7,480 7,818 8,171 25% South Dakota 3,442 3,594 3,745 3,904 4,069 4,241 23% Kentucky 21,459 21,650 23,690 24,525 25,455 26,209 22% Hawaii 4,105 4,281 4,457 4,633 4,809 4,985 21% New Mexico 7,006 7,431 7,795 8,044 8,244 8,477 21% Maine4 1,978 2,053 2,131 2,212 2,296 2,383 21% Ohio3 47,519 49,211 51,548 53,603 55,305 57,223 20% Florida 89,815 92,569 96,568 100,482 103,158 106,042 18% Pennsylvania 44,096 45,596 47,096 48,596 50,096 51,596 17% Arkansas 13,737 14,264 14,790 15,246 15,703 16,057 17% Iowa3 8,857 9,282 9,659 9,898 10,071 10,284 16% New Hampshire 2,620 2,699 2,780 2,863 2,949 3,037 16% West Virginia 5,246 5,370 5,579 5,682 5,808 6,077 16% South Carolina 24,070 24,819 25,568 26,317 27,066 27,815 16% Indiana 25,061 25,249 26,179 27,058 28,154 28,728 15% North Dakota 1,384 1,420 1,458 1,499 1,535 1,580 14% Minnesota 8,899 9,115 9,385 9,609 9,701 10,063 13% Oklahoma3 25,089 26,175 31,992 32,633 28,058 28,345 13% Kansas 8,924 9,185 9,383 9,505 9,821 10,074 13% Oregon2 13,411 13,600 13,924 14,294 14,719 15,110 13% Nebraska 4,706 4,953 5,052 5,182 5,243 5,273 12% Virginia 37,198 37,686 38,330 39,304 40,383 41,476 12% Michigan2 49,974 50,743 51,857 53,044 54,441 55,687 11% Georgia 53,685 55,051 56,310 57,463 58,509 59,449 11% California 173,100 177,573 180,979 183,955 186,565 188,772 9% Texas 152,671 154,766 158,090 160,555 163,331 166,327 9% North Carolina3 38,257 38,865 39,394 40,059 40,860 41,676 9% Illinois3 45,687 46,273 46,967 47,708 48,539 49,497 8% New Jersey 27,309 28,051 28,369 28,704 29,100 29,586 8% Mississippi 22,812 23,288 23,746 24,005 24,367 24,673 8% Alabama 28,430 28,789 28,966 29,298 29,739 30,461 7% Rhode Island 2,853 2,901 2,924 2,960 2,882 3,052 7% Massachusetts6 10,670 10,780 10,910 11,040 11,180 11,310 6% Missouri 30,135 29,824 29,512 31,216 31,577 31,937 6% Tennessee 26,186 26,590 26,965 27,273 27,388 27,582 5% Wisconsin4 22,025 22,227 22,429 22,651 22,833 23,035 5% Louisiana 38,094 38,488 38,738 38,951 39,241 39,491 4% Maryland3 23,156 23,220 23,270 23,320 23,370 23,420 1% Connecticut 14,000 14,000 14,000 14,000 14,000 14,000 0% New York 63,000 63,000 63,000 63,000 63,000 63,000 0% Delaware 3,972 3,972 3,972 3,972 3,972 3,972 0% Source: JFA Institute 1 Source: U.S. Bureau of Prisons 2 State provided projections short of 2011. Similar growth rates were applied to complete. 3 State provided projections on a FY basis. December figures were extrapolated in these states. 4 Average annual change from 2001-2005 applied yearly to generate forecast 5 Both FY adjusted and short of 2011 6 Massachusetts represents both civil and criminal inmates. 30 Public Safety, Public Spending
  • 41.
    TABLE A-5 ProjectedIncarceration Rates (by Region) State/Region Projected Projected Projected Projected Projected Projected % Change End of End of End of End of End of End of 2006-2011 Year 2006 Year 2007 Year 2008 Year 2009 Year 2010 Year 2011 U.S. total 511 519 530 538 544 550 8% Federal 64 66 68 69 70 71 10% State 447 453 462 470 474 480 7% Northeast 305 309 312 315 318 322 5% Connecticut 397 395 394 392 391 389 -2% Maine 149 153 158 163 169 174 17% Massachusetts 163 164 165 166 168 169 4% New Hampshire 196 200 204 208 212 216 10% New Jersey 309 316 317 319 322 325 5% New York 326 325 325 324 324 323 -1% Pennsylvania 353 364 376 387 398 409 16% Rhode Island 260 263 264 266 258 271 4% Vermont 259 274 289 304 318 332 28% Midwest 386 391 399 409 417 424 10% Illinois 358 361 365 370 375 382 7% Indiana 398 399 412 424 440 447 12% Iowa 297 310 322 329 334 341 15% Kansas 322 330 336 339 349 357 11% Michigan 486 492 500 510 521 531 9% Minnesota 170 172 176 178 178 183 8% Missouri 518 510 502 528 532 535 3% Nebraska 269 282 287 293 296 297 11% North Dakota 218 223 229 235 241 248 14% Ohio 413 427 446 463 477 493 20% South Dakota 443 461 479 497 517 537 21% Wisconsin 393 394 395 397 398 399 2% South 557 561 573 578 577 581 4% Alabama 625 631 633 638 646 660 6% Arkansas 489 505 520 532 544 553 13% Delaware 467 461 456 452 447 442 -5% Florida 499 504 516 527 531 535 7% Georgia 588 595 600 603 606 608 3% Kentucky 511 513 559 576 596 611 19% Louisiana 835 841 844 846 849 852 2% Maryland 407 404 400 397 394 391 -4% Mississippi 778 791 803 809 819 826 6% North Carolina 430 431 430 432 434 437 2% Oklahoma 708 736 896 910 780 785 11% South Carolina 559 571 583 595 606 617 10% Tennessee 433 436 438 440 438 437 1% Texas 654 653 656 656 658 660 1% Virginia 484 484 487 493 501 509 5% West Virginia 288 294 305 311 318 332 16% West 448 458 468 478 487 495 11% Alaska 440 462 486 510 536 562 28% Arizona 590 612 635 665 690 703 19% California 472 479 483 486 488 488 3% Colorado 483 506 532 559 582 606 25% Hawaii 316 327 337 347 357 368 16% Idaho 501 525 549 573 597 622 24% Montana 298 317 337 359 382 406 36% Nevada 540 545 552 570 582 599 11% New Mexico 364 382 398 408 415 424 17% Oregon 367 369 373 379 386 392 7% Utah 265 273 282 290 299 308 16% Washington 287 298 310 322 334 347 21% Wyoming 420 438 458 479 501 524 25% Source: JFA Institute Notes: The forecasted incarceration rates are calculated using adjusted Census projections and state prison population forecasts. This table has been updated with revised population estimates. Public Safety Performance Project 31
  • 42.
    TABLE A-6 ProjectedIncarceration Rates (by Growth Rate) State/Region Projected Projected Projected Projected Projected Projected % Change End of End of End of End of End of End of 2006-2011 Year 2006 Year 2007 Year 2008 Year 2009 Year 2010 Year 2011 U.S. total 511 519 530 538 544 550 8% Federal 64 66 68 69 70 71 10% State 447 453 462 470 474 480 7% Montana 298 317 337 359 382 406 36% Vermont 259 274 289 304 318 332 28% Alaska 440 462 486 510 536 562 28% Colorado 483 506 532 559 582 606 25% Wyoming 420 438 458 479 501 524 25% Idaho 501 525 549 573 597 622 24% South Dakota 443 461 479 497 517 537 21% Washington 287 298 310 322 334 347 21% Ohio 413 427 446 463 477 493 20% Kentucky 511 513 559 576 596 611 19% Arizona 590 612 635 665 690 703 19% Maine 149 153 158 163 169 174 17% New Mexico 364 382 398 408 415 424 17% Utah 265 273 282 290 299 308 16% Hawaii 316 327 337 347 357 368 16% Pennsylvania 353 364 376 387 398 409 16% West Virginia 288 294 305 311 318 332 16% Iowa 297 310 322 329 334 341 15% North Dakota 218 223 229 235 241 248 14% Arkansas 489 505 520 532 544 553 13% Indiana 398 399 412 424 440 447 12% Nevada 540 545 552 570 582 599 11% Kansas 322 330 336 339 349 357 11% Oklahoma 708 736 896 910 780 785 11% Nebraska 269 282 287 293 296 297 11% South Carolina 559 571 583 595 606 617 10% New Hampshire 196 200 204 208 212 216 10% Michigan 486 492 500 510 521 531 9% Minnesota 170 172 176 178 178 183 8% Florida 499 504 516 527 531 535 7% Oregon 367 369 373 379 386 392 7% Illinois 358 361 365 370 375 382 7% Mississippi 778 791 803 809 819 826 6% Alabama 625 631 633 638 646 660 6% New Jersey 309 316 317 319 322 325 5% Virginia 484 484 487 493 501 509 5% Rhode Island 260 263 264 266 258 271 4% Massachusetts 163 164 165 166 168 169 4% California 472 479 483 486 488 488 3% Georgia 588 595 600 603 606 608 3% Missouri 518 510 502 528 532 535 3% Louisiana 835 841 844 846 849 852 2% North Carolina 430 431 430 432 434 437 2% Wisconsin 393 394 395 397 398 399 2% Tennessee 433 436 438 440 438 437 1% Texas 654 653 656 656 658 660 1% New York 326 325 325 324 324 323 -1% Connecticut 397 395 394 392 391 389 -2% Maryland 407 404 400 397 394 391 -4% Delaware 467 461 456 452 447 442 -5% Notes: The forecasted incarceration rates are calculated using adjusted Census projections and state prison population forecasts. This table has been updated with revised population estimates. 32 Public Safety, Public Spending
  • 43.
    TABLE A-7 AnnualOperating Costs per Inmate State/Region Annual Operating Cost Annual 2001 Costs Annual Operating Cost Change from Inflation Per Inmate 2001 Adjusted to 2005 Dollars Per Inmate 2005 Adjusted 2001 Costs to Actual 2005 Costs Federal $22,632 24,010 23,429 -581 State $22,650 23,941 23,876 -65 Northeast $33,037 35,048 35,584 536 Connecticut $26,856 28,467 29,527 1,060 Maine $44,379 47,042 35,012 -12,030 Massachusetts $37,718 39,981 43,026 3,045 New Hampshire $25,949 27,506 28,143 637 New Jersey $27,347 28,988 28,000 -988 New York $36,835 39,045 42,202 3,157 Pennsylvania $31,900 33,814 31,029 -2,785 Rhode Island $38,503 40,813 44,860 4,047 Vermont $25,178 26,689 28,846 2,157 Midwest $24,779 26,228 23,296 -2,932 Illinois $21,844 23,155 21,622 -1,533 Indiana $21,841 23,151 21,531 -1,620 Iowa $22,997 24,377 23,383 -994 Kansas $21,381 22,664 21,944 -720 Michigan $32,525 34,477 28,743 -5,734 Minnesota $36,836 39,046 29,260 -9,786 Missouri $12,867 13,639 14,183 544 Nebraska $25,321 26,840 25,079 -1,761 North Dakota $22,425 23,771 25,692 1,921 Ohio $26,295 27,873 23,011 -4,862 South Dakota $13,853 14,684 14,157 -527 Wisconsin $28,622 30,339 28,932 -1,407 South $16,479 18,476 17,991 -485 Alabama $8,128 8,616 13,019 4,403 Arkansas $15,619 16,556 17,608 1,052 Delaware $22,802 24,170 24,500 330 Florida $20,190 21,401 22,211 810 Georgia $19,860 21,052 17,017 -4,035 Kentucky $17,818 18,887 18,170 -717 Louisiana $12,951 13,728 13,009 -719 Maryland $26,398 27,982 30,244 2,262 Mississippi $12,795 13,563 13,428 -135 North Carolina $26,984 28,603 24,986 -3,617 Oklahoma $16,309 17,288 16,986 -302 South Carolina $16,762 17,768 13,170 -4,598 Tennessee $18,206 19,298 20,940 1,642 Texas $13,808 14,636 14,622 -14 Virginia $22,942 24,319 21,248 -3,071 West Virginia $14,817 15,706 16,976 1,270 West $25,231 26,720 29,608 2,888 Alaska $36,730 38,934 42,082 3,148 Arizona $22,476 23,825 19,795 -4,030 California $25,053 26,556 34,150 7,594 Colorado $25,408 26,932 26,248 -684 Hawaii $21,637 22,935 18,370 -4,565 Idaho $16,319 17,298 16,115 -1,183 Montana $21,898 23,212 25,710 2,498 Nevada $17,572 18,626 17,676 -950 New Mexico $28,035 29,717 26,971 -2,746 Oregon $36,060 38,224 24,665 -13,559 Utah $24,574 26,048 23,000 -3,048 Washington $30,168 31,978 29,005 -2,973 Wyoming $28,845 30,576 33,048 2,472 Source: Bureau of Justice Statistics and JFA Institute Note: Inflation assumed at 1.5% per year. Public Safety Performance Project 33
  • 44.
    TABLE A-8 Sourcesof State Prison Population Projections State Projections Source Alabama Addressing the Crisis: Charting the Course for Reform, Alabama Sentencing Commission 2006, p. 62 Alaska N/A Arizona JFA Arkansas Arkansas Department of Correction, Sentencing Commission, and Department of Community Correction Ten Year Adult Secure Population Projection 2006-2016, produced for the Arkansas Sentencing Commission by JFA Associates, LLC, authors: Roger Ocker & Wendy Ware, July 2006 California California Department of Corrections and Rehabilitation website (http://www.cya.ca.gov/ReportsResearch/OffenderInfoServices/Projections/F06pub.pdf) Colorado Colorado Division of Criminal Justice December 2005 Prison Projections & Legislative Council Staff December 2005 Prison Population Projections Connecticut N/A Delaware N/A Florida Detailed Monthly Forecast: October 12, 2006, Florida Criminal Justice Estimating Conference (http://edr.state.fl.us/conferences/criminaljustice/ES10122006.pdf) Georgia Georgia Department of Corrections Hawaii 10-Year Corrections Master Plan Update, pg. 2-9, December 2003, Carter Goble Associates, Inc. Idaho Idaho Offender Population Forecast FY 2007 through 2010, August 30, 2006, State of Idaho Department of Correction (http://www.corr.state.id.us/facts/monthly_stats/FY2007Forecast.pdf) Illinois Illinois Department of Corrections Indiana Indiana Department of Correction Iowa Iowa Prison Population Forecast, Iowa Department of Human Rights Division of Criminal and Juvenile Justice Planning, November 2006 Kansas 2006 Corrections Briefing Report, Kansas Department of Corrections (http://www.dc.state.ks.us/briefrep/2006BriefRep.pdf) Kentucky Kentucky Department of Corrections Louisiana Louisiana Department of Public Safety and Corrections Maine N/A Maryland Maryland Department of Public Safety and Correctional Services Massachusetts Massachusetts Department of Correction Michigan Report to the Legislature Pursuant to P.A. 154 of 2005 Section 401, Prison Population Projection Report January 2006, MDOC Office of Research & Planning Minnesota Minnesota Prison Population Projections Fiscal Year 2006 Report, p.9, Minnesota Department of Corrections (http://www.corr.state.mn.us/publications/documents/ProjectionsReport-FY06_000.pdf) Mississippi Mississippi Department of Corrections Ten Year Adult Secure Population Projection: 2004-2015, produced for the Mississippi Department of Corrections by JFA Associates, LLC, authors: Gillian Thompson & Wendy Ware, November 2006 Missouri Missouri Department of Corrections Montana Montana Department of Corrections webpage (http://www.cor.mt.gov/resources/reports/PopulationForecast.pdf) Nebraska Nebraska Department of Correctional Services Ten Year Adult Secure Population Projection 2007-2017, produced for the Nebraska Department of Correctional Services by JFA Associates, LLC, authors: Roger Ocker & Wendy Ware, July 2006 continued next page 34 Public Safety, Public Spending
  • 45.
    TABLE A-8 Sourcesof State Prison Population Projections (continued) State Projections Source Nevada Nevada Department of Corrections Ten Year Adult Secure Population Projection, produced for the Nevada Department of Administration, Budget Division by JFA Associates, LLC, authors: Gillian Thompson & Wendy Ware, November 2006 New Hampshire New Hampshire Department of Corrections New Jersey New Jersey Department of Corrections, Office of Policy & Planning New Mexico New Mexico Corrections Department Ten Year Adult Secure Population Projection, Revision C, FY 2007-2016, produced under contract for the New Mexico Corrections Department by JFA Associates, LLC, authors: Roger Ocker & Wendy Ware, June 2006 New York N/A North Carolina North Carolina Sentencing & Policy Advisory Commission FY 2005-2015 Population Projections, prepared in conjunction with Department of Correction's Office of Research and Planning, January 2006 North Dakota Study of the Facilities and Operations of the North Dakota Department of Corrections, Vol. II: Population Projections and Capacity Needs Analysis, June 15, 2002, Security Response Technologies, Inc. Ohio Ohio Prison Population Projections and Intake Estimates, Bureau of Research, Office of Policy and Offender Reentry, Ohio Department of Rehabilitation and Correction, author: Brian Martin, February 2006 Oklahoma Oklahoma Criminal Justice Resource Center, April 2006 Oklahoma Prison Population Projection (http://www.ocjrc.net/pubFiles/InmatePopulation/OklahomaPrisonPopulationProjection_2006.pdf) Oregon Oregon Corrections Population Forecast October 2006, Vol. XII No. 2, Office of Economic Analysis, Department of Administrative Services Pennsylvania Pennsylvania Population Projection Committee Report Update, September 2005 Rhode Island Rhode Island Department of Corrections Adult Prison Population Forecast FY 2006, produced for the Rhode Island Department of Corrections by JFA Associates, LLC, authors: Roger Ocker & Wendy Ware. South Carolina South Carolina Department of Corrections South Dakota South Dakota Department of Corrections Tennessee The Tennessee Department of Correction Fiscal Year 2005-2006 Annual Report Coordinated and Published by the Policy, Planning, and Research Division, authors: Linda M. Nutt, Cynthia Taylor, Sara Conte (http://www.state.tn.us/correction/pdf/0506anlrpt.pdf) Texas Adult Incarceration Projected Population, Texas Legislative Budget Board, January 2007 Utah N/A Vermont Vermont Department of Corrections Virginia Virginia Secretary of Public Safety & Policy Advisory Commission Washington Washington State Department of Corrections West Virginia West Virginia Correctional Population Forecast: 2004-2014: A Study of the State's Prison Population, December 2006, Criminal Justice Statistical Analysis Center, authors: Theresa K. Lester & Stephen M. Haas Wisconsin N/A Wyoming N/A Source: JFA Institute Public Safety Performance Project 35
  • 46.
    TABLE A-9 Sourcesof State Inmate Costs State Cost Source Alabama http://www.doc.state.al.us/docs/AnnualRpts/2005AnnualReport.pdf Alaska http://www.gov.state.ak.us/omb/06_OMB/budget/DOC/dept20.pdf Arizona http://www.azcorrections.gov/adc/reports/CAG/CAGJun05.pdf Arkansas Arkansas Department of Corrections California http://www.cya.ca.gov/divisionsboards/aoap/factfiguresarchive/factsfigures3rdq2005.html Colorado Colorado Department of Corrections Statistical Report Fiscal Year 2004, Office of Planning & Analysis, Kristi L. Rosten Connecticut http://www.ct.gov/doc/cwp/view.asp?a=1492&q=265472 Delaware http://www.state.de.us/correct/pdfs/BudgetInformationFY05.pdf & Delaware DOC Florida Florida Department of Corrections; ttp://www.dc.state.fl.us/upu/annual/0405/budget.html Georgia http://www.dcor.state.ga.us/pdf/FY05AnnualReportPart2.pdf Hawaii http://www.hawaii.gov/psd/documents/reports/PSD_AnnualReport_2004.pdf; http://www.ojp.usdoj.gov/bjs/pub/pdf/p04.pdf Idaho http://www.corr.state.id.us/facts/fact_sheets/QuickFactsJuly2006.pdf Illinois http://www.idoc.state.il.us/subsections/reports/department_data/Department%20Data%202005.pdf Indiana http://www.in.gov/indcorrection/facts.htm Iowa http://www.doc.state.ia.us/Documents/QuickFacts.pdf Kansas 2007 Corrections Briefing Report', Kansas Department of Corrections (http://www.dc.state.ks.us/briefrep/2006BriefRep.pdf) Kentucky Kentucky Department of Corrections Louisiana Louisiana Department of Public Safety and Corrections Maine Regional Average Maryland Maryland Department of Public Safety and Correctional Services Massachusetts http://www.mass.gov Michigan http://www.michigan.gov/documents/2004_Annual_Report_147719_7.pdf Minnesota http://www.doc.state.mn.us/aboutdoc/stats/documents/NotableStatistics7-06_000.pdf Mississippi http://www.mdoc.state.ms.us/Research%20and%20Statistics/OffenderCostPerday/ Cost%20Per%20Inmate%20Day%20FY%202005.pdf Missouri http://www.doc.mo.gov/pdf/AR%202005.pdf Montana http://www.cor.mt.gov/Facts/FAQ.asp; http://www.cor.mt.gov/Resources/Reports/PopulationForecast.pdf Nebraska http://www.corrections.state.ne.us/administration/statistics/reportdocs/05annualreport.pdf Nevada http://www.doc.nv.gov/stats/annual/fy2005.pdf New Hampshire http://www.nh.gov/nhdoc/divisions/publicinformation/documents/annual2005.pdf New Jersey http://www.state.nj.us/corrections/freqntlyasked.html New Mexico Regional Average New York New York Department of Correctional Services North Carolina http://www.doc.state.nc.us/dop/cost/ North Dakota http://www.state.nd.us/docr/docr/BiennialReport03-05.pdf Ohio http://www.drc.state.oh.us/web/Reports/FactSheet/July%202005.pdf Oklahoma http://www.doc.state.ok.us/newsroom/facts/06-01%20Facts%20at%20a%20Glance.pdf Oregon http://www.oregon.gov/DOC/PUBAFF/docs/pdf/quickfacts.pdf Pennsylvania http://www.cor.state.pa.us/stats/lib/stats/2006budgetpresentation.pdf Rhode Island http://www.doc.ri.gov/administration/Cost%20Per%20Offender%20-%202006.pdf continued next page 36 Public Safety, Public Spending
  • 47.
    TABLE A-9 Sourcesof State Inmate Costs (continued) State Cost Source South Carolina http://www.doc.sc.gov/FAQs/FAQs.html South Dakota http://www.state.sd.us/corrections/miscellaneous_stats.htm Tennessee http://www.state.tn.us/correction/faq.html Texas Texas Department of Criminal Justice Utah http://corrections.utah.gov/faq.html Vermont http://www.doc.state.vt.us/pageflip/pageflip.pl/picture?book=FF2006&seqno=1196 Virginia http://www.vadoc.state.va.us/about/facts/financial/2005/05percapita.pdf Washington http://www.doc.wa.gov/BudgetAndResearch/ResearchData/DOCStatisticalBrochureNov06P282.pdf West Virginia West Virginia Division of Corrections Wisconsin http://www.wi-doc.com/index_adult.htm Wyoming Regional Average Source: JFA Institute Public Safety Performance Project 37
  • 48.
    Endnotes 1 U.S. Department of Justice, Office of Justice Programs. Prisoners in 2005, Bureau 14 http://www.ojp.usdoj.gov/bjs/reentry/characteristics.htm of Justice Statistics Bulletin, by Paige M. Harrison and Allen J. Beck (Washington, 15 Data from Georgia Department of Corrections, Georgia Board of Pardons and D.C.: November 2006), NCJ 215092 and U.S. Department of Justice, Office of Paroles, and Georgia Criminal Justice Coordinating Council. Justice Programs. Prison and Jail Inmates at Midyear 2005, Bureau of Justice Statistics Bulletin, by Paige M. Harrison and Allen J. Beck (Washington, D.C.: May 16 For a detailed presentation of the New York experience, see Michael Jacobson, 2006), NCJ 213133. Downsizing Prisons: How to Reduce Crime and End Mass Incarceration (New York: New York University Press, 2005), Chapter 4. 2 U.S. Department of Justice, Office of Justice Programs. Prevalence of Imprisonment in the U.S. Population, 1974-2001, by Thomas P. Bonczar (Washington, D.C.: 17 Stephen, James J. (June 2004). State Prison Expenditures 2001. Washington, D.C.: August 2003), NCJ 197976. U.S. Department of Justice, Bureau of Justice Statistics. 3 King’s College, London, International Centre for Prison Studies. Prison Brief— 18 The one exception to this rule is where a state is contracting out to private Highest to Lowest Rates. Online. Available: prisons or local jails and where the contract allows for the cost to the private or http://www.kcl.ac.uk/depsta/rel/icps/world brief. Accessed: 2006. local facility to vary directly to the number of inmates it is housing. For example, in Louisiana, local jails bill the state for each state inmate it houses on 4 A common error is to lump together the terms “jail” and “prison.” In general, each day at a cost of $22 per day. jails are operated by county government and are reserved for persons who are awaiting trial or who have been sentenced to a term of less than one year. 19 U.S. Department of Labor, Bureau of Labor Statistics. http://data.bls.gov/cgi- Prisons are operated by state agencies and typically house persons with felony bin/cpicalc.pl. sentences of one year or more. 20 There were some states where the differences between 2001 and FY2005-06 5 U.S. Department of Justice, Office of Justice Programs. Prisoners in 2005, Bureau were so large that researchers decided to exclude them based on face validity of Justice Statistics Bulletin, by Paige M. Harrison and Allen J. Beck (Washington, concerns. Also excluded were states that showed significant declines in their D.C.: November 2006), NCJ 215092 costs between 2001 and FY 2005-06. 6 Ibid. 21 For a review of the more recent studies on the link between incarceration rates and crime rates, see the following reports: Michael Jacobson, Downsizing Prisons: 7 http://www.ojp.usdoj.gov/bjs/glance/tables/exptyptab.htm How to Reduce Crime and End Mass Incarceration (New York: New York University 8 The formula actually requires one to specify the LOS in years to produce an Press, 2005), Chapter 4. Michael Lynch, “Beating a Dead Horse: Is There Any annualized ADP. So if the LOS is not in years but days, one must divide the Basic Empirical Evidence of the Deterrent Effect of Imprisonment,” Crime, Law sum by 365 days to produce an LOS in years. and Social Change vol. 31, no. 4 (1999) p. 361. Tomislav V. Kocandizic and Lynne M. Vieraitis, “The Effect of County-Level Prison Population Growth on 9 The amount of discretion correctional authorities have to release prisoners Crime Rates,” Criminology & Public Policy, vol, 5, no. 2 (May 2006), p. 234. varies according to each state’s sentencing structure. The majority of states Raymond V. Leidka, et al, “The Crime-Control Effect of Incarceration: Does have indeterminate sentencing systems, which offer the greatest amount of dis- Scale Matter?” Criminology & Public Policy, vol. 5, no. 2 (May 2006), pp. 245-276. cretion since they allow parole boards to release inmates once they have served William Spelman, “The Limited Importance of Prison Expansion,” in The their minimum sentence. States with determinate sentencing structures provide Crime Drop in America, Alfred Blumstein and Joel Wallman, eds., Revised some level of discretion to release prisoners based on good-time and special Edition, (New York: Cambridge University Press, 2006), pp. 97-129. program credits. 22 For all historical incarceration rates presented in the figures in this section, the 10 Austin, James, John Clark, Patricia Hardyman, and D. Alan Henry. 1999. “The source is the Sourcebook of Criminal Justice Statistics Online, Impact of ‘Three Strikes and You’re Out’,” Punishment and Society, Vol 1(2): http://www.albany.edu/sourcebook/wk1/t6292004.wk1. The U.S. crime rate and 131-162. state crime rates presented in this section are those compiled and reported by 11 For six of the eight states, the average annual percent change was calculated the National Disaster Center, at from 2001 to 2005 and applied each year to future years. The other two states, http://www.disastercenter.com/crime/uscrime.htm Delaware and New York, have been showing declines over this time frame. 23 James Q. Wilson, “Crime and Public Policy” in James Q. Wilson and Joan Researchers contacted both states to determine if the downward trends might Petersilia, Crime ICS Press, Oakland, California 1995, p. 489-507. continue. Based on these contacts and a review of recent prison population trend data, this report assumes no growth over the next five years. It should be 24 Ibid, p. 501. emphasized that for these eight non-reporting states the estimates used in this 25 Don Stemen, “Reconsidering Incarceration: New Directions for Reducing report are not official forecasts. Crime,” Vera Institute of Justice, New York, New York, January 2007. 12 U.S. Department of Justice, Office of Justice Programs. Prisoners in 2005, Bureau 26 Ibid, p. i. of Justice Statistics Bulletin, by Paige M. Harrison and Allen J. Beck (Washington, D.C.: November 2006), NCJ 215092. 27 See, for instance, “The National Center for State Courts Sentencing Attitudes Survey,” July 2006. Findings from a poll of 1,502 randomly selected adults 13 U.S. Department of Justice, Bureau of Justice Statistics. Recidivism of Prisoners included that 76 percent of Americans “would rather see their tax dollars Released in 1994, (Washington, D.C.: Bureau of Justice Statistics, June 2002), support programs that try to prevent crime by helping offenders find jobs and NCJ 193427. get treatment than be used to build more prisons.” 38 Public Safety, Public Spending
  • 52.
    1025 F StreetNW, 9th Floor Washington, DC 20004-1409 phone 202.552.2000 | fax 202.552.2299