This document summarizes a study examining the normative assumptions underlying retailers' equity-based return shipping policies and how those assumptions compare to customers' actual responses. The study found that retailers overestimate the impact of customer attributions of fault on responses to fee versus free returns. Contrary to retailer assumptions, free returns led to increased post-return spending while fee returns led to decreased spending, regardless of attribution of fault. The findings suggest retailers should offer free returns or examine customer data on responses to fee returns.
Probabilistic selling is a marketing strategy that multi-item vendors provide to consumers, presenting
discounted options through acceptance of uncertain risks with random selections from sets of multiple distinct
items. However, past studies of this strategy assume a no return policy since returned items shift part of the
mentioned uncertain risk to the retailer. Because returns are a common business practice and an important
coordination tool in supply chains, this research identifies the impacts of a return policy on the efficacy of
probabilistic selling models
This research was conducted among consumers of famous retail stores (e.g. Carrefour, Giant,
Hypermart, Lotte, etc.) which offering private label brands in Jakarta. This study aimed to analyze the influence of
attitude and brand awareness toward private label brands purchase intention. The assumed sample size was 150
respondents by using convenience sampling technique. The multiple regression model was used in this research
data. The result shows there was relationship found among all the given variables, which means that all research
hypotheses were found to be supported. These findings are expected to provide useful managerial implications for
retailers in terms of effective solutions marketing for private label brands.
Single Or Multiple Sourcing: A Mathematical Approach To Decision Makinginventionjournals
ABSTRACT: There is often a tussle between choosing a right sourcing strategy which says, whether the buyer should go for single sourcing or multiple sourcing. In this paper we introduces quality as a parameter apart from other parameter such as economies of scale and specific knowledge or learning effect on sourcing strategy selection by taking into account the small number of interaction involving buyer and competing suppliers, formulated mathematically using Berndt Wood Model (Translog cost function). The objective is to find whether the difference function between the cost of production in single sourcing and Multiple (dual) sourcing is decreasing or increasing, when quality as parameter is introduced. Using the concept of maximization and minimization of a function, it is achieved, considering certain assumptions. Here the results indicates that in the long run multiple sourcing is definitely the better option, which able to cater quality as well as supplier opportunism and cost. This further established by the numerical illustration.
A study on the chain restaurants dynamic negotiation games of the optimizatio...ijcsit
In the era of meager profit, production costs often become an important factor affecting SMEs’ operating
conditions, and how to effectively reduce production costs has become an issue of in-depth consideration
for the business owners. Especially, the food and beverage (F&B) industry cannot accurately predict the
demand. It many cause demand forecast fall and excess or insufficient inventory pressure. Companies of
the F&B industry may be even unable to meet immediate customer needs. They are faced great challenges
in quick response and inventory pressure. This study carried out the product inventory model analysis of
the most recent year’s sales data of the fresh food materials for chain restaurants in a supply chain region
with raw material suppliers and demanders. Moreover, this study adopted the multi-agent dynamic strategy
game to establish the joint procurement decision model negotiation algorithm for analysis and verification
by simulation cases to achieve the design of dynamic negotiation optimization mechanism for the joint
procurement of food materials. Coupled with supply chain management 3C theory for food material
inventory management, we developed the optimization method for determining the order quantities of the
chain restaurants. For product demand forecast, we applied the commonality model, production and
delivery capacity model, and the model of consumption and replenishment based on market demand
changes in categorization and development. Moreover, with the existence of dependencies between product
demands as the demand forecast basis, we determined the appropriate inventory model accordingly.
Can Product ReturnsMake You MoneyS P R I N G 2 0 1 0 .docxhacksoni
Can Product Returns
Make You Money?
S P R I N G 2 0 1 0 V O L . 5 1 N O . 3
R E P R I N T N U M B E R 5 1 3 1 6
J. Andrew Petersen and V. Kumar
SLOANREVIEW.MIT.EDU SPRING 2010 MIT SLOAN MANAGEMENT REVIEW 85
After a certain threshold, a customer’s rate of product
returns actually correlates to an increase in the amount
of his or her future purchases.
C U S T O M E R S E R V I C E
MANY COMPANIES SEE customers’ product returns as a major inconvenience and an eroder
of profits. After all, product returns cost manufacturers and retailers more than $100 billion per
year, or an average loss per company of about 3.8% in profit.1 The electronics industry alone spends
some $14 billion annually on product returns through reboxing, restocking and reselling. And be-
cause only about 5% of products are returned as a result of defects, it appears that product returns
will remain an inevitable part of the customer-company relationship even as manufacturing con-
tinues to improve product quality.
For some companies, the solution has been to create product-return disincentives, such as lim-
ited time frames for returns (say, within 30 days after purchase), product customization that allows
returns only when the product is defective, and
nonrefundable purchase costs (shipping costs
or restocking fees, for example). But are these
practices, which reduce the costs and frequen-
cies of product returns, ideal for the bottom
line? Despite the company’s handling costs and
its revenues lost from refunds, the customer’s
ability to return products may have a positive
effect on his or her future purchases and actu-
ally increase long-term profits.
Several recent studies have in fact begun illu-
minating the potential benefits of allowing
customers to return products with impunity. This
research finds that when a company has a lenient
product-return policy, which allows customers to
return almost any product at any time, they are
more willing to make other purchases.2 The
knowledge that they can return a product reduces
the risk customers might perceive in purchas-
ing it in the first place. The studies also find that a
Marketers and sellers hate product returns, but smart
companies aren’t passively accepting them as bitter pills
to be swallowed. They’re managing product-return
policies to maximize future profits.
BY J. ANDREW PETERSEN AND V. KUMAR
Can Product Returns
Make You Money? THE LEADING QUESTION
How can
marketers
manage
product-return
policies to
maximize
future profits?
FINDINGS
Marketers can
target and manage
customers by taking
information about
both their purchase
and return behaviors
into account.
Lenient product-
return policies yield
more profits than
strict product-return
policies.
Managing product
returns in an optimal
way increases profits
even during tougher
economic times.
www.sloanreview.mit.edu
86 MIT SLOAN MANAGEMENT REVIEW SPRING 2010.
Atmospheric Affect as a Tool for CreatingValue and Gaining S.docxjasoninnes20
Atmospheric Affect as a Tool for Creating
Value and Gaining Share of Customer
Barry J. Babin
UNIVERSITY OF SOUTHERN MISSISSIPPI
Jill S. Attaway
ILLINOIS STATE UNIVERSITY
Can the retail atmosphere be useful in developing long-lasting relationships many retailers inhabit, success driven retailers must find ways
to maintain stability and grow in order to survive.with consumers? This research addresses this question by investigating
the impact of positive and negative affect associated with ambient environ- At a basic level, retailers’ lifeblood is the revenue developed
through relationships with customers. This revenue can bemental conditions. A key dependent variable is conceptualized and vali-
dated and captures the proportion of business a customer spends in one expanded and developed through cultivating relationships
with new customers, encouraging current customers to spendlocation relative to a store’s direct competitors. Structural equation results
suggest that both positive affect and negative affect impact this measure, a larger proportion of their dollars with the retailer, and by
extending the length of time or duration of the relationship—but the impact is facilitated through both feelings’ relationship with hedonic
and utilitarian shopping value. J BUSN RES 2000. 49.91–99. 2000 seeking customers for life. A Canadian grocery chain explored
these avenues for increasing profitability and observed that ifElsevier Science Inc. All rights reserved.
each customer purchased one additional produce item, profit-
ability would increase by more than 40%. Similarly, current
customers who substituted two store-brand items for two
S
urvival through continuous acquisition of consumer re- national brand items each store visit, would increase profitabil-
ity by 55%. Furthermore, if these improvements were achievedsources is the most paramount goal and most appro-
priate orientation of a firm (Anderson, 1982). Retailers simultaneously, future gross profits could be improved dra-
matically (Grant and Schlesinger, 1995). Thus, expanding aand service providers have offered various incentive programs
in an effort to gain a greater share of each customer’s business. customer’s share of wallet can lead to profitability gains and
future success. The question remaining is how can retailersLike airlines with frequent flyer programs, hair salons, book-
stores, and even mass merchandisers have offered programs achieve a greater proportion of customers’ expenditures?
The research presented here investigates a retailer’s physicalin which frequent purchasers can gain further purchase incen-
tives. The success and expense of these programs vary, but atmosphere and its role in creating consistent purchase behav-
ior. Previous research demonstrates how ambient conditions,the focus on developing more repeat purchases from each
consumer motivates research into other avenues for generating including store layout, design and signage, and employee and
custom ...
This is the fourth in a series of briefs examining practical considerations in the design and implementation of a strategic purchasing pilot project among private general practitioners (GPs) in Myanmar. This pilot aims to start developing the important functions of, and provide valuable lessons around, contracting of health providers and purchasing that will contribute to the broader health financing agenda. More specifically, it is introducing a blended payment system that mixes capitation payments and performance-based incentives to reduce households’ out-of-pocket spending and incentivize providers to deliver an essential package of primary care services.
THE IMPACT OF PSYCHOLOGICAL BARRIERS IN INFLUENCING CUSTOMERS’ DECISIONS IN T...ijmpict
Increased competition in broadband telecommunication market led to a surge in campaigns and packages for customers. Whereas traditional economic theory assumed that abundance of alternatives is to be welcomed by customers, recent theories however, have emphasized that multiple choices may have a negative role in adoption or switching behavior. The unorthodox conclusions of negative impact of wide assortment of choices were studied through the lens of behavioral economics. Most notably, “anticipated regret” was identified to be major cause of choice deferral of purchase. This paper investigates the role of selection difficulty and anticipated regret on the intention of broadband subscribers to upgrade to higher connection speed. The result shows that there is a significant positive relationship between anticipated regret and decision avoidance. Results also indicate that selection difficulty has positive relationship with switching cost thus indirectly reducing the perceived net benefit of upgraded internet connection. This study, therefore, confirmed the significant impact of psychological barriers together with economic factors in influencing customers’ decisions in the telecommunication sector. This paper thus recommends managers of telecom firms and regulators to seek reducing anticipated regret and selection difficulty when promoting upgraded services even when such services are promising higher economic benefit.
How Providers Can Reshape their Operations to Master Value-Based ReimbursementsCognizant
Healthcare providers must make sweeping system, process and operational changes to thrive under the inevitable move to value-based payments. Here are our recommendations on how to get started.
American Journal of Multidisciplinary Research and Development is indexed, refereed and peer-reviewed journal, which is designed to publish research articles.
The Impact of Consumers Perception of Environment and Technology in Redeeming...CSCJournals
Consumers are now more technologically oriented than ever before and are also more concerned about the environment compared to previous times. A new model called Technology & Environment Mediation Model (TEMM) for consumer action related to the willingness to redeem e-coupons is proposed by combining aspects of Theory of Reasoned Action (TRA) and Technology Acceptance Model (TAM). This model articulates perceived the usefulness of having the environmental benefits of e-coupons integrated with concepts of having ease of use for accessing coupons online. Technology is predicted to have mediating effects on perceived easiness of access and environment is expected to mediate perceived usefulness of using e-coupons. The paper also introduces a number of possible research propositions and relates them to managerial implications and Structure Equation Model (SEM) is suggested as an appropriate methodology for testing the proposed model.
MBA 5501, Advanced Marketing 1 Course Learning Outcom.docxaryan532920
MBA 5501, Advanced Marketing 1
Course Learning Outcomes for Unit VI
Upon completion of this unit, students should be able to:
6. Explore positioning, differentiation, and pricing strategies for effective marketing scenarios.
6.1 Compare the pricing strategies of a company and its competitors.
6.2 Describe pricing, distribution, or product strategies of a company with respect to the level of
differentiation.
6.3 Summarize how macro and micro environmental changes will impact a company.
Reading Assignment
Chapter 16:
Developing Pricing Strategies and Programs
Chapter 17:
Designing and Managing Integrated Marketing Channels, pp. 493–502
Chapter 18:
Managing Retailing, Wholesaling, and Logistics, pp. 527–542
Unit Lesson
Price is defined as the amount of money that is exchanged for something of value, which is defined by the
customer. This value proposition directly aligns with the amount of money that a consumer is willing to pay for
the prescribed product and/or service. Prices are adjusted based upon discounts, which could include
seasonal discounts, quantity discounts, cash discounts and/or simply sales discounts. Another factor that
could change the price are allowances; which include trade-ins and damaged goods allowances. Prices can
be set based upon a one-price policy, which suggests that prices are the same for everyone. These tend to
be low-cost, frequently purchased, and convenience goods. Alternatively, prices can be set based upon a
flexible price policy, which allows for prices to be set differently for different customers. These prices tend to
be set by salespeople who are working directly with the customer. A good salesperson understands his or her
customer enough to know how high of a price the customer will bear and will adjust the price accordingly in
order to secure the business. This model is used at car dealerships within the business-to-consumer (B2C)
model as well as in most purchasing situations in the business-to-business (B2B) sector.
As the marketing team looks to establish pricing policies, company-wide marketing objectives need to be
analyzed. The first pricing objective might be profit-oriented, which includes the concepts below.
Target return: This pricing policy establishes a predetermined profit level guideline. This could be a
return on investment or a certain sales level. Prices are then based upon this guideline.
Maximize profits: This pricing policy suggests that prices will be set as high as possible in order to
maximize profit levels. While this seems like an ideal alternative, careful research must be conducted
to understand the profit level that the customer will bear before moving on to the competitor.
UNIT VI STUDY GUIDE
Pricing and Distribution Strategies
MBA 5501, Advanced Marketing 2
Another pricing objective might be sales-oriented, which focuses on increased sales without regard to profit
levels. This alternative se ...
THE IMPACT OF PSYCHOLOGICAL BARRIERS IN INFLUENCING CUSTOMERS’ DECISIONS IN T...ijmpict
Increased competition in broadband telecommunication market led to a surge in campaigns and packages
for customers. Whereas traditional economic theory assumed that abundance of alternatives is to be
welcomed by customers, recent theories however, have emphasized that multiple choices may have a
negative role in adoption or switching behavior. The unorthodox conclusions of negative impact of wide
assortment of choices were studied through the lens of behavioral economics. Most notably, “anticipated
regret” was identified to be major cause of choice deferral of purchase. This paper investigates the role of
selection difficulty and anticipated regret on the intention of broadband subscribers to upgrade to higher
connection speed. The result shows that there is a significant positive relationship between anticipated
regret and decision avoidance. Results also indicate that selection difficulty has positive relationship with
switching cost thus indirectly reducing the perceived net benefit of upgraded internet connection. This
study, therefore, confirmed the significant impact of psychological barriers together with economic factors
in influencing customers’ decisions in the telecommunication sector. This paper thus recommends
managers of telecom firms and regulators to seek reducing anticipated regret and selection difficulty when
promoting upgraded services even when such services are promising higher economic benefit.
The Need to Embrace Profit Cycle Management in Healthcare - WhitepaperGE Healthcare - IT
Executive Overview
Healthcare organizations have been operating under a fee-for-service
model for many years. As such, financial leaders have become well
versed in implementing revenue cycle management systems and
processes that primarily focus on the money that comes into an
organization. Today, a new need is emerging. Healthcare reform
and other system changes are moving the industry toward hybrid
payment models such as bundled payments, shared savings, and
capitation. To thrive in this new environment, financial leaders need
to move toward profit cycle management – an emerging model
that matches the revenues from new payment models with an
improved understanding of the true costs to deliver patient care.
The result: Positive financial performance – even in the face of
declining payments – that can be reinvested in the mission to
provide better care.
The foundation of any business or household is profit, defined as
revenue net of expenses (and applicable as such even to not-for-profit
organizations). Regardless of whether you are start-up, a Fortune 500
company, or a family of four, you need to ensure that you are bringing
in more money than you are spending. In many businesses, the
formula to determine your “profitability” is fairly straightforward.
In healthcare, however, the situation is significantly more complex,
as existing and new payment models make it difficult to determine
exactly how much revenue is going to come in the door. On the cost
side, the move to accountable care and value-based payment has
shifted the management of risk and cost onto the providers and
delivery networks, yet most providers lack the tools that would
provide a detailed understanding of the costs required to deliver
quality care, especially when that care is delivered in multiple
locations. A new model of software tools is required – representing
the next generation of revenue cycle management tools and an
emerging class of healthcare cost accounting tools. The end goal?
A solution for profit cycle management that will help organizations
generate a positive financial performance and can be reinvested
in the mission to provide better care.
This change will not happen overnight. Rather, it will be an evolution
over the next five years, as integrated delivery networks update
their revenue cycle solutions to accommodate the new payment
models, and as they deploy new activity-based costing solutions.
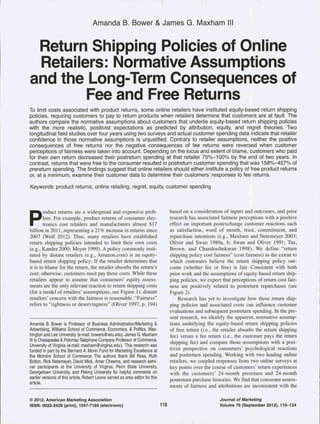
2. FIGURE 1
Model of the Normative Assumptions of the Product Returns Process Underlying Equity-Based Return
Shipping Policies
Product Failure
Blame is eithe
retailer or to
self/consumer
^
rtO
Attributed to
Retailer
Free Return
Retailer's assessment No misapplication of j ^
ofbiame is consistent
with the consumer's
assessment
Attributed to
Self/Consumer
return shipping policy
Fee Return
Equity
Accomplished
Consumers will
perceive a return
shipping policy as fair
if the one to blame
pays for the return,
even if the consumer
pays for it
^ / Postreturn
^ Spending i
Equity is the only
response to a
return shipping
policy that affects
postreturn
spending
Notes: Explanations of assumptions underlying process model structure are in italics.
FIGURE 2
Conceptual Model of Consumer Responses to Product Return Shipping Policies
Retailer
Attribution for
Product Returns
Return Shipping
Policy
(Free/Fee)
(
1
' H2
Self-Attribution
for Product
Returns
^ ^ ^ ^
^ - ~-^
Customer
Perceptions of
Cost Fairness
— ^
^ -^^
)
/ H4 V
J
Customer Spending
normative (and self-serving) assumptions of retailers. Not
only do retailers overestimate tbe ameliorating (moderat-ing)
effects of attributions on fee returns, but tbey also
ignore consumers' affect stemming simply from return fees.
In addition, free returns resulted in increases in postreturn
spending (from preretum levels), and fee returns resulted in
decreases in postreturn spending (from preretum levels), all
regardless ofbiame attributions.
Research on return policies is still developing. Botb
Pastemack (2008) and Padmanabban and Png (1997) exam-ine
manufacturer return sbipping policies offered to retail-ers.
Otber research bas assessed actual consumer responses
to return policies, suggesting the benefits to retailers of easy
return policies. Anderson, Hansen, and Simester (2009)
examine the value to consumers of the simple presence (vs.
absence) of a return option and suggest a model retailers
could use to optimize return policies. MoUenkopf et al.
(2007) find that previous service experiences (e.g., return
policies, web interface) could directly influence consumer
loyalty intentions in the present product return context.
Consistent with the present research, there is some
research indicating that return policies instituted with the
short-term gain in mind may have long-term negative con-sequences
for tbe retailer. Despite retailer desire to control
for "inappropriate" or "opportunistic" product returns with
stricter return policies (Davis, Hagerty, and Gerstner 1998;
Hess, Chu, and Gerstner 1996), Wood (2001) finds that
lenient policies (manipulated in two of her studies as
including free shipping) were associated with increased
probability of ordering from the retailer, heightened ratings
of product quality, and a reduction in overall purchase deci-sion
conflict. Viewing the return process as part of a cycle,
Petersen and Kumar (2009) find that while an increase in
product returns results in a decrease in marketing communi-cations
from the marketer toward that consumer, that same
increase in returns will result in an increase in future cus-
Return Shipping Policies of Online Retailers /111
3. tomer repurchases (up to a threshold). This research sug-gests
the value in comparing the return policy assumptions
that retailers make with actual consumer reactions.
The Assumptions of Equity-Based
Return Shipping Poiicies
The implementation of an equity-based return shipping pol-icy
is predicated on a variety of apparently implicit and nor-mative
assumptions that lead distant retailers to believe
such a policy would be both cost-effective and reasonable
to customers. We consider those assumptions here and com-pare
them with the customer reactions suggested by prior
research.
Assumption of Proportional Equity
An assumption of equity-based return shipping policies is
that consumers will perceive an exchange as fair if the out-comes
they receive are proportional to the inputs they con-tribute,
which translates into the "one to blame is the one to
pay" philosophy (see Figure 1). Although this assumption is
consistent with more traditional equity theories (e.g.,
Homans 1961), subsequent research suggests that people
prefer advantageous or positive inequity (i.e., the equitable
behavior that results in the maximization of one's own out-comes;
e.g., Lapidus and Pinkerton 1995; Oliver 1997;
Oliver and Swan 1989a). The customer view of advanta-geous
inequity as "fairer" is prevalent in customer-retailer
relationships (versus interpersonal). Customers may not see
themselves as having equal responsibilities to the retailer in
the exchange and may have more substantial expectations
that the retailer bear much of the burden of the exchange
(e.g.. Berger, Conner, and Fisek 1974; Lapidus and Pinker-ton
1995; Oliver 1997; Oliver and Swan 1989a, b). Consis-tent
with prior research, we expect that customers receiving
free returns will report significantly higher levels of cost
fairness and have greater relative postretum repurchases
than customers receiving fee returns, regardless of level of
blame attribution (though we do expect blame attribution to
moderate the extent of the effect, as discussed subsequently).
Assumptions of Causal Attribution Dependence
Retailers employing equity-based return shipping policies
appear to assume that consumers' attribution of responsibil-ity
for the return will be consistent with the retailers' (see
Figure 1). Furthermore, retailers assume that these attribu-tions
are negatively related so that as responsibility
assigned to the consumer goes up, assignment to the retailer
necessarily goes down. Called the "hydraulic assumption"
in attribution theory, support for it means that causal agents
for a given outcome should have "near perfect negative cor-relation
between these judgments" (Bassili and Racine
1990, p. 882), "as if causal candidates competed with one
another in a zero-sum game" (Nisbett and Ross 1980, p.
128). However, the hydraulic assumption of attributions has
been largely disproven (e.g., Bassili and Racine 1990; Krull
2001; Miller, Smith, and Uleman 1981; Nisbett and Ross
1980; Taylor and Koivumaki 1976) because "internal and
external [attributions] are not opposites on a single dimen-sion"
(White 1991, p. 266). Solomon (1978) reviews
research in which causal agents were measured separately
(vs. on opposite ends of a single scale), concluding that the
hydraulic assumption is "untenable." Similarly, Taylor and
Koivumaki (1976) find when measuring the two separately
that the correlation was -.14 (not significant [n.s.]).
Therefore, in contrast to the assumptions underlying
equity-based return shipping policies, a stronger attribution
to the consumer may not necessarily result in a weaker attri-bution
to the retailer (e.g., Johnson, Mullick, and Mulford
2002; Miller, Smith, and Uleman 1981). Although cus-tomers
may attribute some product failures exclusively to
the retailer, customers may instead attribute failure to them-selves,
to neither party, or perhaps to both (e.g., Folkes
1984; Kelley, Hoffman, and Davis 1993; Oliver 1997;
Weiner 2000; White 1991). In other words, we would expect
that retailer and consumer self-attributions are independent,
without a near-perfect negative relationship. Figure 2 pre-sents
the separate conceptualization and relationships.
Consequences of Inaccurate Assumptions in
Attribution and Equity Assessments
As a result of these assumptions, equity-based return ship-ping
policies allow for only two possible pairs between
attributions and applied return shipping policy: Retailers
only pay when the return is their own fault, and consumers
only pay when it is their own fault (see Figure 1). However,
these policies do not take into account the reactions of con-sumers
who are required to pay for a return for which they
blame the retailer, nor do they allow for the possible bene-fits
that might accrue when a consumer receives a free
return when there is a stronger self-attribution. Put differ-ently,
what happens when a consumer is "miscategorized"
and disagrees with the retailer's assessment?
There is a strong likelihood that consumers will dis-agree
with retailer assignment of responsibility to the con-sumer
(Oliver 1997). Consumers have a tendency to take
more credit for positive outcomes and less blame for fail-ures,
particularly in a marketing relationship (e.g., Oliver
1997; Valle and Wallendorf 1977). Given their preference
for positive inequity, consumers tend to put particular
emphasis on consumer outcomes and retailer inputs, result-ing
in a disproportionate reaction to negative inequity (e.g.,
Oliver 1997; Walster, Berscheid, and Walster 1973). There-fore,
the damage done to equity perceptions and postretum
repurchases by a fee (vs. free; consumer outcomes) return
will be disproportionately greater when consumers make
stronger retailer attributions (vs. weaker; retailer inputs).
Thus:
Hj: Return shipping policy and retailer attributions interact
such that customers who experience a fee (vs. free) return
report disproportionately lower cost fairness and decrease
spending when they indicate stronger retailer attributions
than when they indicate weaker retailer attributions.
There may also be positive effects of a "miscatego-rized"
free return: a free return for which consumers
strongly attribute the return to themselves. Thus, the pre-ferred
state of positive inequity (e.g., Lapidus and Pinkerton
1995; Oliver 1997; Oliver and Swan 1989a) would be
112 / Journal of Marketing, September 2012
4. heightened when the customer receives a free retum when
there are greater levels of self-attribution for the need for
the product retum. Furthermore, under complaint condi-tions,
Lapidus and Pinkerton (1995) find no evidence to
support their hypothesis that consumers feel guilt or other
unpleasant emotional states as a result of this type of posi-tive
inequity. When assessing resentment stemming from a
high/low outcome in an equitable/inequitable situation, they
find that an interaction resulted largely from the dispropor-tionately
low levels of resentment when participants experi-enced
a positively inequitable situation. In other words, it is
unlikely that there would be any negative emotional reac-tions
(e.g., guilt) to negate or neutralize the positive reac-tions
resulting from a free but "undeserved" return. Thus:
H2: Return shipping policy and self-attributions interact such
that customers who experience a free (vs. fee) return
report disproportionately higher cost faimess and increase
spending when consumers make stronger self-attributions
than when they make weaker self-attributions.
The Centrai Role of Regret on Consumer
Responses
Retailers employing equity-based return shipping policies
clearly assume that fairness is the key response to the
retum, expecting that postretum spending will be unaf-fected
by retum shipping costs if the retum was "fair."
However, consumers may have other, more dominant reac-tions
to a fee or free retum shipping policy beyond the
deservedness or fairness of retum costs. Specifically, regret
refers to a negative feeling or "sense of sorrow" (Simonson
1992, p. 105) experienced in response to a negative out-come
when a person compares his or her own actions to
alternative behaviors and preferable outcomes (i.e., counter-factuals)
that might have occurred instead (e.g., Zeelenberg,
Van Dijk, and Manstead 1998). The opposite of regret is
rejoicing or elation (e.g., Greenleaf 2004; Inman, Dyer, and
Jia 1997; Landman 1987), which occurs when a person's
choices lead to an outcome that is better than if other
choices were made.
Consumers are strongly motivated to avoid the emo-tional
experience of regret, leading them to protect them-selves
against it (e.g., Cooke, Meyvis, and Schwartz 2001;
Greenleaf 2004; Inman and McAlister 1994). The simple
anticipation of regret with regard to a future decision may
result in inaction (i.e., nonpurchase; e.g., Landman 1987;
Lemon, White, and Winer 2002; Simonson 1992; Tsiros and
Mittal 2000). In contrast, an experience with rejoicing can
lead people to make decisions that may involve riskier—but
the hope of better—outcomes. For example, Greenleaf
(2004) demonstrates that auction sellers experienced rejoic-ing
because the winning price of an auction was higher due
to the reserve price. These sellers subsequently set an even
higher reserve price in a second auction, even though those
higher reserve prices might decrease the chances of a suc-cessful
second auction. Therefore, consistent with previous
work, we expect regret to be negatively related to postretum
repurchases (see Figure 2).
Consumers may already experience a baseline level of
regret stemming from the product failure and the need to
retum the product (e.g., Oliver 1997). Of particular interest
here is the effect that retum shipping costs may have on that
baseline level of regret. Customers facing a fee retum will
have an unrecoverable monetary cost due to retum shipping
fees, in contrast to a nonpurchase from that retailer (Gilly
and Gelb 1982). Comparison of this actual monetary loss to
the nonpurchase altemative may heighten feelings of regret
and, in particular, concems about future retum fees stem-ming
from future purchases. Consistent with prior research,
we expect that customers whose regret is further heightened
by a fee retum will prevent the experience of future regret
by reducing their purchases from the present distant retailer.
Conversely, customers whose regret is lowered (i.e., greater
levels of rejoicing) as a result of a free retum may increase
postretum spending, willingly making riskier purchases.
Thus (see Figure 2):
H3: Compared with a baseline of regret stemming from the
need to return the product, customers receiving free
returns report significant decreases in that experienced
regret, whereas customers receiving fee returns report sig-nificant
increases in that experienced regret.
While faimess and regret have appeared as constructs in
the same study (e.g., Verhoef, Franses, and Hoekstra 2001;
Vorhees, Brady, and Horowitz 2006), the relationship
between the two remains to be addressed. As O'Shaugh-nessy
and O'Shaughnessy (2005) indicate, regret theory has
implications in equity considerations. We suggest that in
addition to the regret heightened by retum costs, consumers
might also experience heightened regret as a result of being
treated in a manner they perceive as unfair. Xia, Monroe,
and Cox (2004, p. 7) argue (but do not demonstrate) that if
consumers believe a price to be unfair, they may choose to
"leave the relationship, depending on their assessment of
which action is most likely to restore equity" (for similar
logic, see O'Shaughnessy and O'Shaughnessy 2005). Thus
(see Figure 2):
H4: Cost fairness is negatively related to regret, with regret
partially or wholly mediating the relationship between
cost faimess and postretum spending.
iVIethods
Study 1: Equity-Based Return Shipping Policies
We conducted a longitudinal event field study over four years
with a panel of online customers (average of 8.4 orders per
year) who returned products to a leading e-commerce
retailer of frequently purchased home, garden, and personal
items. To qualify for the panel, customers needed at least 24
months of prereturn spending data. We gathered data at the
following six time periods: (1) 24 months before the retum
(i.e., 24 months prereturn [TO]), (2) 12 months leading up to
the retum (i.e., 12 months preretum [Tl]), (3) time of retum
(i.e., retum [T2]), (4) soon after the retailer handled the
retum (i.e., postretum [T3]), (5) 12 months after the retum
(i.e., 12 months postretum [T4]), and (6) 24 months after
the retum (i.e., 24 months postretum [T5]). The T2 data
were collected during approximately the same month. Thus,
all customers shared approximately the same T0-T5 period.
Return Shipping Policies of Oniine Retailers /113
5. and we had data from 24 months before and after the retum
for each respondent.
12 and 24 months preretum (TO, Tl). We collected
yearly prereturn purchasing history for the 24 months
before the return for the 334 respondents who completed
the T2 and T3 surveys. These data included the number of
orders placed, the dollar value of the orders, and the product
descriptions. We accounted for inflation in dollar variables
using the seasonally adjusted Consumer Price Indexes.
Return (T2). At the time of retum, 500 customers either
telephoned the retailer or initiated a retum using the form
enclosed in their order, triggering the T2 online question-naire
link to be e-mailed. Customers were offered a $25 gift
certificate to complete the two surveys (T2 and T3). (Only
39% of respondents in Study 1 redeemed the gift certificate,
and there were no significant differences in redemption
rates across fee and free conditions [p > .50].) Of the 500
surveys sent, 351 customers completed usable surveys, rep-resenting
a 70% response rate. The T2 survey first asked
customers to indicate the details of their retum (i.e., product
numbers, whether the items were purchased as gifts, reason
for returning, prepurchase awareness of the return shipping
policy, and whether they wanted a refund or exchange).
Customers completed questions regarding situational pur-chase
involvement, regret, attributions toward the retailer,
and self-attributions, and all items were measured on a
seven-point scale. We adapted to this study a three-item
semantic differential involvement measure from prior
research (Ratchford 1987) to measure whether the purchase
of the product was highly involving. A three-item retailer
attribution measure asked respondents to indicate the extent
to which the retailer was responsible for the letum, while a
separate three-item self-attribution measure assessed self-attribution.
We adapted a measure from Tsiros and Mittal
(2000) to measure customer perceptions of regret. Finally,
respondents provided demographic and buyer profile infor-mation
(see the Appendix).
Postretum (T3). After the completion of the return
process (refund or receipt of a product exchange), a second
survey link was e-mailed to the 351 respondents who com-pleted
the T2 survey. Of those, 334 customers completed
usable surveys, representing a 95% response rate for T3 and
an overall 67% response rate. The sample had the following
demographic characteristics: 58% of the respondents were
female, 66% were 36-55 years of age, 75% held college
degrees, and 89% reported that they retum less than 20% of
their online purchases. In addition, this was the first product
retum for all customers to this retailer, creating a baseline
for accurately tracking customer perceptions regarding their
first retum experience with the focal retailer. The T3 survey
assessed customer perceptions of regret and cost faimess
measures adapted from prior research (Smith, Bolton, and
Wagner 1999; Tax, Brown, and Chandrashekaran 1998).
12 and 24 months postretum (T4, T5). We collected two
years of postretum purchasing history for the 334 respon-dents,
including the number of orders placed, dollar value
of the orders, and product descriptions. None of our respon-dents
retumed the purchases made 24 months after their ini-tial
retum, and the postretum customer spending variables
exclude the monetary value of the focal product retum as
well as the $25 gift certificate value.
Return shipping policy outcome. Fifty-three percent of
respondents received a free return. Consistent with an
equity-based retum shipping policy, a retum manager used
customer self-report as an input in making "fair" judgments
regarding blame and allocation of retum shipping costs. In
general, the retailer in Study 1 assigned a fee retum when
customers indicated one of the following reasons for the
retum: (1) the item did not fit, (2) the item was too expen-sive,
(3) the color did not match, (4) gift recipients did not
want/need, (5) the item did not fit with other components,
or (6) the customers changed their minds. The retailer
offered a free retum when customers returned an item for
the following reasons: (1) the item was damaged in transit,
(2) the item was defective, or (3) the company shipped the
wrong item.
Contextual variables. We gathered potential covariates
both from the surveys and the retailer database. These
covariates include product involvement, the dollar amount
of shipping costs to retum the product (regardless of fee or
free policy), the number of days to resolve the return, the
number of days that passed after receiving the product
before the retum was initiated, the length of the customers'
relationship with the retailer (measured at 24 months pre-retum),
the dollar amount of the order, and the dollar amount
of the retumed items.
Study 2: Generalizing Beyond Equity-Based
Return Shipping Policies
To rule out that cost faimess and regret reactions are due to
the type of retum shipping policy (i.e., equity based), we
conducted a second longitudinal field study over the same
49-month period with an electronics retailer that used a dif-ferent
retum shipping policy. The retailer categorized prod-ucts
as qualifying for free or fee returns according to the
gross margins, warning consumers before purchase (even
requiring them to click a box noting their understanding)
whether a retumed product would be subject to shipping
charges regardless of blame. Customers who were reim-bursed
were categorized as "free" (n = 682, 53), and those
who were not reimbursed were categorized as "fee" (n =
614). Thirty-six percent of the retums were because cus-tomers
changed their minds; 27% were due to problems
with item descriptions, installation, or instructions; and
37% were due to quality problems. Customers place an
average of 12.6 orders per year with the retailer. The data
collection procedures and measures for the electronics sam-ple
mirrored those employed in the first study. Of the 2750
surveys sent at the time of retum (T2), 1623 customers
completed usable surveys, representing a 59% response
rate. After the retailer handled the retum, 1296 customers
completed and submitted a usable T3 survey (an 80%
response rate for T3). We collected 24 months of pre- and
postretum purchasing history for each of our 1296 respon-dents
and queried the retailer's database to collect the same
contextual variables collected in the first study. Our
response rate from the initial mailing of the first T2 ques-
114/Journal of Marketing, September 2012
6. tionnaire to the completion of the T3 questionnaire was
47%. Customers were offered a $25 gift certificate to com-plete
the T2 and T3 surveys. (Only 23% of respondents in
Study 2 redeemed the gift certificate, and there were no sig-nificant
differences in redemption rates across fee and free
conditions ¡p > .10].) The sample exhibited the following
demographic characteristics: 48% were female, 36% were
36-55 years of age, and 62% held college degrees. In addi-tion,
the product return in this study represented the first
return recorded by the retailer for each respondent, allowing
for accurate tracking of customer perceptions regarding
their first return experience with the focal retailer.
Across both studies at both the prereturn 12- and 24-
month marks, we found no significant differences among
the free and fee groups in prereturn purchase rates, order
values, or value of returned products, nor were there signifi-cant
differences in the dollar amount of return shipping
across levels of attributions to retailer (all p> .10). Confir-matory
factor models indicated that our measures are psy-chometrically
sound in both studies regarding model fit,
discriminant validity, and internal consistency (see the
Appendix).
Checiis for Respondent and Measure Bias
To check for sample and nonresponse biases in each sample
using customer profile information in each of the retailers'
databases, we compared the demographic and buying pro-files
in our samples with three other customer groups: (1)
customers who returned products during our studies but did
not participate in the studies (i.e., nonparticipants; Study 1:
n - 285; Study 2: n = 1545), (2) customers who returned
products before our studies and did not receive our survey
(i.e., nonsurveyed returners; Study 1: n = 567; Study 2: n =
1780), and (3) customers who have never returned products
to the focal retailers (i.e., nonreturners; Study 1: n = 462;
Study 2: n = 1378). There were no significant differences
regarding the length of relationship with the retailers, age,
total number of purchases, or average order value between
the three other customer groups and our samples (/? > .10),
and they were similar across gender, income, and education.
Likewise, the reasons for returning and the retailer's prod-uct
return strategies were similar across groups. Other data
collection and analysis indicated that the three control
groups in each sample did not differ significantly from our
respondents' in customer spending {p > .10). In addition,
nonparticipants and nonsurveyed returners who did not pay
for return shipping significantly increased their customer
spending over the next two years, while nonparticipants and
nonsurveyed returners who paid for return shipping costs
significantly decreased their customer spending over the
next two years (i.e., a negative in customer spending; p <
.01). Nonparticipants and nonsurveyed returners with free
returns repurchased at significantly higher rates than nonre-turners,
and nonparticipants and nonsurveyed returners with
fee returns repurchased at significantly lower rates than
nonreturners {p < .01). Overall, these data checks suggest
that potential response and nonresponse biases in ratings
are minimal.
Resuits
The Roie of Attributions in Cost Fairness and
Customer Spending
We argue that the postreturn spending among customers
receiving a free return significantly increases from prereturn
spending, while the postreturn spending among customers
paying a fee return significantly decreases from prereturn
spending levels. Instead of simply examining the effects of
return shipping policies on changes in spending at the end
of the 24-month postreturn period, we examined the effects
at both the 12-month and 24-month postreturn points. Our
longitudinal research design enables us to determine whether
any changes in spending results in shorter-term effects (e.g.,
limited to 12 months but rebounding to prereturn levels by
24) or longer-term trends of postreturn spending.
Initial analyses contradicted some of the retailer
assumptions underlying equity-based return shipping poli-cies.
The correlations between retailer attributions and self-attributions,
though significant in both studies, are not "per-fect"
(Study 1: (|) = -.17; Study 2: ^ = -.14). This indicates
that attributions are empirically distinct (Fornell and Lar-cker
1981) and should be measured separately. Evidence
also contradicts the assumption that retailer assignments of
responsibility are consistent with consumer assignments.
Considering only Study l's results because of the retailer's
equity-based return shipping policy, customers making
stronger attributions to the retailer were required to pay
return shipping fees (n = 73; 46%) almost as frequently as
those who received a free return (n = 86; 54%), regardless
of self-attributions. Taking into account self-attributions,
among those customers who would meet the retailer's own
standards for a free return (i.e., stronger retailer attributions/
weaker self-attributions; n = 81), 43% were required to pay
a fee. Similarly, among those customers who would meet
the retailer's standards for a fee return (i.e., weaker retailer
attributions/stronger self-attributions; n = 105), 50% received
a free return. Similar proportions exist in Study 2, in which
return fee responsibility is unrelated to equity decisions and
instead is determined by the type of product purchased. In
other words, equity-based determinations of responsibility
were as consistent with customer judgments as determina-tions
entirely unrelated to assessments of equity decisions.
To test H] and H2, we estimated a repeated measures
general linear model with one categorical between-subjects
factor (return shipping policy outcome: free and fee), two
continuous between-subjects factors (retailer attributions
and self-attributions), one between-subjects dependent
variable (cost fairness), and one within-subject dependent
variable captured across four time intervals (customer
spending: TO, Tl, T4, and T5). We also modeled six covari-ates:
involvement, the dollar amount of return shipping
costs, the number of days to resolve the product return, the
number of days that passed after receiving the product
before the return was initiated, the length of the customers'
relationship with the retailer, and the order dollar amount.
Last, we included consumers' prepurchase awareness of
return shipping policy as a two-level blocking factor (i.e.,
yes or no).
Return Shipping Policies of Online Retailers /115
7. Return shipping policy awareness was significantly
related to cost faimess (Study 1: F(l, 319) = 22.96,/? < .01,
ri2 = .07; Study 2: F(l, 1281) = 57.62,p < .01,ri2 = .04) and
customer spending (Study 1: F(l, 319) = 38.78,p < .01,ri2 =
.11; Study 2: F(l, 1281) = 10.41,^1 < .01, rjZ = .01), and
therefore we retained it in the model (all other covariates
were nonsignificant and thus were eliminated). Across botb
studies, the two-way interaction (shipping policy x retailer
attribution) was significant for cost faimess (Study 1 : ß =
-.53, t(325) = 2.95,/? < .01, -pZ = .03; Study 2: ß = -.623,
t(l,287) := 4.60,p < .01, r|2 = .02). Likewise, the shipping
policy X retailer attribution was significant for customer
spending at both T4 (Study 1: ßT4 = 416.50, t(325) = 4.38,
ri2 = .06; Study 2: ßx4 = 1519.97, t(l,287) = 8.54, ri2 = .05,
p < .01) and T5 (Study 1: ßxs = 765.39, t(325) = 6.00, ^^ =
.10; Study 2: ^5 = 3026.40, t(l,287) = 11.96, ri2 = .10,p <
.01).
To explore Hj, we examined the slopes of retailer attri-bution
across fee and free retum shipping policies. Next, we
conducted a spotlight analysis (Fitzsimmons 2008; Irwin and
McClelland 2001) at one standard deviation above the mean
of retailer attribution (i.e., stronger retailer attributions) and
one standard deviation below the mean of retailer attribu-tion
(i.e., weaker retailer attributions) to explore the details
of the interaction. As we hypothesize, and as we show in
Figure 3, the drop in cost faimess from a free to a fee retum
was greater when customers more strongly blamed the firm
than when they expressed weaker retailer attributions
(Study 1: ß = .76, t(330) = 8.26; Study 2: ß = .82, t(l ,292) =
9.36, p < .01). Yet the drop in customer spending from a
FIGURE 3
Effects of Return Shipping Policy
A: Effects of Return Shipping Policy and Retailer Attributions on Cost Fairness
6.00
5.00
8 4.00 J
E
¡2 3.00 -i
o 2.00 -j
1.00 j
0 4
5.20
•l.SO
3.16
4.93
3.60
2.46
Free Return
Shipping
Fee Return
Shipping
Study 1 • Weaker retailer attribution
I I Stronger retailer attribution
Free Return Fee Return
Shipping Shipping
Study 2
B: Effects of Return Shipping Policy and Self-Attributions on Cost Fairness
5.68 5.60
3.24
2 30
Free Return Fee Return
Shipping Shipping
Study 1 I Weaker self-attribution
I Stronger self-attribution
Free Return Fee Return
Shipping Shipping
Study 2
Notes: Means for retailer attributions and self-attributions occur at one standard deviation below the grand mean (weaker) and one standard
deviation above the grand mean (stronger).
116 / Journal of Marketing, September 2012
8. free to a fee retum was more precipitous when customers
expressed weaker retailer attributions than when they more
strongly blamed the firm (Study 1: ß = 734.93, t(330) =
10.03,p < .01; Study 2: ß = 954.83, t(l,292) = 12.44,p <
.01). As such. Hi is partially supported (see Figure 4).
Regarding H2, the two-way interaction (shipping policy x
self-attribution) was significant in both studies for cost fair-ness
(Study 1: ß = -.392, t(325) = -2.19, p < .01, Ti2 = .02;
Study 2: ß = -.615, t(l,287) = 4.60, p < .01, Ti2 = .02). In
Study 1, the retum shipping policy x self-attribution inter-
FIGURE 4
Retailer Attributions and Changes in Customer Spending
A: Study 1
$1,400.00
$1,200.00
$1,000.00
$800.00
$600.00
$400.00
$200.00
$838.15
$177.43^
0''
$621.42
$235.36
»...
$1,258.57
^ „ . ^ $743.97
$109.54
-Ti $59.52
Free and weaker retailer attributions
Fee and weaker retaiier attributions
• Free and stronger retailer attributions
• Fee and stronger retailer attributions
24 Months
Prereturn
12 Months
Prereturn
12 Months
Postretum
24 Months
Postretum
B: Study 2
$6,000.00
$5,000.00
$4,000.00
$3,000.00
$2,000.00
$1,000.00
y'
.•'$3,363.97
. -"
'"'^ $1,964.04
.. $447.53
! 7 * 111
1
^ ^
_ $77.34
$5,013.05
$2,496.13
1 $0.00
Free and weaker retailer attributions
Fee and weaker retailer attributions
Free and stronger retailer attributions
Fee and stronger retailer attributions
24 Months
Prereturn
12 Months
Prereturn
12 Months
Postretum
24 Months
Postreturn
Notes: The means for weaker attributions are one standard deviation below the grand mean, and the means for stronger attributions are one
standard deviation above the grand mean.
Return Shipping Policies of Online Retaiiers /117
9. action was not significant for customer spending at both T4
(ßx4 = 147.46, t(325) =: 1.52, n.s.) and T5 (ßxs = 44.10,
t(325) = .34, n.s.). Yet the interaction was significant in Study
2 at both T4 (PT4 = 497.49, t(l ,287) = 2.70, ^^ = .01) and T5
(ßx5 = 679.24, t(l,287) = 2.59, ri2 = .01,p < .01). We con-ducted
a spotlight analysis at one standard deviation above
the mean of self-attribution (i.e., stronger self-attributions)
and one standard deviation below the mean of self-attribution
(i.e., weaker self-attributions) to explore the details of the
interaction. As we hypothesized, the drop in cost faimess
from a free to a fee retum was more precipitous when cus-tomers
more strongly blamed themselves than when they
expressed weaker self-attributions (Study 1: ß = .182,
t(330) = 7.43,p < .01; Study 2: ß = .741, t(l,292) = 9.34,p <
.01; see Figure 3). Similarly, in Study 2, the drop in cus-tomer
spending from a free to a fee retum was more precip-itous
when customers more strongly blamed themselves
than when they expressed weaker self-attributions (ß =
.985, t( 1,292) = 11.93, p < .01). Yet the spotlight analysis
was not significant in Study 1. Consistent with H2, cus-tomers
in both studies who experienced a free return
reported disproportionately higher cost faimess when they
made stronger self-attributions than when they made
weaker self-attributions (see Figure 3). In addition, cus-tomers
in Study 2 who experienced a free return reported
disproportionately higher increased spending when they
made stronger self-attributions than when they made
weaker self-attributions (see Figure 5). Thus, H2 is sup-ported
in Study 2 and partially supported in Study 1.
Regret
To test H3, we estimated another repeated measures general
linear model with one within-subject factor (time: T2 and
T3), one between-subjects factor (retum shipping policy
outcome: free and fee), one dependent variable (regret), the
six previously used covariates, and two additional covariates
(retailer attributions and self-attributions). In Study 1, retailer
attributions, self-attributions, and retum shipping policy
awareness were significantly related to regret (retailer: F( 1,
323) = 70.63,p< .01,112= .18; self: F(l, 323) = 5.00,p <
.03, ri2 = .02; awareness: F(l, 323) = 46.92, /? < .01, r|2 =
.13). Likewise, in Study 2, retailer attributions, self-attribu-tions,
and retum shipping policy awareness were signifi-cantly
related to regret (retailer: F(l, 1285) = 339.28, p <
.01, ri2 = .21; self: F(l, 1285) = 4.68, p < .03, ri2 = .01;
awareness: F(l, 1285) = 167.46,;? < .01,ri2 = .12; all other
covariates were nonsignificant and eliminated). Consistent
with H3, customers receiving free retums reported signifi-cant
decreases in postreturn regret from initial retum levels,
whereas customers receiving fee retums reported signifi-cant
increases in postretum regret from initial retum levels
(Study 1: F(l, 329) = 206.16, p < .0l,r2= .39; Study 2:
F(l, 1,291) = 661.39,p < .01,ri2 = .34; see Figure 6.)
Effects of Fairness and Regret on Long-Term
Customer Spending
One of the assumptions underlying equity-based return
shipping policies and/or our expectations is the positive
relationship between faimess (as per retailer and our expec-tations)
and customer spending, as well as the negative rela-tionship
between regret and customer spending. To assess
these assumptions, we first estimated longitudinal structural
models to assess the relationships of cost faimess and regret
on customer spending over time, as well as to note the
amount of variance explained in customer spending over
time.
To test H4, we examined whether regret (T3) mediates
the relationship between cost faimess (T2) and customer
spending (TO, Tl, T4, T5) in a manner consistent with
Baron and Kenny (1986). We examined four conditions for
mediation using structural equation modeling. The first con-dition
is satisfied if cost fairness affects the mediator
(regret). The second condition is satisfied if regret affects
the dependent variable (customer spending). We estimated a
mediated structural equation model testing the direct paths
from cost faimess —> regret —> customer spending. Both
these conditions were met, as this model yielded marginal fit
(Study 1:%^= 120.54,p < .01 ; comparative fit index (CFI) =
.97; Tucker-Lewis index (TLI) - .95; and root mean square
error of approximation (RMSEA) = .15; Study 2: ^2 =
371.18,p < .01; CFI = .96; TLI = .94; and RMSEA = .14).
Moreover, the completely standardized exogenous path
from cost faimess to regret (Study :j = -.73; Study 2:7 =
-.65) and the endogenous path from regret to customer
spending (Study 1: ß = .70; Study 2: ß = .74) were both sig-nificant
{p < .01).
The third condition is satisfied if cost faimess has a
direct effect on customer spending. Thus, we estimated a
direct model with only one direct path from cost faimess to
customer spending. The model fit the data well (Study 1: ^2 =
.56,p = .75; CFI = .99; TLI = .99; and RMSEA = .01 ; Study
2: %2 = 14.63,p < .01; CFI = .99; TLI = .99; and RMSEA =
.07), and the completely standardized path was significant
(Study 1: 7= .60; Study 2: y = .51,p < .01), satisfying the
third mediating condition.
The fourth mediating condition is satisfied if the direct
path from cost faimess to customer spending becomes non-significant
(i.e., full mediation) or reduced (partial media-tion)
when we included the mediated paths from cost fair-ness
-^ regret -^ customer spending in a full model (i.e.,
the mediated model). The fit of the mediated model was
better than the fit of the full model with the added exoge-nous
path from cost faimess to customer spending (Study 1:
5C2^iff = 107.33; Study 2: x^diff = 333.51; d.f. - l,p < .01).
Moreover, the completely standardized path estimate
between cost fairness and customer spending became non-significant
(Study 1: 7= .02; Study 2: 7= .04,p > .10), indi-cating
that regret fully mediates the effect of cost faimess
on customer spending. Moreover, the amount of variance
explained in customer spending was greater for the medi-ated
model (Study 1: R2 = .78; Study 2: R2 = .74) than for
the full (Study 1: R2 = .63; Study 2: R2 =: .61) or direct
(Study 1: R2 = .45; Study 2: R2 = .34) models, suggesting
that cost faimess is a better predictor of customer spending
when modeled as an indirect effect through regret. In sum-mary,
regret mediates the effect of cost fairness on customer
spending, in support of H4 in both studies.
To provide context to our findings, we conducted sev-eral
multigroup nested models in accordance with Neff
118 / Journal of Marketing, September 2012
10. FIGURE 5
Self-Attributions and Changes in Customer Spending
A: Study 1
$1,200.00
$1,000.00
$800.00
$600.00
$400.00
$200.00
• • Free and weaker self-attributions
• • Fee and weaker self-attributions
Free and stronger self-attributions
Fee and stronger self-attributions
24 Months
Frereturn
12 Months
Frereturn
12 Months
Fostreturn
24 Months
Fostreturn
B: Study 2
$4,000.00
$3,500.00
$3,000.00
$2,500.00
$2,000.00
$1,500.00
$1,000.00
$500.00
m. ii.iii.iiii
$3,787.55
$2,703.98 ,.-¡/^
/ ^ $2,624.03
/
"$298.79
$286.17 Ti».,,..^^
~"~-—„.,,^125^
$3,721.63
$45.58
Free and weaker self-attributions
Fee and weaker self-attributions
• Free and stronger self-attributions
• Fee and stronger self-attributions
24 Months
Frereturn
12 Months
Frereturn
12 Months
Postretum
24 Months
Postretum
Notes: The means for weaker attributions are one standard deviation below the grand mean, and the means for stronger attributions are one
standard deviation above the grand mean.
(1985) to examine whether the modeled parameter esti-mates
varied significantly across eight relevant customer
groups: 2 (retailer attributions: weaker and stronger) x 2
(self-attributions: weaker and stronger) x 2 (retum shipping
policy: free and fee). The chi-square tests across all nested
models indicated that the parameter estimates were stable
Return Shipping Policies of Online Retailers /119
11. FIGURE 6
Changes in Regret over Time
A: Study 1
4.53
3.48
o
Q.
UJ
perienced Regret
X
u
0-
6-
5-
4-
3-
2-
1 -
0-
Time of Return
•—' Free return
4.55 « ^
3.48 —B
Time of Return
" " • • Free return
(T2)
shipping •"•
B: Study
— " 1,1—
(T2)
shipping •—
Postreturn (T3)
•• Fee return shipping
2
mmmmma^«....^ - - —
Postreturn (T3)
"» Fee return shipping
Notes: iVIeans for retailer attributions and self-attributions occur at
one standard deviation below the grand mean (weaker) and
one standard deviation above the grand mean (stronger).
(i.e., not significantly different) across the eight subgroups
{p > .10), enhancing the predictive validity of the overall
model.
Discussion
Contrary to economic research suggesting that retailers
should toughen online return shipping policies, our studies
suggest that such strategies might be shortsighted and that
retailers should carefully consider how return shipping poli-cies
affect revenues. We conducted two event field studies
simultaneously over approximately 49 months to assess the
psychological and behavioral reactions of customers to
equity-based return shipping policies. Our expectations, as
refiected in Figure 2, were supported, indicating that retail-ers'
normative expectations (refiected in Figure 1) are
largely inconsistent with consumer responses. Contrary to
retailer assumptions, the actual return shipping policy cus-tomers
received (whether free or fee) largely determined
their postreturn spending regardless of attributions and cost
fairness. Both studies suggest that customers paying for
their own product returns will universally decrease their
repurchases and that those receiving free returns will uni-versally
increase their repurchases. In other words, the pri-mary
conclusion for retailers from the present research is
that in the interest of increased sales, it is beneficial to insti-tute
a free return shipping policy. At the very least, our
work is a call to online retailers to consult their own propri-etary
customer data to determine any effects of return ship-ping
costs on customer relationships and purchases.
The Dangers of Fee Return
This recommendation has the potential to elicit concerns
from retailers. Retailers have short-term motivations for
controlling return costs. As such, they may require cus-tomers
to absorb return shipping policies, so they can avoid
those costs themselves, or even induce consumers to keep
products they might otherwise return to maintain the profits
from the sale. Retailers may also be concerned with limiting
abusive returns. However, while retailers may be in control
of determining who pays for the return shipping costs, our
findings remind retailers that customers will have their own
independent perceptions of blame, affective reactions to
return fees, and, most importantly, ability to decide whether
they will repurchase from the retailer. Depending on attri-bution
condition, fee returns universally resulted in a
decrease in spending, ranging from 74.84% to 100% (see
Figures 4 and 5).
Our findings strongly contradict the assumptions made
by retailers that attempt to control or limit their own costs
by instituting equity-based return shipping policies. First,
retailers are particularly ineffective at categorizing blame in
a manner consistent with consumer perceptions. While a
properly executed equity-based return shipping policy
should have all retailer-blaming customers receiving free
returns, the retailer in Study 1 (which used such a policy)
assigned those customers free and fee returns in approxi-mately
equal proportions. Similarly, we found that the
retailer in Study 1 (which assigned fee returns using an
equity-based return shipping policy) was approximately as
consistent in assigning responsibility for the return to con-sumers
who held themselves and not the retailer responsible
as the retailer in Study 2, which used an entirely different
policy for assigning return fees.
Even if retailers made attributions of blame consistent
with customer perceptions, the consequences of fee returns
for retailers are still negative and profound. In a "perfect"
fee condition, in which consumers strongly blame them-selves
and hold weak attributions to the retailer, consumers
in Study 1 (in which the retailer used an equity-based return
shipping policy) still decreased their spending by 88%, and
those in Study 2 decreased their spending by 93%. We
found that customers appear to prefer advantageous or posi-tive
inequity, perceiving free returns to be fairer than fee
returns. In sharp contrast to the expectations of retailers, the
dominant effect of the valence of the return shipping policy
(fee/free) is not overcome by any combination of attribution
conditions.
One key reason for this result is that, contrary to the
expectations of retailers, the dominant response to product
return shipping policies is not equity but rather regret. Cus-
120 / Journal of Marketing, September 2012
12. tomers' negative emotions and sorrow related to retum
costs are the primary driver of postretum shipping and,
indeed, entirely explain equity's effect on postretum repur-chases.
Therefore, while equity played a role in postretum
spending, we found that it was only through customers'
feelings of regret.
Retailers may not be able to rely on the type of retum
shipping policies to cue consumer reactions to the policies.
Our research suggests that the type of retum shipping policy
heuristic used to determine the policy application (whether
equity-based or dependent on the type of product being
retumed) is largely irrelevant to how customers might react
to a fee or free outcome. Even though the two retailers in our
studies had two different metrics for determining whether
the customer received the fee or free retum shipping out-come,
one equity-based and one product-based, the conclu-sions
across both studies were (except for self-attribution
findings) similar. This finding suggests that cost faimess
considerations play a smaller role than regret in shaping
consumers' future repurchase decisions.
Retailers must also realize that consumers may not wam
a retailer if a fee return will result in a decrease in future
repurchases. The retailers in both our studies received no
formal complaints from fee returns, with these customers
quietly decreasing repurchases (and, in some cases,
sharply). While retailers implementing an equity-based
retum shipping policy may perceive the dearth of com-plaints
among fee retumers as support for such a policy,
analysis of the longer-term consequences of fee retums sug-gests
that a preferable option from a customer loyalty per-spective
is to simply offer all customers a free retum.
The Benefits of Free Returns
Offering free retums to consumers does not just help retail-ers
avoid the negative consequences of fee retums. Depend-ing
on the attribution condition, if customers received free
retums, postretum spending at that retailer was 158%-
457% of preretum spending by the end of two years (see
Figures 4 and 5). This is one of a few articles suggesting
that product retums and their associated frustrations and
costs for retailers are not "necessary evils" (to use Petersen
and Kumar's [2009] term). Wood (2001) suggests the value
to retailers of lenient retum policies, supporting the expec-tation
that after customers have taken possession of the
product they are also more likely to keep it. Anderson,
Hansen, and Simester (2009) assess the value to consumers
(and ultimately to retailers) of offering the retum option.
Furthermore, up to a given threshold, more retums result in
an increase in repurchases (Petersen and Kumar 2009). The
present research supports the assertion that reducing con-sumer
costs and decreasing the hurdles associated with
retums can increase the repurchases to retailers and result in
long-term benefits.
Some online retailers selling products with relatively
high return rates, such as shoes (e.g., Zappos.com), fashion
(e.g., Nordstrom.com), and luggage (e.g., ebags.com), have
already adopted free retum shipping policies (Spencer
2003). Indeed, the previous owner of Zappos.com indicated
the importance of free retums to get people to take a chance
on purchases (Rapbel 2004). In a related and developing
issue, online retailers are increasingly willing to offer free
(initial) shipping to customers to heighten the possibility of
an initial purchase, recognizing that the increase in sales
more than make up for the increase in costs (Zimmerman
and Mattioli 2011). Our findings indicate that beyond
avoiding the negative consequences of fee retums, there are
the substantial advantages to retailers of free retums.
While our studies were conducted in online settings, the
implications of our findings may generalize to other retailer
settings. These findings may also have implications for
brick-and-mortar retailers, when the retum of the product
entails a cost. Although restocking fees are often intended
to get customers to "think twice" about retums (Meyer
1999), they may actually limit future customer spending for
fear of future restocking fees. Finally, the products in Study
1 represented a wide cross-section of products from apparel
to housewares to decorative items (representing more than
200 stockkeeping units), whereas the products in the second
study were a wide variety of consumer electronics and
accessories (representing more than 800 stockkeeping
units). This diversity of the product categories represented
across both studies suggests that the implications of these
findings may generalize to retailers carrying a variety of
product types. Further research should determine whether
these findings generalize to retailers carrying a limited
depth or breadth of product line, particularly with regard to
the benefits of free retums. If a retailer has a limited variety
or depth of product, especially if it is a product that need
not be purchased frequently, rejoicing customers may only
be able to purchase so much, regardless of their lack of
anticipated regret. However, the advantages to the retailer
of a free retum may accrue to the retailer in other ways,
such as word of mouth (e.g., Oliver 1997).
The Original and Important Role of Regret
Consistent with the expectations of equity-based retum
shipping policies, perceptions of fairness are positively
related to postretum spending. However, the importance of
faimess is not consistent with retailer expectations. We
found that those perceptions of faimess are mediated by a
reaction unanticipated by retailers: regret. Consumers regret
purchasing from a company that has treated them unfairly,
which leads to a decrease in postretum repurchases. Consis-tent
with the ideas of Xia, Monroe, and Cox (2004), this
may be due to the consumer desire either to prevent future
inequities or possibly to balance the past inequity by not
repurchasing.
Beyond its mediating relationship with fairness is
regret's direct relationship with product return shipping
policies. Hess, Chu, and Gerstner (1996) normatively
assume that a rational consumer will judge nonrefundable
charges such as retum shipping costs to be sunk costs,
which should not play a role in subsequent decision mak-ing.
However, consistent with previous research (e.g.,
Simonson 1992), a past fee return serves to increase con-cems
regarding future fees stemming from a future pur-
Return Shipping Policies of Online Retailers /121
13. chase and failed product, and this anticipation serves as a
salient issue to customers in deciding whether they will pur-chase
again from a retailer (Petersen and Kumar 2009). The
dampening effect that these fees have on regret and ulti-mately
on postretum shipping are impressive. For example,
24.8% of fee respondents in Study 1 and 32.4% in Study 2
had dropped to zero revenue by the end of two years post-retum,
compared with 12% and 15% in the free retum
group.
Retailers appear to be underestimating the long-term
benefit of a free retum to the retailer itself. The sense of
rejoicing resulting from a free retum resulted in significant
postretum repurchases. Similar to the saying "What would
you do if you know you couldn't fail?" our respondents
appeared to have the philosophy "What would you buy if
you knew you wouldn't have to pay to retum it?" Sales
increases were impressive in both studies by the end of two
years postretum (Study 1: $620.80; Study 2: $2,552.68).
Our partial support for Hi may be a further indication of
the significance that regret plays in consumer reactions.
Equity theory (and our hypothesis) would predict that a fee
condition under strong retailer attribution conditions would
result in disproportionately lower postretum repurchase.
Although the interaction was significant, it was due to a dis-proportionate
increase in postretum spending resulting from
free retums received when consumers had weaker retailer
blame. Interpreted in light of regret theory, these consumers
may have rejoiced when they got a free retum from a
blameless retailer.
Aside from the practical managerial contributions of the
present research, there is also a significant theoretical con-tribution.
Both regret and equity are frequently discussed as
antecedents of satisfaction and future behavior (e.g., Cooke,
Meyvis, and Schwartz 2001; Lapidus and Pinkerton 1995;
Oliver 1997). However, there is limited research that
includes both constructs in the same discussion or analysis,
and the relationship between regret and equity is infre-quently
addressed. Chatterjee (2007) puts forth unsupported
expectations suggesting that regret might serve as an under-lying
mechanism in the relationship between next-purchase
coupons and perceptions of retailer faimess. In their devel-opment
of untested research propositions regarding con-sumer
reactions to unfair prices, Xia, Monroe, and Cox
(2004) argue that negative emotions, regret included, serve
as the primary driver of future action. To the best of our
knowledge, the present research represents the first tested
hypotheses of the relationships between faimess, regret, and
postpurchase behavior and, in particular, the first demon-stration
that regret mediates the effects of faimess on post-purchase
customer behavior. This finding suggests that cus-tomers
do not simply have negative affect as a result of
being treated unfairly but actually regret being treated
unfairly and are motivated to avoid inequitable treatment in
the future.
Appendix
Measures^
Experienced Regret (aT2 = -95, 073 = .96)
1.1 regret purchasing this product from (retailer name).
2.1 am feeling rejoiceful about buying this product from
(retailer name), (reverse-coded)
3.1 should not have purchased this product from (retailer name).
Cost Fairness (a = .96)
1. With respect to the retum shipping policy outcome, (retailer
name) handled the retum in a fair manner.
2.1 believe (retailer name) applies retum shipping policies
fairly when handling retums.
3. The final retum shipping policy outcome I received from
(retailer name) was unfair, (reverse-coded)
Pre- and Postreturn Customer Spending
l.Year 2 prereturn customer spending (TO): U.S. dollar
amount of annual purchases with (retailer name) from the
24 months preretum to 12 months preretum.
2. Year 1 prereturn customer spending (Tl): U.S. dollar
amount of annual purchases with (retailer name) from the
12 months preretum to the product retum event.
3. Year 1 postreturn customer spending (T4): U.S. dollar
amount of annual purchases with (retailer name) from the
retum event to 12 months postretum.
4. Year 2 postreturn customer spending (T5): U.S. dollar
amount of annual purchases with (retailer name) from 12
months postretum to 24 months postretum.
Retaiier Attributions (a = .99)
1. (Retailer name) is responsible for my need to retum this
product.
2. To what extent was (retailer name) responsible for the
return that you experienced? (1 = "not at all responsible,"
and 7 = "totally responsible")
3. To what extent do you blame (retailer name) for this retum?
(1 = "not at all," and 7 = "completely")
Seif-Attributions (a = .99)
1.1 am responsible for my need to retum this product.
2. The retum that I experienced was my fault.
3. To what extent do you blame yourself for this retum? (1 =
"not at all," and 7 = "completely")
'Unless noted, items were anchored by 1 = "strongly disagree"
and 7 = "strongly agree." Confirmatory factor measurement mod-els
across both studies indicate strong intemal consistency. The
average variance extracted between each pair of constructs is
greater than (j)2 (i.e., the squared correlation between two con-structs
[Fomell and Larcker 1981]), indicating strong discriminant
validity. Measurement model (Anderson and Gerbing 1988):
Study 1: X^ = 830.19, d.f. = 294, CFI = .96, TLI = .95, and
RMSEA = .07; Study 2: x^ = 3375.64, d.f. = 294, CFI = .95, TLI =
.92, and RMSEA = .08. a = average composite alpha reliability
estimate across both studies.
122 / Journal of Marketing, September 2012
14. Involvement (a = .85)
1. The purchase of this product was (1 = "very unimportant,"
and 7 = "very important").
2. With regard to the purchase of this product, how concerned
were you about the outcome? (1 = "very unconcerned," and
7 = "very concerned")
3. The purchase of this product (1 = "required very little
thought," and 7 = "required a lot of thought").
Return Shipping Poiicy Awareness
1. Were you aware of (retailer name)'s retum shipping policy
before completing your order? (1 = "no," and 2 = "yes")
REFERENCES
Anderson, Eric T., Karsten Hansen, and Duncan Simester (2009),
"The Option Value of Retums: Theory and Empirical Evi-dence,"
Marketing Science, 28 (3), 405-423.
Anderson, James C. and David W. Gerhing (1988), "Structural
Equation Modeling in Practice: A Review and Recommended
Two-Step Approach," Psychological Bulletin, 103 (3), 411-23.
Baron, Reuben M. and David A. Kenny (1986), "Moderator-
Mediator Variables Distinction in Social Psychological
Research: Conceptual, Strategic, and Statistical Considera-tions,"
Journal of Personality and Social Psychology, 51 (6),
1173-82.
Bassili, John N. and John P. Racine (1990), "On the Process Rela-tionship
Between Person and Situation Judgments in Attribu-tion,"
Journal of Personality and Social Psychology, 59 (5),
881-90.
Berger, Joseph, Thomas L. Conner, and M. Hamit Fisek (1974),
Expectation States Theory: A Theoretical Research Program.
Cambridge, MA: Winthrop Publishers.
Chatterjee, Patrali (2007), "Advertising Versus Unexpected Next
Purchase Coupons: Consumer Satisfaction, Perceptions of
Value, and Faimess," Journal of Product & Brand Manage-ment,
16(1), 59-69.
Cooke, Alan D.J., Tom Meyvis, and Alan Schwartz (2001),
"Avoiding Future Regret in Purchase-Timing Decisions," Jour-nal
of Consumer Research, 27 (March), 447-59.
Davis, Scott, Michael Hagerty, and Eitan Gerstner (1998), "Return
Policies and the Optimal Level of 'Hassle,'" Journal of Eco-nomics
and Business, 50 (5), 445-60.
Fitzsimmons, Gavan J. (2008), "Death to Dichotomizing," Journal
of Consumer Research, 35 (1), 5-8.
Folkes, Valerie S. (1984), "Consumer Reactions to Product Fail-ure:
An Attributional Approach," Journal of Consumer
Research, 10 (March), 398^09.
Fomell, Claes and David F. Larcker (1981), "Evaluating Structural
Equation Models with Unobservable Variables and Measure-ment
Effors," Journal of Marketing Research, 18 (February),
39-50.
Gilly, Mary C. and Betsy D. Gelb (1982), "Post-Purchase Con-sumer
Processes and the Complaining Consumer," Journal of
Consumer Research, 9 (December), 323-28.
Greenleaf, Eric A. (2004), "Reserves, Regret, and Rejoicing in
Open English Auctions," Journal of Consumer Research, 31
(September), 264-73.
Hess, James D., Wujin Chu, and Eitan Gerstner, (1996), "Control-ling
Product Retums in Direct Marketing," Marketing Letters,
7 (4), 307-317.
Homans, George Caspar (1961), Social Behavior: Its Elementary
Forms. New York: Harcourt, Brace & World.
Inman, J. Jeffrey, James S. Dyer, and Jianmin Jia (1997), "A Gen-eralized
Utility Model of Disappointment and Regret Effects
on Post-Choice Valuation," Marketing Science, 16 (2), 97-111.
and Leigh McAlister (1994), "Do Coupon Expiration Dates
Affect Consumer Behavior?" Journal of Marketing Research,
31 (August), 423-28.
Irwin, Julie R. and Gary H. McClelland (2001), "Misleading
Heuristics and Moderated Multiple Regression Models," Jour-nal
of Marketing Research, 38 (February), 100-109.
Johnson, Lee M., Rehan Mullick, and Charles L. Mulford (2002),
"General Versus Specific Victim Blaming," Journal of Social
Psychology, 142 (2), 249-63.
Kandra, Anne (2000), "Shipping Charges: Who Foots the Bill?"
PC World, 18 (9), 39.
Kelley, Scott W., K. Douglas Hoffman, and Mark A. Davis (1993),
"A Typology of Retail Failures and Recoveries," Journal of
Retailing, 69 (4), 429-52.
Krull, Douglas S. (2001), "On Partitioning the Fundamental Attri-bution
Error: Dispositionalism and Correspondence Bias," in
Cognitive Social Psychology: The Princeton Symposium on the
Legacy and Future of Social Psychology, Gordon B.
Moskowitz, ed. Hillsdale, NJ: Lawrence Erlbaum Associates,
211-27.
Landman, Janet (1987), "Regret and Elation Following Action and
Inaction," Personality and Social Psychology Bulletin, 13
(December), 524-36.
Lapidus, Richard S. and Lori Pinkerton (1995), "Customer Com-plaint
Situations: An Equity Theory Perspective," Psychology
& Marketing, 12 (2), 105-122.
Lemon, Katherine N., Tiffany Bamett White, and Russell S. Winer
(2002), "Dynamic Customer Relationship Management: Incor-porating
Future Consideration into the Service Retention Deci-sion,"
Journal of Marketing, 66 (January), 11-14.
Maxham, James G., Ill, and Richard G. Netemeyer (2003), "Firms
Reap What They Sow: The Effects of Shared Values and Per-ceived
Organizational Justice on Customer Evaluations of
Complaint Handling," Journal of Marketing, 67 (January),
46-62.
Meyer, Harvey (1999), "Many Happy Retums," Journal of Busi-ness
Strategy, 20 (4), 27-31.
Miller, Frederick D., Eliot R. Smith, and James Uleman (1981),
"Measurement and Interpretation of Situational and Disposi-tional
Attributes," Journal of Experimental Social Psychology,
17(1), 80-95.
Mollenkopf, Diana A., Elliot Rabinovich, Timothy M. Laseter, and
Kenneth K. Boyer (2007), "Managing Internet Product
Retums: A Focus on Effective Service Operations," Decision
Sciences, 38 (2), 215-50.
Neff, James A. (1985), "Race and Vulnerability to Stress: An
Examination of Differential Vulnerability," Journal of Person-ality
and Social Psychology, 49 (2), 481-91.
Nisbett, Richard E. and Lee Ross (1980), Human Inference:
Strategies and Shortcomings of Social Judgment. Englewood
Cliffs, NJ: Prentice-Hall.
Oliver, Richard L. (1997), Satisfaction: A Behavioral Perspective
on the Consumer. Boston: Richard D. Irwin/McGraw-Hill.
and John E. Swan (1989a), "Consumer Perceptions of
Interpersonal Equity and Satisfaction in Transactions: A Field
Survey Approach," Journal of Marketing, 53 (April), 21-35.
Return Shipping Policies of Online Retailers /123
15. and (1989b), "Equity and Disconfirmation Percep-tions
as Influences on Merchant and Product Satisfaction,"
Journal of Consumer Research, 16 (December), 372-83.
O'Shaughnessy, John and Nicholas Jackson O'Shaughnessy
(2005), "Considerations of Equity in Marketing and Nozick's
Decision-Value Model," Academy of Marketing Science
Review, 10, (published electronically), [available at http://
www.amsreview.org/articles/oshaughnessy 10-2005 .pdf].
Padmanabhan, V. and I.P.L. Png (1997), "Manufacturer's Retums
Policies and Retail Competition," Marketing Science, 16 (1),
81-94.
Pastemack, Barry Alan (2008), "Optimal Pricing and Return Poli-cies
for Perishable Commodities," Marketing Science, 27 (1),
133^0.
Petersen, J. Andrew and V. Kumar (2009), "Are Product Retums a
Necessary Evil? Antecedents and Consequences," Journal of
Marketing, 73 (May), 35-51.
Raphel, Murray (2004), "And Many Happy Retums," Art Business
News,31 (1),46.
Ratchford, Brian (1987), "New Insights About the FCB Grid,"
Journal of Advertising Research, 27 (4), 24-39.
Simonson, Itamar (1992), "The Influence of Anticipating Regret
and Responsibility on Purchase Decisions," Journal of Con-sumer
Behavior, 19 (June), 105-118.
Smith, Amy K., Ruth N. Bolton, and Janet Wagner (1999), "A
Model of Customer Satisfaction with Service Encounters
Involving Failure and Recovery," Journal of Marketing
Research, 36 (August), 356-73.
Solomon, Sheldon (1978), "Measuring Dispositional and Situa-tional
Attributions," Personality and Social Psychology Bul-letin,
4 (4), 5S9-94.
Spencer, Jane (2003), "'I Ordered ThatT Web Retailers Make It
Easier to Retum Goods," The Wall Street Journal, (September
4),D1-D2.
Swan, John E. and Richard L. Oliver (1991), "An Applied Analy-sis
of Buyer Equity Perceptions and Satisfaction with Automo-bile
Salespeople," Journal of Personal Selling & Sales Man-agement,
11 (2), 15-26.
Tax, Stephen S., Stephen W. Brown, and Murali Chandrashekaran
(1998), "Customer Evaluations of Service Complaint Experi-ences:
Implications for Relationship Marketing," Journal of
Marketing, 62 (April), 60-76.
Taylor, Shelley E. and Judith H. Koivumaki (1976), "The Percep-tion
of Self and Others: Acquaintanceship, Affect, and Actor-
Observer Differences," Journal of Personality and Social Psy-chology,
33 (4), 403^08.
Tsiros, Michael and Vikas Mittal (2000), "Regret: A Model of Its
Antecedents and Consequences in Consumer Decision Mak-ing,"
Journal of Consumer Research, 26 (March), 401^17.
Valle, Valerie and Melanie Wallendorf (1977), "Consumers' Attri-butions
of the Cause of Their Product Satisfaction and Dissat-isfaction,"
in Consumer Satisfaction, Dissatisfaction and Com-plaining
Behavior, Ralph L. Day, ed. Bloomington: Indiana
University, 26-30.
Verhoef, Peter C, Philip Hans Eranses, and Janny C. Hoekstra
(2001), "The Impaet of Satisfaction and Payment Equity on
Cross-Buying: A Dynamic Model for a Multi-Service Provider,"
Journal of Retailing, 11 (3), 359-78.
Vorhees, Clay M., Michael K. Brady, and David M. Horowitz
(2006), "A Voice from the Silent Masses: An Exploratory and
Comparative Analysis of Noncomplainers," Journal of the
Academy of Marketing Science, 34 (4), 514-27.
Walster, Elaine, Ellen Berscheid, and G. William Walster (1973),
"New Directions in Equity Research," Journal of Personality
and Social Psychology,25 (February), 151-76.
Weiner, Bernard (2000), "Attributional Thoughts About Consumer
Behavior," Journal of Consumer Research, 27 (December),
382-87.
White, Peter (1991), "Ambiguity in the Internal/External Distinc-tion
in Causal Attribution," Journal of Experimental Social
Psychology, 27 (3), 259-70.
Wolf, Alan (2012), "CE Retums Cost Industry $17B in 2011:
Report," Twice, 27 (1), 82.
Wood, Staey L. (2001), "Remote Purehase Environments: The
Influence of Retum Policy Leniency on Two-Stage Decision
Processes," Journal of Marketing Research, 38 (May), 157-69.
Xia, Lan, Kent B. Monroe, and Jennifer L. Cox (2004), "The Price
Is Unfair! A Conceptual Eramework of Price Eaimess Percep-tions,"
Journal of Marketing, 68 (October), 1-15.
Zeelenberg, Marcel, Wilco W. van Dijk, and Antony S.R.
Manstead (1998), "Reconsidering the Relation Between Regret
and Responsibility," Organizational Behavior and Human
Decision Processes, 74 (3), 254-72.
Zimmerman, Ann and Dana Mattioli (2011), "Ship Eree or Lose
Out: More Retailers Absorb Cost of Sending Packages to Vie
with Web-Only Rivals," The Wall Street Journal, (November
25),Bl.
124 / Journal of IVIarketing, September 2012
16. Copyright of Journal of Marketing is the property of American Marketing Association and its content may not
be copied or emailed to multiple sites or posted to a listserv without the copyright holder's express written
permission. However, users may print, download, or email articles for individual use.