Download to read offline

![stockouts in online Retailing
345
difficulty in assessing the relationship between CLV and
stockouts. The positive correlation between cumulative
spending and total stockouts suggests that service failures
increase retention. This positive relationship occurs because
customers with a high preference for the retailer tend to
order more often and therefore experience more stockouts.
From an analysis standpoint, the positive correlation means
that simple regression analyses of the relationship between
CLV and stockouts will yield incorrect results. Furthermore,
the correlations between stockout rate and the cumulative
buying measures are small (.055 and –.022). The lack of
correlation can occur for a variety of reasons and emphasizes the need for more detailed analyses.
EMPIRICAL ANALYSIS
The Modeling Approach
For the empirical analysis, we use Zhang and Krishnamurthy’s (2004) modeling approach to capture the consumer’s joint decision of purchase incidence and purchase
amount. First, we use a logit specification to model purchase incidence. The second component models the continuous nature of purchase amounts. The model also includes a
structure that captures the dependence between the two
dependent variables. (Zhang and Krishnamurthi [2004]
present the full development of the model.) We also use a
latent class method (Kamakura and Russell 1989) to
account for unobserved heterogeneity. The log-likelihood
(LL) function of this model is written as follows:
T
M
log
πm
Prm (I it = 0)1− Iit Prm (I it = 1, yit ) Iit ,
m =1
0
i =1
t = ti
N
(1) LL =
∑ ∑ ∏
To account for pricing effects, we construct an individuallevel discount index. TOTDISC is the average of the discounts available on the 50 top-selling items in each category
weighted by the customer’s category activity. This measure
is large when discounts are abundant and small when prices
are high.
In addition to product prices, customers also pay for shipping and handling. During the data collection period, the
retailer used four shipping fee structures (see Table 4).4 For
example, Schedule 1 charged $4.99 to ship an order of less
than $50, $6.97 to ship an order between $50 and $75, and
$0 to ship orders that exceed $75. Schedule 1 is unique
because it includes an order size incentive: The category for
the largest order size is assessed the lowest fee. Schedules 2
and 3 are increasing fee schedules that differ in terms of the
magnitude of the fees, such that Schedule 3 charges the low4The seller used the first shipping structure from Weeks 1–12, the second structure from Weeks 13–15, the third from Weeks 16–32 and Weeks
37–55, and the fourth from Weeks 33–36.
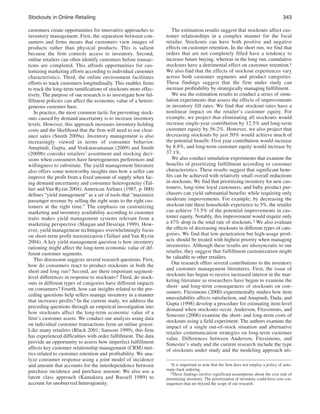
Table 3
keY VaRiaBle DeFiniTions
Variable Names
BABY
PET
TOTDISC
SH50W
SHSUR1
where
Prm (I it = 0) =
Pr( Iit = 1, y it ) =
SHSUR2
1
,
1 + eβ ′X it
(
( λ ′Z
)
2
− log y )
δ λ ′Z − log yit
eβ ′X it
δe
×
β ′X it
1+ e
δ
1 + e
(
it
it
it
δ λ ′Z − log yit
it
ρ
−1 + e
× 1 +
×
β ′X it
1+ e
δ λ ′Z − log y it
it
1+ e
(
)
)
RECENCY
RECSQ
NFREQ
FREQ
LMT
AMT
CORDERS
,
where pm is the proportion of latent type m customers in the
population, Iit is a binary variable that equals 1 if customer i
makes a purchase in week t and 0 if otherwise, Xit is a vector of independent variables that influence the purchase
incidence decision, yit is the observed purchase amount for
customer i in week t, and Zit is a vector of independent
variables that might affect the purchase amount decision.
CSTOCK
PSTOCK
PORDSHIPRAT
EARLYCUST
Definitions
1 if a household includes a baby and 0 if otherwise.
Inferred from initialization data.
1 if a household includes a pet and 0 if otherwise.
Inferred from initialization data.
Average category discount weighted by individual
customer’s category activity.
The shipping fee for orders lower than or equal to
$50.
The additional shipping penalty for orders higher
than $50 but lower than $75.
The additional shipping penalty for orders higher
than $75.
Time (in weeks) since the last order.
The square term of RECEN.
Weekly ordering rate (total orders divided by weeks
as a customer).
Weekly ordering rate (total orders divided by weeks
as a customer).
The log last purchase amount.
The log average purchase amount.
The cumulative number of transactions the customer
has made with the seller.
The cumulative number of stockouts the customer
has experienced during the transaction history.
1 if the customer experienced a stockout for the
previous order and 0 if otherwise.
The fill rate of the customer’s previous order.
Computed as the ratio between the shipped dollar
amount and the ordered dollar amount.
1 if the customer has made no more than two orders
and the time since customer acquisition is less than
six weeks.
Explanatory Variables
We use four categories of covariates in the model: pricing
and transaction fees, household demographics, household
transaction history measures, and stockout measures. Table
3 provides variable definitions.
Price and transaction fees. The scope of the retailer’s
product mix creates a challenge for including pricing effects
in the model. The retailer sells more than 14,000 distinct
products that are classified into several hundred categories.
Table 4
shiPPing Fees
Order Category
Structure 1
Structure 2
Structure 3
Structure 4
Small
($0–$50)
Medium
($50–$75)
Large
($75 Plus)
4.99
4.99
2.99
0
6.97
6.97
4.99
0
0
8.95
4.99
0](https://image.slidesharecdn.com/7-131107222144-phpapp01/85/7-4-320.jpg)
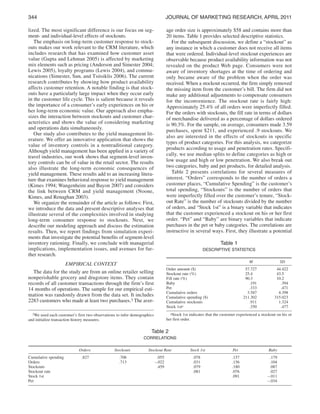
![stockouts in online Retailing
347
The two-segment model with interactions provides the
best fit in terms of BIC and yields intuitive parameter estimates. Table 6 provides the parameter estimates and the
standard errors for the two-segment model. There are some
elements that are similar across the two segments. For
example, the transaction history variables tend to operate
similarly across the two segments. However, we find a significant difference between how the two segments respond
to marketing instruments and stockouts.
Table 6
esTiMaTion ResUlTs
Segment 1
Coefficient
Purchase Incidence Parameters
INTERCEPT
–2.888***
BABY
.367**
PET
.178***
TOTDISC
.054*
SH50W
–.134**
SHSUR1
.117
SHSUR2
–.007
RECENCY/10
.345*
RECSQ/100
–.665***
FREQ
1.639***
LMT
.009
CORDERS/10
1.566***
CSTOCK_STAPLE
.01
CSTOCK_NICHE
–.165***
CSTOCK_VARIETY
–.031
CSTOCK_FILLIN
–.037
CSTOCK_PET
.066
CSTOCK_BABY
–.122*
PSTOCK_STAPLE
.031
PSTOCK_NICHE
.24**
PSTOCK_VARIETY
.176**
PSTOCK_FILLIN
.006
PSTOCK_PET
–.153
PSTOCK_BABY
.328**
CSTOCK ¥ EARLYCUST
–.417**
PSTOCK ¥ EARLYCUST
–.187*
Purchase Amount Parameters
INTERCEPT
2.396***
BABY
.035**
PET
–.005
TOTDISC
–.02**
SH50W
–.024
SHSUR1
.036
SHSUR2
–.003
RECENCY/10
.87***
RECSQ/100
–.446***
FREQ
.201***
AMT
.333***
CORDERS/10
.05**
CSTOCK_STAPLE
–.002
CSTOCK_NICHE
.03**
CSTOCK_VARIETY
–.03***
CSTOCK_FILLIN
.004
CSTOCK_PET
–.035**
CSTOCK_BABY
–.035**
PORDSHIPRAT
–2.3***
PORDSHIPRAT ¥ AMT
.552***
Scale (d)
4.344***
Correlation (q)
–2.711***
Segment size (w)
1.406***
SE
.158
.055
.042
.031
.065
.104
.022
.207
.174
.125
.029
.097
.036
.054
.04
.051
.054
.067
.074
.115
.081
.103
.132
.149
.199
.106
Segment 2
Coefficient
–1.965***
–.01
.266***
–.012
.059
–.362*
.04
.496***
–.132***
.959**
.044
.004
–.29**
.122
–.264*
–.318
–.481
–.633**
.232
–.29
.093
.212
.178
.131
.118
.218
SE
.375
.124
.083
.063
.136
.214
.049
.185
.037
.412
.05
.398
.138
.218
.154
.222
.363
.302
.165
.266
.176
.25
.366
.395
.514
.212
The estimation results indicate that the population is
composed of two segments of customers. Table 7 provides
descriptive statistics for the segments as determined by posterior probabilities. Segment 1 customers have higher order
rates and expenditures. As a result, they tend to experience
more stockouts. Table 7 also includes predicted retention
rates for each segment, calculated using a method Fader,
Hardie, and Lee (2005) propose. For both segments, the
retention rate is significantly lower when customers experience high stockout rates.
The impact of shipping fees differs for the two segments.
For Segment 1, which represents 80.3% of the total population, there is evidence that higher fees for smaller orders
reduce incidence. Shipping fees have a larger role for members of Segment 2. The incremental charge for mediumsized orders significantly decreases the rate of ordering. The
shipping fees also significantly affect Segment 2’s expenditures. The base shipping fee increases the average order
size, but the quantity surcharges (nonlinear pricing elements) result in significantly smaller orders. These findings
suggest that Segment 2 tends to be more responsive to shipping fee structures. In contrast, we find that TOTDISC has a
significant, positive effect on purchase incidence only for
Segment 1. This is a noteworthy pattern of findings because
the variables involve two elements of pricing: The TOTDISC measure involves prices over a large number of items,
whereas the shipping fees are single prices. The results suggest that members of the two segments emphasize different
elements of pricing information in their decision making.
The estimation results indicate that stockouts affect consumer behavior in several ways. We begin the discussion of
the stockout effects by considering Segment 1 and then
describe how Segment 2 differs. Table 6 indicates that
Table 7
segMenT DescRiPTions
M
.468
2.241*** .817
.017
.069
.05
.014
.056
.037
.01
–.017
.027
.019
.11**
.051
.031
–.155*
.084
.006
–.041**
.018
.075
.327*** .067
.061
–.059*** .015
.032
–.022
.135
.12
.414*
.232
.021
–.168
.135
.009
.089**
.045
.012
.131*
.072
.01
–.041
.049
.013
–.061
.065
.014
–.021
.099
.016
–.191*
.11
.475
–.692
.756
.122
.067
.238
.111
3.146*** .147
.253 –2.992** 1.142
.28
*p < .1.
**p < .05.
***p < .01.
Notes: We estimated the segment size parameter using a logit formulation such that p1 = exp(w)/[1 + exp(w)].
Overall
Total orders
Average order amount ($)
Total stockouts
Retention rate (%)
Retention rate of high-stockoutrate customers (%)
Retention rate of low-stockoutrate customers (%)
Segment 1
Total orders
Average order amount ($)
Total stockouts
Retention rate (%)
Retention rate of high-stockoutrate customers (%)
Retention rate of low-stockoutrate customers (%)
Segment 2
Total orders
Average order amount ($)
Total stockouts
Retention rate (%)
Retention rate of high-stockoutrate customers (%)
Retention rate of low-stockoutrate customers (%)
SD
3.587
55.585
.911
55.6
4.398
37.494
1.324
51.5
57.8
3.724
56.845
.97
56.3
5.020
39.029
1.473
51.4
58.9
3.281
52.789
.779
54.2
51.7
55.4
2.494
33.695
.895](https://image.slidesharecdn.com/7-131107222144-phpapp01/85/7-6-320.jpg)
![354
JoURnal oF MaRkeTing ReseaRch, aPRil 2011
vides two potential benefits. First, if retailers remove icons
associated with out-of-stock products, consumer demand is
censored. This can complicate future demand forecasting.
Second, explicit acknowledgment that an item is out of
stock at the time of ordering could lead to shopping cart
abandonment and perhaps long-term attrition. It is not clear
whether the attrition caused by product unavailability is
greater or less than the attrition caused by the type of stockout that we evaluated. Therefore, research that compares the
attrition rates from different types of stockouts would be
useful.
Hall, Joseph and Evan Porteus (2000), “Customer Service Competition in Capacitated Systems,” Manufacturing & Service
Operations Management, 2 (2), 144–65.
Hughes, Arthur (2000), Strategic Database Marketing, 2d ed. New
York: McGraw-Hill.
Hoch, Stephen J. (2002), “How Effective Is Category Management?” ECR Journal, 2 (1), 26.
Kamakura, Wagner and Gary Russell (1989), “A Probabilistic
Choice Model for Market Segmentation and Elasticity Structure,” Journal of Marketing Research, 26 (November), 379–90.
Khan, Romana, Michael Lewis, and Vishal Singh (2009),
“Dynamic Customer Management and the Value of One-to-One
Marketing,” Marketing Science, 28 (6), 1063–79.
Kimes, Sheryl (1994), “Perceived Fairness of Yield Management,”
Cornell Hotel and Restaurant Administration Quarterly, 35 (1),
22–29.
Lewis, Michael (2004), “The Influence of Loyalty Programs and
Short-Term Promotions on Customer Retention,” Journal of
Marketing Research, 41 (August), 281–92.
——— (2005), “Research Note: A Dynamic Programming
Approach to Customer Relationship Pricing,” Management Science, 51 (6), 986–94.
Noone, Breffni M., Sheryl E. Kimes, and Leo M. Renaghan
(2003), “Integrating Customer Relationship Management and
Revenue Management: A Hotel Perspective,” Journal of Revenue and Pricing Management, 2 (1), 7–21.
Porteus, Evan L. (2002), Foundations of Stochastic Inventory
Theory. Stanford, CA: Stanford Business Books.
Rust, Roland, Katherine Lemon, and Valarie Zeithaml (2004),
“Return on Marketing: Using Customer Equity to Focus Marketing Strategy,” Journal of Marketing, 68 (January), 109–127.
Sansoni, Silvia (1999), “Santa Flaws,” Forbes, (December 27),
[available at http://www.forbes.com/forbes/1999/1227/6415282a.
html].
Shugan, Steven and Ramarao Desiraju (1999), “Strategic Service
Pricing and Yield Management,” Journal of Marketing, 63 (January), 44–56.
Simester, Duncan, Peng Sun, and John Tsitsiklis (2006),
“Dynamic Catalog Mailing Policies,” Management Science, 52
(5), 683–96.
Smith, Stephen (2009a), “Clearance Pricing in Retail Chains,” in
Retail Supply Chain Management: Quantitative Models and
Empirical Studies, S. Smith and N. Agarwal, eds. New York:
Springer, 271–92.
——— (2009b), “Optimizing Retail Assortments for Diverse Customer Preferences,” in Retail Supply Chain Management: Quantitative Models and Empirical Studies, S. Smith and N. Agarwal,
eds. New York: Springer, 183–206.
Talluri, Kalyan and Garrett Van Ryzin (2004), The Theory and
Practice of Revenue Management. Boston: Kluwer Academic
Publishers.
Vasan, Srikant (2006), “Holes on the Shelf,” Grocery Headquarters, (April 10), [available at http://www.thefreelibrary.com/
Holes+on+the+shelf%3a+costly+stockouts+continue+to+plague+
retail+stores...-a0145516294].
Wangenheim, Florian v. and Tomas Bayon (2007), “Behavioral
Consequences of Overbooking Service Capacity,” Journal of
Marketing, 71 (October), 36–47.
Zhang, Jie and Lakshman Krishnamurthi (2004), “Customizing
Promotions in Online Stores,” Marketing Science, 23 (4),
561–78.
Zipkin, Paul (2000), Foundations of Inventory Management.
Boston: Richard D. Irwin/McGraw-Hill.
REFERENCES
Amato, Deena (2009), Taking Stock in OOS,” Chain Store Age,
(March), 38.
Andersen Consulting (1996), “Where to Look for Incremental
Sales Gains: The Retail Problem of Out-of-Stock Merchandise,”
working paper, The Coca-Cola Retailing Research Council,
Atlanta.
Anderson, Eric, Gavan Fitzsimons, and Duncan Simester (2006),
“Measuring and Mitigating the Costs of Stock-outs,” Management Science, 52 (11), 1751–63.
——— and Duncan Simester (2004), “Does Promotion Depth
Affect Long-Run Demand?” Marketing Science, 23 (4), 4–20.
Anupindi, Ravi, Maqbool Dada, and Sachin Gupta (1998), “Estimation of Consumer Demand with Stock-Out Based Substitution: An Application to Vending Machine Products,” Marketing
Science, 17 (4), 406–423.
———, Sachin Gupta, and Munirpallam A. Venkataramanan
(2009), “Managing Variety on the Retail Shelf: Using Household Scanner Panel Data to Rationalize Assortments,” in Retail
Supply Chain Management: Quantitative Models and Empirical
Studies, S. Smith and N. Agarwal, eds. New York: Springer,
155–82.
Belobaba, Peter (1989), “Application of Probabilistic Decision
Model to Airline Seat Inventory Control,” Operations Research,
37 (2), 183–97.
Black, Sam (2001), “E-Fulfillment Becoming a Priority for Retailers,” City Business, (April 13), 17.
Blattberg, Robert and John Deighton (1996), “Manage Marketing
by the Customer Equity,” Harvard Business Review,
(July–August), 136–44.
Dhar, Sanjay K., Stephen J. Hoch, and Nanda Kumar (2001),
“Effective Category Management Depends on the Role of the
Category,” Journal of Retailing, 77 (2), 165–84.
Fader, Peter, Bruce Hardie, and Ka Lok Lee (2005), “Counting
Your Customers the Easy Way: An Alternative to the Pareto/
NBD Model,” Marketing Science, 24 (2), 275–84.
——— and Leonard Lodish (1990), “A Cross-Category Analysis
of Category Structure and Promotional Activity for Grocery
Products,” Journal of Marketing, 54 (October), 52–65.
Fitzsimons, Gavin (2000), “Consumer Response to Stock-outs,”
Journal of Consumer Research, 27 (2), 249–66.
Gaur, Vishal and Young-Hoon Park (2007), “Asymmetric Consumer Learning and Inventory Competition,” Management Science, 53 (2), 227–40.
Griswold, Mike (2006), “Out of Stock,” Forbes, (December 14),
[available at http://www.forbes.com/2006/12/14/amr-supplystock-biz-logistics-cx_mg_1214stock.html].
Grocery Manufacturers of America (2002), “Full-Shelf Satisfaction: Reducing Out-of-Stocks in the Grocery Channel: An InDepth Look at DSD Categories,” report, Roland Berger Strategy
Consultants and Grocery Manufacturers of America.
Gupta, Sunil and Donald Lehmann (2005), Managing Customers
as Investments: The Strategic Value of Customers in the Long
Run. Philadelphia: Wharton School Publishing.](https://image.slidesharecdn.com/7-131107222144-phpapp01/85/7-13-320.jpg)


This study examines how inventory shortages or stockouts affect customer purchase behavior and a retailer's profitability using data from an online grocer. The three main objectives are: 1) To empirically investigate the short-term and long-term impact of stockouts on customer purchase behavior. 2) To study how customer responses to stockouts differ across customer segments. 3) To analyze how the impact of stockouts varies across product categories. The findings suggest stockouts have a complex, nonlinear effect on customer relationships and retailer profitability. Small decreases in stockout rates can achieve much of the potential benefit of eliminating stockouts entirely. Prioritizing inventory to reduce stockouts for key customer segments and product categories can


