2. 16 million rural users. “Four out of five Internet users ‘shop’ online, translating into a
50 million strong online consumer base. About 17 million of these ‘online shoppers’
(or 29% of all Internet users) also ‘buy’ online, recording a growth of 70% from 10
million last year. Online buyers of ‘non-travel’ products stand at 13.5 million,
outnumbering 8.6 million travel buyers”, the study quoted.
Google continues to dominate the online landscape, with Google, Gmail, Gtalk and
YouTube being the most used websites for 19 distinct online activities (compared to 24
activities last year). Facebook emerges as the leader in six distinct verticals, including
online games and professional networking. For the rest of the verticals, it is the ‘specialized’
players who lead or dominate user preferences like Naukri, IRCTC, eBay, 99Acres,
MoneyControl, ShareKhan, Bharat Matrimony, Torentz, Songs.pk and ESPNStar.
Online travel industry grew from 6,250 cr in 2007 to 14,953 in 2009.
e-Tailing comprises buying consumer items such as cameras, computers, home and kitchen
appliances, flowers and toys and gifts online. This category grew from 978 cr in 2007
to 1,550 in 2009. At present, PCs, laptops, computer peripherals, accessories and
storage contribute the most, 36% ( 560 cr), to e-tailing, followed by cameras and mobiles
contributing 25% ( 389 cr). Personal items such as jewelry, apparels, cosmetics, shoes
and watches contribute 19% ( 296 cr), whereas electronic items like TV, audio systems
and other accessories account for 13% ( 203 cr). The balance 7% was contributed by
home and kitchen appliances (4%) and other online buying (toys, gifts, flowers, etc.).
Financial services market, estimated to be 1,540 cr, was expected to grow to 2,000 cr
in the year 2010. Digital downloads as a category has increased from 238 cr in 2007
to 435 cr in 2009. Given the proliferation of mobile devices and the services available
over the Internet, the growth rate is expected to be higher in the coming years.
Literature Review
Hoffman and Novak (1997) pointed out that personalization is the essence by which
Internet firms valorize the Internet as a unique consumer market. Apart from the above,
there are several studies which reveal that people’s behavior online is influenced by
high-speed connection. Know and Lee (2003) explored consumers’ concerns about
payment security and its relationship to online shopping attitude and actual purchases.
They observed a negative relationship between attitude towards online shopping and
concerns about online payment security. Consumers with a positive attitude seem to be
less concerned about payment security.
Kotler and Armstrong (2000) pointed out that a person’s buying choices are further
influenced by four key psychological factors: (1) Motivation; (2) Perception; (3) Learning
and beliefs; and (4) Attitude. In most families, women are the chief decision makers
(Dholakia, 1999). Men are more motivated toward utilitarian benefits of products and
give lesser importance to social relations and personal contacts (Steenkamp et al., 1999).
Younger generation has always exhibited a positive disposition towards adoption of a
new innovation (Schiffman and Kanuk, 2003) and understands the technological changes
and complexities optimistically than the elderly segment (Wotruba and Pribova, 1995).
52 The IUP Journal of Marketing Management, Vol. XI, No. 4, 2012
3. Gurvinder and Zhaobin (2005) found that website design, website reliability/
fulfillment, website customer service and website security/privacy are the four dominant
factors which influence consumer perceptions of online purchasing. The four types of
online New Zealand buyers—trial, occasional, frequent and regular—perceived the four
website factors differently. This paper has been taken as a basis for this study and the
scale constructed for the study was partially adapted from this paper.
Rationale
The usage of Internet-aided services is highly increasing in India and technology has
played a vital role in the development of modern era. It is observed that the number of
Internet users is increasing in India at a steady rate. From a review of literature, it is
perceived that no research had been done to understand the perception of people of
Ahmedabad city towards online shopping. Hence, this study aims to explore the behavior
of people of Ahmedabad towards online shopping.
Objectives of the Study
The present study focuses on online shopping in the Indian sector to explore its trends,
prospects and challenges with the following objectives.
• To determine the factors driving online shopping; and
• To analyze the relationship between the factors brought out from the study
and the different types of buyers.
Hypotheses for the Study
The following hypotheses have been formulated for the study.
Ho: Attributes are uncorrelated with the population.
Ho: There is no significanct relationship between factors driving online shopping and
different types of buyers:
• There is no significant relationship between website ease/attractiveness and the
different types of buyers.
• There is no significant relationship between website service quality and different
types of buyers.
• There is no significant relationship between website security and different types of
buyers.
Research Methodology
The data was collected through a questionnaire (refer Appendix). The questionnaire
included several scales which were continuous and categorical in nature. The first question
comprised the number of times people opted for online shopping in the past year, which
talks about different types of buyers.
Factors Influencing Online Shopping: An Empirical Study in Ahmedabad 53
4. • 1-2 times: Trial buyers (people who rarely shop online).
• 2-4 times: Occasional buyers (people who sometimes shop online).
• 5-10 times: Frequent buyers (people who often shop online).
• More than 10 times: Regular buyers (people who regularly shop online).
For this study, the scale constructed by Gurvinder and Zhaobin (2005) was used
which comprised 15 Likert scale statements. In addition, three statements were added
on the basis of exploratory research. The questionnaire was first pre-tested and the
reliability was worked out on 10 respondents who
had knowledge of online buying, and the Cronbach’s
achieved was 0.754 (Table 1). Any value of
Cronbach’s above 0.6 shows that the scale is
reliable. Additionally, content validity was also done
for the same scale on SPSS 17.
Table 1: Reliability Statistics
Cronbach’s No. of
Items
0.754 18
The final study involved a web-based survey conducted in Ahmedabad city. The
sampling technique used was non-probability based convenient sampling. The sample
size for the study was calculated on the basis of the following formula:
2 * * 1
Z p p
2
c
Sample size
where
Z = Z-value (e.g., 1.96 for 95% confidence level).
p = Percentage picking a choice, expressed as decimal
(0.5 used for sample size needed).
c = Confidence interval, expressed as decimal = 7%.
Sample Size = 196 respondents for questionnaire.
Multivariate analysis like factor analysis along with other tests—chi-square, descriptive
statistics and Analysis of Variance (ANOVA)—have been used to analyze the data.
Data Analysis
Table 2 shows the demographics of the respondents for the survey:
• Online shopping was considered good and time saving by more male (73%)
than female (27%) consumers.
• Online shopping was most preferred by the youth in the age group of 21-30 years
(78.5%), and least by consumers in the age group of more than 40 years (7%).
• Online shopping was considered good and time saving most by postgraduates
(45%) and least by undergraduate consumers (17%).
54 The IUP Journal of Marketing Management, Vol. XI, No. 4, 2012
5. Table 2: Demographics of the Respondents for the Survey
Categories Count Percentage
Gender Male 146 73
Female 54 27
21-30 157 78.5
Age 31-40 29 14.5
>40 14 7.0
Undergraduate 34 17
Education Level Graduate 76 38
Postgraduate 90 45
Service Employed 92 46
Occupation Self Employed 17 8.5
Professional/Business 91 45.5
Non-Working/Studying/
Working Part-Time
15,000< 62 31
Monthly Income 15,000-30,000 69 34.5
30,000-45,000 40 20
>45,000 29 14.5
• Online shopping was preferred more by service employed and students (92%
and 91% respectively), compared to self-employed consumers (17%).
• Online shopping was considered good and time saving as well as money saving
by all income categories, except the last premium category. Therefore, very less
differences were found in this category.
Testing of Hypotheses 1
Ho: Attributes are uncorrelated with the population.
H1: Attributes are correlated with the population.
The findings of the data analysis are discussed, and are instrumental in gaining an
insight into online shoppers’ behavior. In order to identify the key factors which affect
online buying behavior (H1), exploratory factor analysis was performed and the results
are shown in Table 3.
Kaiser-Meyer-Olkin (KMO) Measure of Sampling Adequacy
The KMO measure of sampling adequacy is an index used to examine the appropriateness
of factor analysis. High values (between 0.6 and 1.0) indicate factor analysis is
appropriate. Values below 0.6 imply that factor analysis may not be appropriate.
Factors Influencing Online Shopping: An Empirical Study in Ahmedabad 55
6. Table 3: KMO and Bartlett’s Test
Kaiser-Meyer-Olkin Measure of Sampling Adequacy 0.903
Bartlett’s Test of Sphericity Approx. Chi-Square 1957.166
Df 153
Sig. 0.000
For our factor analysis, the KMO measure of sampling adequacy = 0.903, which is
much greater than the permissible value of 0.6. This also signifies that the scales of all
the variables of the questionnaire were properly understood by all the respondents and
they have correctly answered to the scale. Additionally, the Bartlett’s test of sphericity
has a high Chi-square value and the significance is 0.000, which is less than 0.05.
Hence the null hypotheses is rejected and H1 is accepted, as the factors are correlated
with each other.
In order to identify the underlying dimensions in the perceptions of the online
purchasers regarding the websites they shopped recently, an exploratory factor analysis
was employed. The respondents were asked to rate 18 website variables using a 5-point
Likert scale, which ranged from ‘strongly disagree’ to ‘strongly agree’. The inter-item
consistency reliability of these 18 variables was tested before factor analysis was carried
out. The result for Cronbach’s Alpha test was 0.903, and no item deletion significantly
increased the result. The closer the reliability coefficient gets to the value of 1.0, the
better is the reliability of the measures (Cronbach, 1951). This scale can be considered
to be good. Moreover, the results of both the KMO and Bartlett’s test of sphericity, i.e.,
significance value = 0.000, also indicate that it was appropriate to apply the exploratory
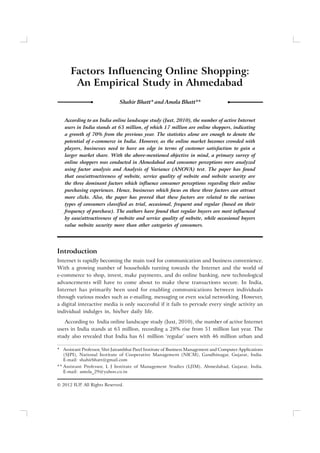
factor analysis techniques to this dataset. As shown in the scree plot diagram (Figure 1)
with principal components analysis and an eigenvalue of more than 1.00 as the deciding
criterion, the number of factors was decided.
Figure 1: Scree Plot
10
8
6
4
2
0
Eigenvalues
1 2 3 4 5 6 7 8 9 10 11 12 13 14 15 16 17 18
Component Number
56 The IUP Journal of Marketing Management, Vol. XI, No. 4, 2012
7. Scree Plot
A scree plot is a plot of the eigenvalues against the number of factors in the order of
extraction. As shown in Figure 1, it indicates that there are three factors which have
eigenvalues greater than one based on all the 18 variables.
Table 4 shows the factor analysis of the 18 variables which online buyers used to
measure the quality of websites most recently visited. This factor analysis extracted
three factors from the 18 variables. Each factor was defined by at least three scale items.
Depending upon the characteristics of each variable associated with three factors, they
are further given names. These three factors are termed as: ease/attractiveness of the
website, service quality of the website and security (Table 5).
Component
1 2 3
Table 4: Factor Analysis
S. Variable
No.
1. The website provides in-depth information 0.733 0.240 0.169
about products.
2. It is quick and easy to complete a transaction 0.780 0.248 0.235
through online shopping.
3. Online shopping has good collection. 0.619 0.422 0.211
4. Online shopping takes less time during transaction. 0.810 0.230 0.129
5. Online shopping has competitive prices and sometimes 0.055 0.251 0.781
offers discounts.
6. A variety of products are offered with good discount. 0.713 0.333 –0.059
7. I feel comfortable while surfing the Internet for online 0.217 0.740 –0.118
shopping.
8. The product that came was represented accurately by 0.474 0.662 –0.096
the website and was of good quality.
9. One gets whatever he/she ordered from online 0.818 0.204 0.057
shopping.
10. The product is delivered within the time promised by 0.739 0.293 0.130
the company.
11. The company is willing and ready to respond to 0.218 0.732 0.048
customer needs.
12. When you have a problem, the website shows 0.603 0.414 0.156
a sincere interest in solving it.
13. Online shopping is secure. 0.754 0.334 0.146
14. Online shopping maintains privacy. 0.180 –0.075 0.862
15. I feel my credit card information is not secure. 0.196 –0.175 0.821
16. Inquiries are answered promptly during online transaction. 0.282 0.605 –0.115
Factors Influencing Online Shopping: An Empirical Study in Ahmedabad 57
8. Component
1 2 3
Table 4 (Cont.)
S. Variable
No.
17. Website always offers good discounts. 0.414 0.568 0.161
18. Website understands my needs properly. 0.314 0.625 0.233
Note: Extraction method: Principal Component Analysis; Rotation Method: Varimax with Kaiser
Normalization; a Rotation converged in six iterations.
Table 5: Rotated Component Matrix
Factor Loadings Comm-unality
Factor 1 Factor 2 Factor 3
Factor 1: Ease/Attractiveness of Website
1. The website provides in-depth
information about products. 0.733 0.624
2. It is quick and easy to complete a 0.780 0.725
transaction through online shopping.
3. Online shopping has a good collection. 0.619 0.607
4. Online shopping takes less time during 0.810 0.725
transaction.
5. A variety of products are offered with 0.713 0.623
good discounts.
6. One gets whatever he/she orders 0.818 0.714
through online shopping.
7. The product is delivered by the time 0.739 0.649
promised by the company.
8. When you have a problem, the website 0.603 0.559
shows a sincere interest in solving it.
9. Online shopping is secure. 0.754 0.701
Factor 2: Service Quality of Website
10. I feel comfortable while surfing the 0.740 0.559
Internet for online shopping.
11. The product that came was represented 0.662 0.701
accurately by the website and was of
good quality.
12. The company is willing and ready to 0.732 0.586
respond to customer needs.
13. Inquiries are answered promptly during online 0.605 0.459
transaction.
58 The IUP Journal of Marketing Management, Vol. XI, No. 4, 2012
9. Factor Loadings Comm-unality
Table 5 (Cont.)
Factor 1 Factor 2 Factor 3
14. Website always offers good discounts. 0.568 0.519
15. Website understand my needs properly. 0.625 0.543
Factor 3: Website Security
16. Online shopping has competitive prices 0.781 0.677
and sometimes offers discounts.
17. Online shopping maintains privacy. 0.862 0.781
18. I feel my credit card information is not 0.821 0.743
secure.
Note: Extraction Method: Principal Component Analysis; Rotation Method: Varimax with Kaiser
Normalization; a Rotation converged in six iterations.
Interpretation
Factor 1 loaded on the first nine variables. This factor can be labeled as ‘ease/attractiveness
of website’, as these nine variables revealed the perceptions of online buyers related to the
components of the user-friendly experiences; that is, ease of navigation, on-time delivery,
download speed, surfing ambience, speed of checkout, order processing, merchandise
assortment, sufficient and useful information. All these elements were considered as the
predominant predictors of online consumers’ purchasing decisions.
Factor 2 correlated most highly with variables 10, 11, 12, 13, 14 and 15, i.e., on-time
delivery, quality, company’s response, prompt response to e-mail inquiries, comfort,
product exactness and whether the products or services received corresponded to those
described on the websites. It might be labeled as service quality of website. This category’s
results indicated that it is important to convince buyers that e-retailers can fulfill their
promises, as online consumers cannot obtain promises from salespersons as in traditional
shops.
Factor 3 might be labeled ‘website security/privacy’. It indicated that security and
privacy uncertainty were the two main issues for those considering purchasing online
and includes variables 16, 17 and 18. It includes website security features like credit
card information and privacy, and price advantage.
Table 6: Reliability Statistics
Cronbach’s Alpha No. of Items
Factor 1 – Ease/Attractiveness of Website 0.930 9
Factor 2 – Service Quality of Website 0.848 6
Factor 3 – Security to Consumers 0.815 3
Factors Influencing Online Shopping: An Empirical Study in Ahmedabad 59
10. Further, the reliability statistics (Table 6) indicate that the results for Cronbach’s
alpha test were 0.930, 0.848 and 0.815 for all the three factors with respect to their
variables and are above the permissible value of 0.5, and no item deletion significantly
increased the result. The closer the reliability coefficient gets to the value of 1.0, the better
is the reliability of the measure (Cronbach, 1951). This scale can be considered good.
Hypotheses 2
H0: There is no significant relationship between factors driving online shopping and different
types of buyers.
• There is no significant relationship between website ease/attractiveness and the
different types of buyers.
• There is no significant relationship between website service quality and different
types of buyers.
• There is no significant relationship between website security and different types of
buyers.
H1: There is significant relationship between factors driving online shopping and different
types of buyers.
• There is significant relationship between website ease / attractiveness and the
different types of buyers.
• There is significant relationship between website service quality and different types
of buyers.
• There is significant relationship between website security and different types of
buyers.
For testing these hypotheses, ANOVA test was conducted and the results are shown
in Table 7.
Table 7: ANOVA
Sum of Mean
Squares df Square F Sig.
Website Ease/ Between 24.835 3 8.278 12.647 0.000
Attractiveness Groups
Within 124.368 190 0.655
Groups
Total 149.204 193
Website Service Between 21.637 3 7.212 13.506 0.000
Quality Groups
Within 100.928 189 0.534
Groups
Total 122.565 192
60 The IUP Journal of Marketing Management, Vol. XI, No. 4, 2012
11. Table 7 (Cont.)
Sum of Mean
Squares df Square F Sig.
Website Security Between 12.734 3 4.245 4.078 0.008
Groups
Within 196.707 189 1.041
Groups
Total 209.440 192
Interpretation
All the three factors have a significance value of 0.000, 0.000 and 0.008, respectively,
which is less than 0.05, and therefore, the null hypotheses is rejected and H2 is accepted
as there is relationship between the factors, viz., website design/attractiveness, website
service quality and website security, and the different types of buyers, viz., trial,
occasional, frequent and regular buyers. Looking at the descriptive statistics (Table 8),
it can be stated that regular buyers are most influenced by ease/attractiveness of website
and service quality of website, while occasional buyers value website security more than
other categories of consumers. Frequent and occasional buyers are almost parallel and
medium in their choice of factors affecting their shopping behavior. Trial buyers have
limited online shopping experience, which is also evident from the analysis, as their
mean values are the lowest in all the three dominant factors.
Table 8: Descriptive Statistics
N Mean SD Std.
5% Confidence
Level of Mean
Error Lower Upper
Bound Bound
Min. Max.
Website Ease/Attractiveness
1-2 times (Trial) 84 3.15 0.991 0.108 2.94 3.37 1 5
2-4 times (Occas.) 54 3.74 0.565 0.077 3.59 3.89 2 5
5-10 times (Freq) 33 3.75 0.725 0.126 3.50 4.01 1 5
>10 times (Reg.) 23 4.14 0.644 0.134 3.87 4.42 3 5
Total 194 3.53 0.879 0.063 3.41 3.66 1 5
Website Service Quality
1-2 times (Trial) 83 2.76 0.812 0.089 2.58 2.93 1 5
2-4 times (Occas.) 54 3.26 0.677 0.092 3.07 3.44 2 5
5-10 times (Freq.) 33 3.32 0.515 0.090 3.14 3.51 2 5
>10 times (Reg.) 23 3.72 0.800 0.167 3.37 4.06 2 5
Total 193 3.11 0.799 0.058 2.99 3.22 1 5
Factors Influencing Online Shopping: An Empirical Study in Ahmedabad 61
12. Table 8 (Cont.)
N Mean SD
5% Confidence
Level of Mean
Std.
Error Lower Upper
Bound Bound
Min. Max.
Website Security
1-2 times (Trial) 83 2.86 0.970 0.106 2.65 3.08 1 5
2-4 times (Occas.) 54 3.47 0.862 0.117 3.23 3.70 1 5
5-10 times (Freq.) 33 3.03 1.138 0.198 2.63 3.43 1 5
>10 times (Reg.) 23 2.90 1.327 0.277 2.32 3.47 1 5
Total 193 3.06 1.044 0.075 2.92 3.21 1 5
Conclusion
The current shift from ‘brick and mortar’ business to ‘click and mortar’ business is
attracting many budding entrepreneurs due to the apparent benefits like low capital
investment, no geographical restrictions, ease of capturing global markets and less
operational issues. However, as the online market becomes competitive, differentiation
needs to become an integral part of operations. For achieving this, e-businesses need to
know the underlying factors of consumer satisfaction in online purchasing experiences.
This research has found that ease/attractiveness of website, service quality of website
and website security are the three dominant factors which influence consumer perceptions
of their online purchasing experiences.
In addition to this, to help businesses identify which factors are important to cater
to a particular segment of consumers, the research has found that a relationship exists
between the type of consumer and dominant factors driving online shopping. The
consumers are categorized as trial, occasional, frequent and regular, based on their
frequency of online shopping, and their preferences for each of the factors have been
captured. Research proves that regular buyers are most influenced by ease/attractiveness
of website and service quality of website, while occasional buyers value website security
more than other categories of consumers.
Hence, in order to get an edge over other players in e-markets, businesses need to
focus and improve upon features like ease/attractiveness of website, service quality of
website and website security. Moreover, there is scope for designing customized
promotional strategies based on the relationship of these factors to various categories of
online shoppers based on their frequency of purchase.
Limitations of the Study: The study was conducted based on the data acquired from
the online buyers of Ahmedabad only, and the findings may not be applicable to other
countries of the world because of sociocultural differences. The sample size is very small.
The researchers conducted the survey through the Internet, and no personal interviews
or scheduled interviews were undertaken to get the questionnaire filled.J
62 The IUP Journal of Marketing Management, Vol. XI, No. 4, 2012
13. Bibliography
1. Changchit C (2006), “Consumer Perceptions of Online Shopping”, Issues in
Information Systems, Vol. 7, No. 2, pp. 177-181, available at http://iacis.org/iis/
2006/Changchit.pdf
2. Cronbach L (1951), “Coefficient Alpha and the Internal Structure of Tests”,
Psychometrika, Vol. 16, No. 3, pp. 297-334.
3. Dholakia R (1999), “Going Shopping: Key Determinants of Shopping Behaviours
and Motivations”, International Journal of Retail and Distribution Management,
Vol. 27, No. 4, pp. 154-165.
4. Gurvinder S S and Zhaobin C (2005), “Web-Based Shopping: Consumers’
Attitudes Towards Online Shopping in New Zealand”, Journal of Electronic Commerce
Research, Vol. 6, No. 2, pp. 79-94, available at http://www.csulb.edu/journals/
jecr/issues/20052/paper1.pdf
5. Hoffman D and Novak T (1997), “A New Marketing Paradigm for Electronic
Commerce”, The Information Society, Special Issue on Electronic Commerce, Vol. 13,
January-March, pp. 43-54.
6. IAMAI (2010), “Consumer Demography has Affected Internet Adoption
Marginally”, Internet Mobile Association of India, July.
7. Juxt (2010), “India Online Landscape: Online Indians and Their Net Usage
Behavior and Preferences”, available at http://www.slideshare.net/JuxtConsult/
india-online-landscape-2010-snapshot
8. Know K and Lee J (2003), “Concerns About Payment Security of Internet
Purchases: A Perspective on Current On-Line Shoppers”, Clothing and Textiles
Research Journal, Vol. 21, No. 4, pp. 174-184.
9. Kotler P and Armstrong G (2000), ‘Marketing, 5th Edition, Prentice-Hall, Englewood
Cliffs, NJ.
10. Ruchi N and Gupta S L (2010), “Impact of Changing Demographic Profiles of
Indian Customers on their Internet Shopping Behaviour”, Viewpoint, July-
December, pp. 17-24, available at http://www.tmu.ac.in/gallery/management
journal/final_inner_07.pdf
11. Schiffman L and Kanuk L (2003), Consumer Behaviour, 8th Edition, Prentice Hall,
New Jersey.
12. Steenkamp J, Hofstede F and Wedel M (1999), “A Cross-National Investigation
Into the Individual and National Antecedents of Consumer Innovativeness,” Journal
of Marketing, Vol. 63, April, pp. 55-69.
13. Vaggelis S, Adamantia C and Maro V (2010), “Perceptions Towards Online
Shopping: Analyzing the Greek University Students’ Attitude”, Communications
Factors Influencing Online Shopping: An Empirical Study in Ahmedabad 63
14. of the IBIMA, Vol. 2010, pp. 1-13, available at http://www.ibimapublishing.com/
journals/CIBIMA/2010/854516/854516.pdf
14. Wotruba T and Pribova M (1995), “Direct Selling in an Emerging Market Economy:
A Comparison of Central Europe with US”, in T Wotruba, Proceedings of the
International Academic Symposium on Direct Selling in Central and Eastern Europe,
pp. 87-193, Direct Selling Education Foundation, Washington DC.
Appendix
Questionnaire: Perception Towards Online Buying Behavior
Personal Information of the Respondent
Name: _________________________
Age (in Years): 21-30 31-40 >40
Gender: Male Female
Highest Education Qualification:
Undergraduate Graduate Postgraduate
Occupation:
Service Employed Self-Employed Professional/Business
Non-Working/Studying/Part-Time
Monthly Household Income ( ):
<15,000 15,000-30,000 30,000-45,000
>45,000
Please mark the choices carefully and try to give the right information about
your perception.
How many times did you go for online shopping in the past year?
1-2 Times 2-4 Times 5-10 Times
>10 Times
64 The IUP Journal of Marketing Management, Vol. XI, No. 4, 2012
15. To what degree do you agree or disagree with the following statements?
1.
1 2 3 4 5
1 2 3 4 5
1 2 3 4 5
1 2 3 4 5
1 2 3 4 5
1 2 3 4 5
1 2 3 4 5
1 2 3 4 5
1 2 3 4 5
1 2 3 4 5
1 2 3 4 5
1 2 3 4 5
1 2 3 4 5
1 2 3 4 5
1 2 3 4 5
1 2 3 4 5
1 2 3 4 5
1 2 3 4 5
Note: 1 – Highly Disagree; 2 – Disagree; 3 – Neutral (Neither Agree Nor Disagree); 4 – Agree;
Reference # 03J-2012-11-03-01
Appendix (Cont.)
2.
3.
4.
5.
6.
7.
8.
9.
10.
11.
12.
13.
14.
15.
16.
17.
18.
The website provides an in-depth
information about products.
It is quick and easy to complete a
transaction through online shopping.
Online shopping has good collection.
Online shopping takes less time during
transaction.
Online shopping has competitive prices
and sometimes offers discounts.
A variety of products are offered with
good discount.
I feel comfortable while surfing the
Internet for online shopping.
The product delivered was represented
accurately by the website and was of good
quality.
One gets whatever he/she orders through
online shopping.
The product is delivered on time as
promised by the company.
The company is willing and ready to
respond to customer needs.
When you have a problem, the website
shows a sincere interest in solving it.
Online shopping is secure.
Online shopping maintains privacy.
I feel my credit card information is not
secure.
Inquiries are answered promptly during
online transaction.
The website always offers good discounts.
The website understands my needs
properly.
5 – Strongly Agree.
Factors Influencing Online Shopping: An Empirical Study in Ahmedabad 65
16. Copyright of IUP Journal of Marketing Management is the property of IUP Publications and its content may not
be copied or emailed to multiple sites or posted to a listserv without the copyright holder's express written
permission. However, users may print, download, or email articles for individual use.