SlideShare a Scribd company logo
1 of 12
Download to read offline
Quarterly Macroeconomic
1
QUARTERLY MACROECONOMIC REPORT ROMANIA – MAY 2018
The economy
advances slower in
Q1; budget gap up
Moody’s: Baa3 Stable / S&P: BBB-stable /
Fitch: BBB- stable
GDP GROWTH COMES CLOSER TO
POTENTIAL
CURRENT BUDGET EXPENDITURES
RISE MUCH FASTER THAN REVENUES
Outlook – Economic growth moderates, as GDP
advanced by 4%yoy in Q1 18 compared to 6.7%yoy
in Q4 17. All sectors except services and
constructions post a slower pace compared to Q4
17. Although a slowdown in the pace of GDP
growth is in the cards, from 6.9% in 2017 to 4.4%
this year, both domestic and external demand
remain supportive. Domestically, the fiscal policy is
expected to remain expansive, whereas external
demand for capital goods continues to grow, as the
capital stock is being renewed, after having been
eroded in the post crisis years.
The evolution of the budget deficit is
worrisome at 0.5% in GDP (in Q1 18), compared to
a small surplus last year as current revenues increase
slower than current expenditures. Investments could
be again sacrificed.
The NBR hiked the key policy rate 3 times
this year to 2.5% and started to sterilize excess
liquidity. As NBR expects inflation to stabilize and
decrease by Q4 18, we see just one further rate hike
by the end of the year, to 2.75%. Inflation could end
the year at 3.6%. The largest part of the increase in
ROBOR rates has already taken place, with
ROBOR 3M hitting 2.7% in the beginning of May,
versus 0.9% in the preliquidity squeeze period that
started in September 17.
The overall lending is behind the economic
cycle. We expect private loans to advance at a
similar pace as in 2017, considering that the rythm
of disintermediation slows down as already
observed. Monetary policy tightening already sent a
wave of increases in interest rates and it is likely
that most of the shock foreseen for this year has
already been incorporated by May. Household loan
demand remains strong while companies show
sensitivity to higher costs and to slower economic
growth pace.
Main Topics:
 Economic growth: GDP growth is slowing
down, only services maintain the pace
 Monetary stance: NBR started tightening and
sterilizing excess liquidity
 The budget deficit increases as tax collection
does not match wage hikes
 External Accounts and Financing: The CA
deficit still funded by EU funds and FDI, but for
how long?
 Bank loans: Household loan demand is high but
company lending stumbles
5.7
6.1
8.8
6.7
4.0
Q1 17 Q2 17 Q3 17 Q4 17 Q1 18
9.4%
17.2%
-20%
-15%
-10%
-5%
0%
5%
10%
15%
20%
25%
09/Q1
10/Q1
11/Q1
12/Q1
13/Q1
14/Q1
15/Q1
16/Q1
17/Q1
18/Q1
Current income, annual growth %
Current expenditures, annual growth %
Author: Mihaela Neagu, Senior Economist
Mihaela.Neagu@garantibank.ro
Annual GDP growth, %
Quarterly Macroeconomic
2
QUARTERLY MACROECONOMIC REPORT ROMANIA – MAY 2018
Economic Growth GDP growth is slowing down, only services maintain the pace
Economic growth moderates, as GDP advanced by 4%yoy in Q1 18 compared to
6.7%yoy in Q4 17. The high frequency data shows that all sectors except services and
constructions1
move at a slower speed compared to Q4 17.
High frequency indicators show that industry, trade and transport are softening,
but the dynamics remains significant
Source: NIS, Garanti Bank Research
Note:* Garanti Bank Research computed the adjusted dynamics of annual growth rate of services’
turnover, by excluding transportation from the NIS communicated numbers
In the case of industry (4.9%yoy in Q1 18 vs. 9.7% in Q4 17), we see a deceleration in
some sectors contributing to exports, such as cars (and spare parts) and computer electronics.
In other cases, exports oriented sectors see faster growth, such as machinery and equipment
which remains the top performer industry in Q1 18, with an advance of 50.5% yoy. The
worst performers in 2017 tend to keep this tendency in 2018, recording negative growth rate
in Q1 18, after declining last year as well: wood, furniture, leather manufacturing and
clothing industry. There are also cases in which sectors that grew last year are declining in
Q1 18: energy production, oil and gas extraction, mining of coal, metallurgy. Overall, even if
there is a slowdown, capacity utilization in industry still remains below the average of the
current economic cycle (see graph below), so expectations are for continued growth this
year. Additionally, new industrial orders are increasing, supporting short term prospects.
2017 2017 Q1 18 Q1 18
% contribution yoy yoy contribution
Computer and electronics 1.1 19.4 11.7 0.7
Electrical equipment 0.5 10.9 14.6 0.7
Machinery and equipment 1.7 38.2 50.5 2.3
Cars and spare parts 3.1 17.0 9.4 1.7
Other 1.3 2.0 -0.7 -0.5
TOTAL 7.8 7.8 4.9 4.9
Source: NIS, Garanti Bank Research
1
Constructions post a fall of -2.1%yoy in Q1 18 compared to a higher decline in Q4 17, of -5.3%yoy.
-10%
-5%
0%
5%
10%
15%
20% Q4 2017 Q1 2018
Industry
Constructions
Services*
Excluding
Transport
Vehicle’s
Trade
Retail
Trade
Wholesale
Trade
Services
Including
Transport
Transport
Annual growth rates
Quarterly Macroeconomic
3
QUARTERLY MACROECONOMIC REPORT ROMANIA – MAY 2018
Constructions accelerate in relative terms, but remain in negative territory (-5.3%yoy in
Q4 17 vs -2.1% Q1 18). The segments that grow are the non-residential and civil engineering
while the residential segment posts a fall (-24.6%yoy in Q1 18), due to a significant base
effect, given by the stellar 81% annual growth in Q1 18. Civil engineering added 8.1%yoy in
Q1 18, but due to the stretched budget deficit, further cuts into investment budget affecting
infrastructure works can be expected this year too. Due to its large weight in the
constructions index, the civil engineering is a key determinant for the evolution of the overall
constructions sector. The nonresidential sector is currently increasing by 7.7%yoy (Q1 18).
The need for office, commercial space and warehouses supports further expansion of the
nonresidential sector, even if costs are rising: the cost of materials started to increase in
2017, after 4 years of contraction while labor cost puts significant pressure, having added
50%2
in the past 4 years.
Services (excluding transportation) maintained the pace in Q1 18 compared to Q4 17 and
were likely the main driver of GDP growth. The IT&C turnover saw a higher growth rate
while the rest of services had a marginally slower dynamics. The IT turnover went from the
negative to positive territory (-2.5% yoy in Q4 vs 8.1%yoy in Q1 18) , communications also
advanced marginally faster (6.4%yoy in Q4 2017 vs 7.4%yoy in Q1 18). The largest
remaining category, of other business services, marked a slower dynamics (12.1% yoy inQ4
17 vs 9.3%yoy in Q1 18). This latter category was supported, among others, by the legal &
accounting and real estate services.
To conclude, industry and services could be the main drivers of GDP growth this year.
Although a slowdown is in the cards, from 6.9% in 2017 to 4.4% this year, both domestic
and external demand remain supportive. Domestically, the fiscal policy is expected to remain
expansive at 3.5% budget deficit, whereas external demand for capital goods continues to
grow, a path seen in 2017 as well, as the capital stock is being renewed, after having been
eroded in the post crisis years.
IT&C services turnover accelerates in Q1 18 Industrial capacity utilization increases but it is still
below the average of the current economic cycle
Source: NIS, GarantiBank Research calculation Source: NIS, EC, GarantiBank Research
2
January 2018 compared to January 2014, net wage.
-5%
0%
5%
10%
15%
20%
25%
30%
35%
14/Q1
14/Q2
14/Q3
14/Q4
15/Q1
15/Q2
15/Q3
15/Q4
16/Q1
16/Q2
16/Q3
16/Q4
17/Q1
17/Q2
17/Q3
17/Q4
18/Q1
Communications
IT
Other business services
60
65
70
75
80
85
-30%
-20%
-10%
0%
10%
20%
30%
40%
Dec-08 Mar-11 Jun-13 Sep-15 Dec-17
Industrial production turnover -internal mk (%yoy)
Industrial production turnover -external market (% yoy)
capacity utilization (right hand side)
2008- 2017 avg. capacity utilization (right hand side)
Annual growth rate
Quarterly Macroeconomic
4
QUARTERLY MACROECONOMIC REPORT ROMANIA – MAY 2018
Monetary stance
NBR started tightening and sterilizing excess liquidity
As the economy showed clear signs of overheating and inflation exited the targeted
variation band by a wide margin, the NBR hiked the key policy rate 3 times this year, in
January, February and May, to 2.5%. In March, the central bank paused and stated that
inflation was within expectations and it should return in the targeted interval of 1.5-3.5% in
Q4 2018. Among the arguments against hiking, the NBR frequently cited the risk of
exchange rate appreciation, as higher rates could attract hot money, considering that the
region has significantly lower nominal rates3
. The appreciation of the leu could in turn lead
to a larger current account deficit.
As NBR expects inflation to stabilize after the peak reached in Q2 18, we see just one
further rate hike by the end of the year, to 2.75% from the current 2.5% while inflation could
end the year at 3.6%. The largest part of the increase in ROBOR rates has already taken
place, with ROBOR 3M hitting 2.7% in the beginning of May, versus 0.9% in the
preliquidity squeeze period that started in September last year. Now ROBOR rates follow
much closely the key rate as NBR started absorbing the excess liquidity in April. Variation
of the Treasury account, held with NBR, makes anticipating liquidity evolution rather
difficult. Starting 2007, the Treasury account increased continuously as percentage of NBR
balance sheet, reaching up to 25% in Dec 2016. At the same time, the size of government
securities held by Romanian banks rose too, up to one of the highest regional levels. As the
corridor around the base rate is reduced, interest rates will be increasingly more dependent
on the key rate and less on liquidity, but the current interval is still significant, at +/- 100 bps
around the key rate.
3
In Hungary the key rate is 0.9% while in Poland the key rate is 1.5%.
NBR started to sterilize in April Inflation is well outside the targeted variation interval
Source: NBR, GarantiBank Research Source: NIS, GarantiBank Research
-25
-20
-15
-10
-5
0
5
10
15
20
25
-12
-10
-8
-6
-4
-2
0
2
4
6
8
10
12
Apr-10
Apr-11
Apr-12
Apr-13
Apr-14
Apr-15
Apr-16
Apr-17
Apr-18
Net liquidity position
key rate
NBR deposit facility rate
Lombard rate
ROBID ON
RON,
bn
(rhs)
-5
-4
-3
-2
-1
0
1
2
3
4
5
6
Apr-15
Aug-15
Dec-15
Apr-16
Aug-16
Dec-16
Apr-17
Aug-17
Dec-17
Apr-18
Core 3
Vegetables, fruits, eggs
Tobacco
Alcohol
Fuels
Administered
%
Quarterly Macroeconomic
5
QUARTERLY MACROECONOMIC REPORT ROMANIA – MAY 2018
Fiscal policy
The budget deficit increases as tax collection does not match wage hikes
While monetary policy started to tighten, the fiscal policy remains procyclical. The
evolution of the budget deficit is worrisome, as the budget deficit already stands at 0.5% in
GDP (in Q1 2018), compared to a small surplus last year, of 0.2% in GDP. Between current
revenues and expenditures there is a 0.6% in GDP gap which is widening: current revenues
are higher by 9.4%yoy in Q1 18 while current expenditures advanced by 17.2%yoy. We
started seeing this difference in the pace of the two items in Q1 2017. The main reasons are
on one hand the wage hikes seen in the public sector, where wages rose by 22% in 2017 and
on the other hand a lower ability to collect indirect taxes, such as VAT and excises which
make around one third of all budget revenues and which dropped from 2.2% in GDP in Q1
17 to 2% in GDP in Q1 18. As the gap between current revenues and expenditure is
maintained or expands, the next likely correction could come from further reducing
investments, thereby cutting into country’s growth potential in the future. Tax increases
could be an option for the coming years, to improve the budget balance, which we expect at
3.5% in 2018.
State Budget Execution in March 2018
Mar-18 mn RON YoY
Total revenue 66,377 11.5%
Corporate income tax 3,689 -3.3%
Personal income tax 6,574 -14.9%
Other tax on income, profit and capital 613 52.2%
Property tax 3,054 4.5%
Value added tax 13,287 2.2%
Excise duties 5,847 2.6%
Social security contributions 21,969 31.1%
Non fiscal revenue 4,736 17.0%
EU funds 4,265 57.3%
Other 2,341 -4%
Total expenditures 70,836 22.1%
Compensation of public employees 19,066 18.1%
Goods and services 8,803 12.5%
Interest paid 2,715 18.4%
Subsidies 2,449 25.7%
Social benefits 24,351 11.8%
Investment expenditures 4,900 188.2%
Other 4,975 -1969.1%
Transfers 3,576 6.6%
Excedent (+)/Deficit (-) (RON mn) - 4,458 -293%
Budget deficit (% GDP) 0.5%
Source: Ministry of Finance, Garanti Bank Research
The changes to the fiscal code are significant and ongoing, as opposed to a desirable more
stable and therefore predictable fiscal environment. The European Commission already
calculated that the structural deficit will grow to 3.8% in GDP by the end of 2018. For the
moment, Romania enjoys a growth rate more in line with its potential but the public debt
already started to grow from 35% in Dec 2017 (and 37.4% in Dec 16) to 35.7% in Feb 18.
Quarterly Macroeconomic
6
QUARTERLY MACROECONOMIC REPORT ROMANIA – MAY 2018
Given the high structural deficit, a crisis could easily elevate the public debt level, above the
sustainable level of 43%.
Despite some failed auctions, by the end of April, the Treasury managed to raise 31% of
the gross financing requirements of RON 74.1 bn (or 8.1% in GDP). In February, it raised
EUR 2 bn in Eurobonds, less than half of the targeted amount: EUR 750 mn with 12 years
remaining maturity (final yield of 2.585 or 133 bps over midswaps) and EUR 1.25 bn in
Eurobonds with 20 years remaining maturity at a yield of 3.45% (190bps over midwaps).
The ratings agencies maintained a stable outlook on the country and the 5Y CDS
compressed by 8 bps year to date, to 79 bps. The average maturity of RON denominated
debt (45% of total) is 3.4 years (Feb 2018) and the corresponding yields are higher by 137
bps compared to 20174
. Given expectations for further 25 bps increase in the key rate by the
end of the year, further pressure on financing costs is expected.
Public debt is increasing again RON yield curve is shifting up
NBR fixing, mid yields
Source: Ministry of Finance, Eurostat Source: NBR
4
When we compare average mid yield for 2017 with the average for Jan-April 18.
12.4
22.1
29.7
34.0
36.9 37.5
39.1 37.7 37.4
35.0 35.7
08Q4
09Q4
10Q4
11Q4
12Q4
13Q4
14Q4
15Q4
16Q4
17Q4
Feb-18
0.0
1.0
2.0
3.0
4.0
5.0
6.0
0.0
1.0
2.0
3.0
4.0
5.0
6.0
Apr-13
Apr-14
Apr-15
Apr-16
Apr-17
Apr-18
6M 12M 3Y
5Y 10Y
% GDP
Quarterly Macroeconomic
7
QUARTERLY MACROECONOMIC REPORT ROMANIA – MAY 2018
External Accounts and Financing
The CA deficit still funded by EU funds and FDI, but for how long?
The current account deficit remains at 3.3% in GDP on a 12M rolling basis (March 18)
and continues to be funded by FDI and EU funds for the moment, although this may not be
true anymore in the future, especially since the FDI started the year on a weak note.
The composition of the trade gap reveals structural inefficiencies, as 26% is generated by
the food sector (excluding cereals), where Romania benefits of a large potential. Other
significant deficits are on individual items such as medicines and petroleum (See table
below). In some cases, either the post EU accession or the post crisis period were
opportunities to turn from a deficit to surplus (manufacturing of road vehicles, cereals
productions or electrical machinery production). In other cases just the reverse happened
(i.e. manufactured iron and steel products, nonferrous metals) or the historical deficit
widened significantly (plastics, petroleum, medicinal and pharma products). The structure of
the trade gap could improve in the future, if coordinated efforts are made.
The post crisis experience showed that an external shock that catches Romania with large
imbalances can lead to currency depreciation. During the IMF’s surveillance under the stand
by agreements, the funding of the CA by FDI and EU funds improved significantly, whereas
now it starts to decrease. The main culprits are the weak EU funds, but the FDI show
weakness as well. In Q1 18, FDI dropped by 16% yoy and there is a risk of this trend to
continue, considering the sudden changes in fiscal policy that took place this year. Already in
2017, FDI stagnated whereas in 2016 it had seen a 53% growth. We expect the leu to
depreciate to 4.78 against the euro by the end of the year, when accumulation of imbalances
will be more visible and the stable funding of the CA could cease to fully cover the deficit.
Other factors such as investor sentiment and reallocation of portfolio flows could play into
the equation, the latter having increased in the past 12M to 2.2% in GDP (March 18) from
1.5% in Dec 2017.
EU funds are crawling; CA deficit still funded by FDI
and EU funds
Post crisis, the external balance of some goods improved but
worsened for others
Source: NBR, GarantiBank Research
Note: * it includes the effect of debt repayment or loan
inflows, as well as changes in the FX reserves, errors and
omissions and other minor components
Source: NIS, GarantiBank Research
-13.5%
-2.1% -3.4% -3.3%
7.1%
-3.7% -1.8% -2.4%
0.6%
2.5% 1.2% 1.1%
5.4%
2.7% 2.4% 2.4%
0.4%
0.6%
1.5% 2.2%
-12%
-7%
-2%
3%
8%
13%
2007 2016 2017 12M rolling
March 2018
Portfolio flows (% GDP)
FDI (%GDP)
EU funds (% GDP)
Loans, reserve ch, fin. derivatives, errors* (%GDP)
Current account deficit (% GDP)
balance (bnEUR) 00 01 02 03 04 05 06 07 08 09 10 11 12 13 14 15 16 17
Road vehicles -0.3 -0.5 -0.5 -0.6 -1.5 -2.0 -2.7 -4.0 -3.6 1.1 1.7 1.7 2.1 3.2 2.9 2.6 2.8 3.8
Cereals -0.1 -0.1 0.0 -0.3 -0.2 0.0 0.0 -0.3 0.1 0.2 0.5 0.6 0.8 1.4 1.5 1.2 1.2 1.3
Electricalmachinery -0.9 -0.6 -0.6 -0.7 -0.5 -0.5 -0.5 -0.4 -0.3 0.0 -0.2 0.1 0.3 -0.1 0.7 1.0 1.4 0.9
Manufactured -0.1 -0.2 -0.1 -0.2 -0.2 -0.2 -0.3 0.0 0.1 0.2 0.2 0.2 0.2 0.3 0.4 0.6 0.4 0.3
Non-ferrousmetals 0.3 0.2 0.2 0.1 0.1 0.1 0.0 0.0 -0.1 -0.2 -0.3 -0.2 -0.2 -0.2 -0.4 -0.4 -0.4 -0.4
Plasticsinnon
primaryforms -0.1 -0.2 -0.2 -0.3 -0.3 -0.4 -0.5 -0.6 -0.7 -0.5 -0.5 -0.5 -0.5 -0.5 -0.5 -0.6 -0.7 -0.7
Manufactured Iron
and steel 0.4 0.3 0.4 0.4 0.7 0.7 0.2 -0.2 -0.8 -0.4 -0.2 -0.4 -0.3 -0.5 -0.6 -0.6 -0.7 -0.8
Vegetablesand fruits -0.1 -0.1 -0.1 -0.1 -0.1 -0.2 -0.3 -0.4 -0.5 -0.3 -0.3 -0.3 -0.4 -0.4 -0.5 -0.8 -1.0 -1.0
Plasticsinprimary
forms 0.0 -0.1 -0.1 -0.1 -0.1 -0.2 -0.3 -0.3 -0.3 -0.4 -0.6 -0.6 -0.8 -0.9 -0.9 -1.0 -1.0 -1.2
Petroleum -0.4 -0.8 -0.4 -0.4 -0.7 -0.9 -1.3 -1.8 -2.3 -1.4 -2.0 -2.4 -2.8 -2.2 -2.1 -1.5 -1.3 -2.0
Medicinaland
pharma products -0.3 -0.4 -0.5 -0.5 -0.7 -0.9 -1.2 -1.4 -1.7 -1.5 -1.5 -1.6 -1.6 -1.7 -1.8 -1.8 -2.0 -2.2
Quarterly Macroeconomic
8
QUARTERLY MACROECONOMIC REPORT ROMANIA – MAY 2018
Bank Flows Household loan demand is high but company lending stumbles
Although lending restarted, disintermediation continued in 2017. The loans’penetration
probably stabilized to around 27% in GDP in Q1 18, after having declined over several
years. Household lending, already considered overheated by NBR, rushes further while
companies lending, considered under potential by NBR, records hiccups. Nevertheless,
lending growth maintains an uptrend, at a 6.1%yoy in March 18, double the pace seen one
year ago and we expect lending to maintain in the positive territory this year. The
loans/deposits ratio fell to a minimum 76.4% in February (78% in March 18), while banks
place a significant part of their balance sheet in government bonds.
Disintermediation pace slows down Household lending accelerates
Source: NBR, Garanti Bank Research Source: NBR
Household lending is accelerating, on both main types, mortgage (+13.5%yoy in March
18) and consumer loans (+4.9%yoy in March18), respectively. The continuous wage hikes
are likely to maintain household loan demand awake this year, despite the increase in
ROBOR rates5
of 100-120 bps between Sep 17- March 18.
Companies enjoyed a faster dynamics in Q4 17 and slowed down to a mere 2.6%yoy in
March 18, in line with a milder pace in economic activity and higher interest rates (see table
below). As ROBOR jumped, the pace of RON denominated loans fell post September 176
.
Sectorwise we see that agriculture, industry and services7
are top performers while being the
less risky as well; constructions loan are still weak (see graph below).
5
The average interest rate for new RON mortgage loan rose from 3.6% in Sep 17 to 4.8% in March 18. In the case of
consumer loans, the jump was from 8.5% (Sep 17) to 9.5% (March 18).
6
The average interest rate for new company loan in RON jumped from 3.9% in Sep 17 to 5.1% in March 18.
7
Except for real estate.
0%
5%
10%
15%
20%
25%
30%
35%
40%
45%
-3%
-2%
-1%
0%
1%
2%
3%
4%
Mar-08
Sep-08
Mar-09
Sep-09
Mar-10
Sep-10
Mar-11
Sep-11
Mar-12
Sep-12
Mar-13
Sep-13
Mar-14
Sep-14
Mar-15
Sep-15
Mar-16
Sep-16
Mar-17
Sep-17
Mar-18
quarter to quarter change in loans' penetration
Private loan penetration in GDP (right hand side)
6.1%
2.6%
9.4%
-10%
-5%
0%
5%
10%
15%
Dec-11
Jun-12
Dec-12
Jun-13
Dec-13
Jun-14
Dec-14
Jun-15
Dec-15
Jun-16
Dec-16
Jun-17
Dec-17
Private loans Romania (YoY)
Corporate loans (YoY)
Household loans (YoY)
Quarterly Macroeconomic
9
QUARTERLY MACROECONOMIC REPORT ROMANIA – MAY 2018
Bank loan servicing ratio in total net
monetary income has been dropping
Company loans are growing, but at a slower pace
Source: NBR Financial Stability Report Dec 17,
GarantiBank Research
Source: NBR, GarantiBank Research
The overall lending is behind the economic cycle which is in its late expansion phase
and the monetary policy tightening so far slowed down only lending to companies. The RON
interest rates increase probably will not act as a powerful break for household lending this
year.
• One of the reasons is that bank loan servicing ratio in total net monetary income
has been dropping in the past years so there is space for it to go back to higher levels before
it significantly affects loan demand. Meanwhile, wages are still expected to increase and the
unemployment rate is at historical low. From a regulatory point of view, median debt service
to income8
(DTSI) level was 32% for mortgage loans and 24.7% for consumer loans in
September 2017. A 200 bps increase in interest rate would have a small effect on consumer
loans debtors (48% of loan stock) but it would push nearly half of mortgage holders to a
DSTI above 40%, likely considered unsustainable by NBR9
. Therefore, we could expect to
see regulation that takes down the maximum DSTI.
• ROBOR interest rates’ increase ( Sep 17- March 18) did not impact household
loans dynamics. RON loan interest rates for households (see table below) are now around the
level seen in Q4 2014, when the key interest rate was 2.75% (25 bps higher than the current
one) while average net wage is 53% higher.
Consumer Mortgage Companies
RON EUR RON EUR RON EUR
Dec-14 9.4 3.4 4.5 5.3 5.9 3.9
Dec-15 8.7 4.8 3.7 4.3 4.4 3.2
Dec-16 8.3 4.5 3.4 3.6 3.7 3.1
Sep-17 8.5 4.8 3.6 4.1 3.9 2.4
Dec-17 8.9 4.0 4.5 4.1 4.9 2.6
Mar-18 9.5 4.8 4.8 4.1 5.1 2.7
8
Wages income
9
NBR emphasisez this limit in the Financial Stability Report of Dec 17.
16
20
22 21
20
19
18
16
14
12 11
0
5
10
15
20
25
2008
2010
2012
2014
2016
2017
Q2
-4%
-2%
0%
2%
4%
6%
8%
10%
12%
14%
16%
constructions
services
industry
agriculture
<1Y,yoy
1Y-5Y,yoy
>5Y,yoy
Dec-17
Mar-18
per maturity, yoy%per sector,
yoy%
3M rolling
%
Quarterly Macroeconomic
10
QUARTERLY MACROECONOMIC REPORT ROMANIA – MAY 2018
To conclude, we expect private loans to advance at a similar pace as in 2017, considering
that the pace of disintermediation slows down as already observed. Monetary policy
tightening already sent a wave of increases in interest rates and it is likely that most of the
shock foreseen for this year has already been incorporated by May. With wages still
advancing fast, household loan demand remains strong while corporations show sensitivity
to higher costs and to slower economic growth pace.
Quarterly Macroeconomic
11
QUARTERLY MACROECONOMIC REPORT ROMANIA – MAY 2018
Macroeconomic Data
2015 2016 2017 2018F
Economy
Nominal GDP, (EUR bn) 160.3 169.8 187.5 197.2
Real GDP, (% yoy) 4.0 4.8 6.9 4.4
Agriculture, % yoy -11.1 4.7 18.3 -0.4
Industry (except construction), % yoy 5.8 5.3 8.0 5.9
Construction, % yoy 6.9 12.7 -0.3 4.8
Wholesale and retail trade; tourism and
transport, % yoy 12.3 10.6 8.4 5.5
Other services, % yoy 4.6 2.1 6.8 5.8
Avg net monthly wages (EUR, nominal) 418 460 512 557
Min wage, net EUR 144 204 229 243
Unemployment rate, ILO, avg 6.8 6.0 5.0 4.7
External Accounts
Current Account (EUR bn) -1.9 -3.6 -6.3 -8.1
Current Account (% of GDP) -1.2 -2.1 -3.4 -4.1
Export (FOB, EUR bn) 54.6 57.4 62.6 66.4
Import (CIF, EUR bn) 63.0 67.3 75.6 80.9
Export (% yoy) 4.1 5.1 9.2 6.0
Import (% yoy) 7.6 7.0 12.3 7.0
Trade balance FOB-CIF (EUR bn) -8.4 -10.0 -13.0 -14.5
Trade balance FOB-CIF (% of GDP) -5.2 -5.9 -6.9 -7.3
Net FDI (EUR bn) -3.0 4.5 4.6 5.3
Net FDI (% of GDP) 1.8 2.7 2.4 2.7
Internat. reserves incl. Gold (EUR bn) 35.5 37.9 37.1 37.7
Gross Foreign Debt (EUR bn) 92.1 92.9 94.0 99.0
Gross Foreign Debt (% of GDP) 57.4 54.7 50.1 50.2
Fiscal Accounts
Budget Balance (% of GDP) -1.5 -2.4 -2.9 -3.5
Public Governmental Debt (% of GDP) 37.7 37.4 35.0 36.8
Inflation/Monetary/FX
Inflation (CPI) yoy, eop -0.9 -0.5 3.3 3.6
Inflation (CPI) yoy, yearly average -0.6 -1.5 1.3 4.3
Central bank reference rate, eop 1.75 1.75 1.75 2.75
3M Robor, eop 1.02 0.9 2.05 2.50
EUR/RON, eop 4.52 4.54 4.66 4.78
Source: NBR, NIS, Ministry of Finance, Eurostat, GarantiBank Research
Quarterly Macroeconomic
12
QUARTERLY MACROECONOMIC REPORT ROMANIA – MAY 2018
Disclaimer
This document has been drafted by GARANTI BANK SA and is intended for informative purposes
only. This document should not be construed as offer, invitation or recommendation to subscribe for or
to purchase or dispose of any securities or to enter in any transaction and neither this document nor
anything contained herein shall form the basis of any contract or commitment whatsoever. Potential
recipients are advised to independently review and/or obtain independent professional advice on the
legal, regulatory, credit, tax and accounting aspects regarding customization of specific business. All
addressees should be individually aware of the economic benefit and risks of future transactions.
Distribution of this document does not oblige GARANTI BANK SA to enter into any transaction.
Information contained herein is based on various sources, including but not limited to public
information, annual reports and statistical data that GARANTI BANK SA considers accurate and
reliable. However, GARANTI BANK SA makes no representation as to any matter or as to the accuracy
or completeness of any statement made herein or made at any time in connection herewith and all
liability (in negligence or otherwise), in respect of any such matter or statements, is expressly excluded.
This document is being furnished to you solely for your information and may not be copied, forwarded,
disclosed or otherwise used or any part of it, in any forms whatsoever or delivered to anyone else.

More Related Content

What's hot

Macroeconomic Developments Report. December 2018
Macroeconomic Developments Report. December 2018Macroeconomic Developments Report. December 2018
Macroeconomic Developments Report. December 2018Latvijas Banka
 
Weekly Export Risk Outlook by EULER HERMES & SOLUNION 11-06-15
Weekly Export Risk Outlook by EULER HERMES & SOLUNION 11-06-15Weekly Export Risk Outlook by EULER HERMES & SOLUNION 11-06-15
Weekly Export Risk Outlook by EULER HERMES & SOLUNION 11-06-15Jaime Cubillo Fleming
 
Economic outlook january 2018
Economic outlook january 2018Economic outlook january 2018
Economic outlook january 2018Paul Verschueren
 
E-UPDates—A Monthly Statistical Bulletin
E-UPDates—A Monthly Statistical BulletinE-UPDates—A Monthly Statistical Bulletin
E-UPDates—A Monthly Statistical BulletinEcofin Surge
 
Boston-Cambridge-Quincy area Local Market Report 1st Q-2015
Boston-Cambridge-Quincy area Local Market Report 1st Q-2015Boston-Cambridge-Quincy area Local Market Report 1st Q-2015
Boston-Cambridge-Quincy area Local Market Report 1st Q-2015LinkingHouse Real Estate
 
Business Cycle Update - 15 May 2018
Business Cycle Update - 15 May 2018Business Cycle Update - 15 May 2018
Business Cycle Update - 15 May 2018OTP Bank Ltd.
 
Latvijas Banka Monthly Newsletter 02/2018
Latvijas Banka Monthly Newsletter 02/2018Latvijas Banka Monthly Newsletter 02/2018
Latvijas Banka Monthly Newsletter 02/2018Latvijas Banka
 
Swiss Re sigma 3/2019: World insurance: the great pivot east continues
Swiss Re sigma 3/2019: World insurance: the great pivot east continuesSwiss Re sigma 3/2019: World insurance: the great pivot east continues
Swiss Re sigma 3/2019: World insurance: the great pivot east continuesΔρ. Γιώργος K. Κασάπης
 
Atradius country report nafta noviembre 2015
Atradius country report nafta noviembre 2015Atradius country report nafta noviembre 2015
Atradius country report nafta noviembre 2015Jaime Cubillo Fleming
 
BSL Fact Sheet June 2017
BSL Fact Sheet June 2017BSL Fact Sheet June 2017
BSL Fact Sheet June 2017Bodhik
 
Mercer Capital's Value Focus: Real Estate Industry | Q1 2017 | Segment Focus:...
Mercer Capital's Value Focus: Real Estate Industry | Q1 2017 | Segment Focus:...Mercer Capital's Value Focus: Real Estate Industry | Q1 2017 | Segment Focus:...
Mercer Capital's Value Focus: Real Estate Industry | Q1 2017 | Segment Focus:...Mercer Capital
 
Deloitte Dbriefs webcast - Real estate expectations and market realities in 2019
Deloitte Dbriefs webcast - Real estate expectations and market realities in 2019Deloitte Dbriefs webcast - Real estate expectations and market realities in 2019
Deloitte Dbriefs webcast - Real estate expectations and market realities in 2019Shanika Gunawardena
 
Q4 2016 Talent Market Quarterly
Q4 2016 Talent Market Quarterly Q4 2016 Talent Market Quarterly
Q4 2016 Talent Market Quarterly Kelly Services
 
Ukraine Monthly Economic Review, July 2017
Ukraine Monthly Economic Review, July 2017 Ukraine Monthly Economic Review, July 2017
Ukraine Monthly Economic Review, July 2017 DIXI Group
 
Country Report > Aumento de la insolvencia en la zona NAFTA
Country Report > Aumento de la insolvencia en la zona NAFTACountry Report > Aumento de la insolvencia en la zona NAFTA
Country Report > Aumento de la insolvencia en la zona NAFTAIgnacio Jimenez
 
Macroeconomic forecast and monetary policy update
Macroeconomic forecast and monetary policy updateMacroeconomic forecast and monetary policy update
Macroeconomic forecast and monetary policy updateRuslan Sivoplyas
 
Economic and Government Policy Analysis - Vietnam - June 2016
Economic and Government Policy Analysis - Vietnam - June 2016Economic and Government Policy Analysis - Vietnam - June 2016
Economic and Government Policy Analysis - Vietnam - June 2016paul young cpa, cga
 
Macroeconomic Developments Report. June 2019
Macroeconomic Developments Report. June 2019Macroeconomic Developments Report. June 2019
Macroeconomic Developments Report. June 2019Latvijas Banka
 

What's hot (20)

Macroeconomic Developments Report. December 2018
Macroeconomic Developments Report. December 2018Macroeconomic Developments Report. December 2018
Macroeconomic Developments Report. December 2018
 
Weekly Export Risk Outlook by EULER HERMES & SOLUNION 11-06-15
Weekly Export Risk Outlook by EULER HERMES & SOLUNION 11-06-15Weekly Export Risk Outlook by EULER HERMES & SOLUNION 11-06-15
Weekly Export Risk Outlook by EULER HERMES & SOLUNION 11-06-15
 
Economic outlook january 2018
Economic outlook january 2018Economic outlook january 2018
Economic outlook january 2018
 
E-UPDates—A Monthly Statistical Bulletin
E-UPDates—A Monthly Statistical BulletinE-UPDates—A Monthly Statistical Bulletin
E-UPDates—A Monthly Statistical Bulletin
 
Boston-Cambridge-Quincy area Local Market Report 1st Q-2015
Boston-Cambridge-Quincy area Local Market Report 1st Q-2015Boston-Cambridge-Quincy area Local Market Report 1st Q-2015
Boston-Cambridge-Quincy area Local Market Report 1st Q-2015
 
Business Cycle Update - 15 May 2018
Business Cycle Update - 15 May 2018Business Cycle Update - 15 May 2018
Business Cycle Update - 15 May 2018
 
Latvijas Banka Monthly Newsletter 02/2018
Latvijas Banka Monthly Newsletter 02/2018Latvijas Banka Monthly Newsletter 02/2018
Latvijas Banka Monthly Newsletter 02/2018
 
Swiss Re sigma 3/2019: World insurance: the great pivot east continues
Swiss Re sigma 3/2019: World insurance: the great pivot east continuesSwiss Re sigma 3/2019: World insurance: the great pivot east continues
Swiss Re sigma 3/2019: World insurance: the great pivot east continues
 
Atradius country report nafta noviembre 2015
Atradius country report nafta noviembre 2015Atradius country report nafta noviembre 2015
Atradius country report nafta noviembre 2015
 
BSL Fact Sheet June 2017
BSL Fact Sheet June 2017BSL Fact Sheet June 2017
BSL Fact Sheet June 2017
 
Mercer Capital's Value Focus: Real Estate Industry | Q1 2017 | Segment Focus:...
Mercer Capital's Value Focus: Real Estate Industry | Q1 2017 | Segment Focus:...Mercer Capital's Value Focus: Real Estate Industry | Q1 2017 | Segment Focus:...
Mercer Capital's Value Focus: Real Estate Industry | Q1 2017 | Segment Focus:...
 
Deloitte Dbriefs webcast - Real estate expectations and market realities in 2019
Deloitte Dbriefs webcast - Real estate expectations and market realities in 2019Deloitte Dbriefs webcast - Real estate expectations and market realities in 2019
Deloitte Dbriefs webcast - Real estate expectations and market realities in 2019
 
Q4 2016 Talent Market Quarterly
Q4 2016 Talent Market Quarterly Q4 2016 Talent Market Quarterly
Q4 2016 Talent Market Quarterly
 
Q32016 global tmq
Q32016 global tmqQ32016 global tmq
Q32016 global tmq
 
Ukraine Monthly Economic Review, July 2017
Ukraine Monthly Economic Review, July 2017 Ukraine Monthly Economic Review, July 2017
Ukraine Monthly Economic Review, July 2017
 
Procurement outlook-report-2018
Procurement outlook-report-2018Procurement outlook-report-2018
Procurement outlook-report-2018
 
Country Report > Aumento de la insolvencia en la zona NAFTA
Country Report > Aumento de la insolvencia en la zona NAFTACountry Report > Aumento de la insolvencia en la zona NAFTA
Country Report > Aumento de la insolvencia en la zona NAFTA
 
Macroeconomic forecast and monetary policy update
Macroeconomic forecast and monetary policy updateMacroeconomic forecast and monetary policy update
Macroeconomic forecast and monetary policy update
 
Economic and Government Policy Analysis - Vietnam - June 2016
Economic and Government Policy Analysis - Vietnam - June 2016Economic and Government Policy Analysis - Vietnam - June 2016
Economic and Government Policy Analysis - Vietnam - June 2016
 
Macroeconomic Developments Report. June 2019
Macroeconomic Developments Report. June 2019Macroeconomic Developments Report. June 2019
Macroeconomic Developments Report. June 2019
 

Similar to Raport Macroeconomic Garanti Bank

Macroeconomic Developments Report. June 2018
Macroeconomic Developments Report. June 2018Macroeconomic Developments Report. June 2018
Macroeconomic Developments Report. June 2018Latvijas Banka
 
Latvijas Banka Monthly Newsletter 12/2017
Latvijas Banka Monthly Newsletter 12/2017Latvijas Banka Monthly Newsletter 12/2017
Latvijas Banka Monthly Newsletter 12/2017Latvijas Banka
 
Prévisions économiques du printemps 2019 pour le Luxembourg
Prévisions économiques du printemps 2019 pour le LuxembourgPrévisions économiques du printemps 2019 pour le Luxembourg
Prévisions économiques du printemps 2019 pour le LuxembourgPaperjam_redaction
 
State of the Economy in 2018-19: A Macro View
State of the Economy in 2018-19: A Macro ViewState of the Economy in 2018-19: A Macro View
State of the Economy in 2018-19: A Macro ViewDVSResearchFoundatio
 
UK corporate environment - November 2019
UK corporate environment - November 2019UK corporate environment - November 2019
UK corporate environment - November 2019Deloitte UK
 
Greek Economy: Trends and Prospects
Greek Economy: Trends and ProspectsGreek Economy: Trends and Prospects
Greek Economy: Trends and ProspectsIlias Lekkos
 
Oecd interim economic ocde outlook march 2017 embargo (3)
Oecd interim economic ocde outlook march 2017   embargo (3)Oecd interim economic ocde outlook march 2017   embargo (3)
Oecd interim economic ocde outlook march 2017 embargo (3)Daniel BASTIEN
 
Coface 2018 09 coface-focus_cee_insolvencies
Coface 2018 09 coface-focus_cee_insolvenciesCoface 2018 09 coface-focus_cee_insolvencies
Coface 2018 09 coface-focus_cee_insolvenciesJaime Cubillo Fleming
 
Rong Viet Securities - Investment Strategy Report April 2017
Rong Viet Securities - Investment Strategy Report April 2017Rong Viet Securities - Investment Strategy Report April 2017
Rong Viet Securities - Investment Strategy Report April 2017Thomas Farthofer
 
Latvijas Banka Monthly Newsletter: June 2018
Latvijas Banka Monthly Newsletter: June 2018Latvijas Banka Monthly Newsletter: June 2018
Latvijas Banka Monthly Newsletter: June 2018Latvijas Banka
 
Thailand Blockchain Community Initiative
Thailand Blockchain Community InitiativeThailand Blockchain Community Initiative
Thailand Blockchain Community InitiativeRein Mahatma
 
Economic outlook for 2018 – more bumps in the road?
Economic outlook for 2018 – more bumps in the road?Economic outlook for 2018 – more bumps in the road?
Economic outlook for 2018 – more bumps in the road?DIXI Group
 
FNB_Property Insights_Retail Property's Consumer Challenges
FNB_Property Insights_Retail Property's Consumer ChallengesFNB_Property Insights_Retail Property's Consumer Challenges
FNB_Property Insights_Retail Property's Consumer ChallengesBerty Van Staaden
 
Real Estate Facilities Management | Project Services | Vestian
Real Estate Facilities Management | Project Services | VestianReal Estate Facilities Management | Project Services | Vestian
Real Estate Facilities Management | Project Services | Vestianvallispvm
 
Real Estate Facilities Management | Project Services | Vestian
Real Estate Facilities Management | Project Services | VestianReal Estate Facilities Management | Project Services | Vestian
Real Estate Facilities Management | Project Services | VestianAlkaKumari66
 
2017 Commercial Lending Trends Survey
2017 Commercial Lending Trends Survey2017 Commercial Lending Trends Survey
2017 Commercial Lending Trends Surveycutmytaxes
 
VietinBank IR Presentation 3Q2019
VietinBank IR Presentation 3Q2019VietinBank IR Presentation 3Q2019
VietinBank IR Presentation 3Q2019ngothithungan1
 
VietinBank IR Presentation_Reviewed 1H2019
VietinBank IR Presentation_Reviewed 1H2019VietinBank IR Presentation_Reviewed 1H2019
VietinBank IR Presentation_Reviewed 1H2019ngothithungan1
 
2. slide en q2.2019 soat xet out
2. slide en q2.2019 soat xet out2. slide en q2.2019 soat xet out
2. slide en q2.2019 soat xet outngothithungan1
 

Similar to Raport Macroeconomic Garanti Bank (20)

Macroeconomic Developments Report. June 2018
Macroeconomic Developments Report. June 2018Macroeconomic Developments Report. June 2018
Macroeconomic Developments Report. June 2018
 
Latvijas Banka Monthly Newsletter 12/2017
Latvijas Banka Monthly Newsletter 12/2017Latvijas Banka Monthly Newsletter 12/2017
Latvijas Banka Monthly Newsletter 12/2017
 
Prévisions économiques du printemps 2019 pour le Luxembourg
Prévisions économiques du printemps 2019 pour le LuxembourgPrévisions économiques du printemps 2019 pour le Luxembourg
Prévisions économiques du printemps 2019 pour le Luxembourg
 
State of the Economy in 2018-19: A Macro View
State of the Economy in 2018-19: A Macro ViewState of the Economy in 2018-19: A Macro View
State of the Economy in 2018-19: A Macro View
 
M&A dealscape
M&A dealscapeM&A dealscape
M&A dealscape
 
UK corporate environment - November 2019
UK corporate environment - November 2019UK corporate environment - November 2019
UK corporate environment - November 2019
 
Greek Economy: Trends and Prospects
Greek Economy: Trends and ProspectsGreek Economy: Trends and Prospects
Greek Economy: Trends and Prospects
 
Oecd interim economic ocde outlook march 2017 embargo (3)
Oecd interim economic ocde outlook march 2017   embargo (3)Oecd interim economic ocde outlook march 2017   embargo (3)
Oecd interim economic ocde outlook march 2017 embargo (3)
 
Coface 2018 09 coface-focus_cee_insolvencies
Coface 2018 09 coface-focus_cee_insolvenciesCoface 2018 09 coface-focus_cee_insolvencies
Coface 2018 09 coface-focus_cee_insolvencies
 
Rong Viet Securities - Investment Strategy Report April 2017
Rong Viet Securities - Investment Strategy Report April 2017Rong Viet Securities - Investment Strategy Report April 2017
Rong Viet Securities - Investment Strategy Report April 2017
 
Latvijas Banka Monthly Newsletter: June 2018
Latvijas Banka Monthly Newsletter: June 2018Latvijas Banka Monthly Newsletter: June 2018
Latvijas Banka Monthly Newsletter: June 2018
 
Thailand Blockchain Community Initiative
Thailand Blockchain Community InitiativeThailand Blockchain Community Initiative
Thailand Blockchain Community Initiative
 
Economic outlook for 2018 – more bumps in the road?
Economic outlook for 2018 – more bumps in the road?Economic outlook for 2018 – more bumps in the road?
Economic outlook for 2018 – more bumps in the road?
 
FNB_Property Insights_Retail Property's Consumer Challenges
FNB_Property Insights_Retail Property's Consumer ChallengesFNB_Property Insights_Retail Property's Consumer Challenges
FNB_Property Insights_Retail Property's Consumer Challenges
 
Real Estate Facilities Management | Project Services | Vestian
Real Estate Facilities Management | Project Services | VestianReal Estate Facilities Management | Project Services | Vestian
Real Estate Facilities Management | Project Services | Vestian
 
Real Estate Facilities Management | Project Services | Vestian
Real Estate Facilities Management | Project Services | VestianReal Estate Facilities Management | Project Services | Vestian
Real Estate Facilities Management | Project Services | Vestian
 
2017 Commercial Lending Trends Survey
2017 Commercial Lending Trends Survey2017 Commercial Lending Trends Survey
2017 Commercial Lending Trends Survey
 
VietinBank IR Presentation 3Q2019
VietinBank IR Presentation 3Q2019VietinBank IR Presentation 3Q2019
VietinBank IR Presentation 3Q2019
 
VietinBank IR Presentation_Reviewed 1H2019
VietinBank IR Presentation_Reviewed 1H2019VietinBank IR Presentation_Reviewed 1H2019
VietinBank IR Presentation_Reviewed 1H2019
 
2. slide en q2.2019 soat xet out
2. slide en q2.2019 soat xet out2. slide en q2.2019 soat xet out
2. slide en q2.2019 soat xet out
 

More from IQads

Prezentarea companiei BUZZStore_Romania 2024
Prezentarea companiei BUZZStore_Romania 2024Prezentarea companiei BUZZStore_Romania 2024
Prezentarea companiei BUZZStore_Romania 2024IQads
 
TOP ADC 2022- 2023 - Prezentare Gală.pdf
TOP ADC 2022- 2023 - Prezentare Gală.pdfTOP ADC 2022- 2023 - Prezentare Gală.pdf
TOP ADC 2022- 2023 - Prezentare Gală.pdfIQads
 
CatalogIQads2022.pdf
CatalogIQads2022.pdfCatalogIQads2022.pdf
CatalogIQads2022.pdfIQads
 
Brand Finance® Romania 50
Brand Finance® Romania 50Brand Finance® Romania 50
Brand Finance® Romania 50IQads
 
Circumstances change, principles don't
Circumstances change, principles don'tCircumstances change, principles don't
Circumstances change, principles don'tIQads
 
Innovation report 2020 by Samsung
Innovation report 2020 by SamsungInnovation report 2020 by Samsung
Innovation report 2020 by SamsungIQads
 
Workspace Studio E-book 27 mai
Workspace Studio E-book 27 maiWorkspace Studio E-book 27 mai
Workspace Studio E-book 27 maiIQads
 
Ghid de preventie
Ghid de preventieGhid de preventie
Ghid de preventieIQads
 
Brosura igenizarea locuintei
Brosura igenizarea locuintei Brosura igenizarea locuintei
Brosura igenizarea locuintei IQads
 
Temerile Romanilor - Mercury research
Temerile Romanilor - Mercury researchTemerile Romanilor - Mercury research
Temerile Romanilor - Mercury researchIQads
 
How brands react to coronavirus
How brands react to coronavirusHow brands react to coronavirus
How brands react to coronavirusIQads
 
Covid 19 Observations, implications and possible actions - Romania
Covid 19 Observations, implications and possible actions - RomaniaCovid 19 Observations, implications and possible actions - Romania
Covid 19 Observations, implications and possible actions - RomaniaIQads
 
OLX - Indexul locurilor de munca
OLX - Indexul locurilor de muncaOLX - Indexul locurilor de munca
OLX - Indexul locurilor de muncaIQads
 
2020 Edelman Trust Barometer
2020 Edelman Trust Barometer2020 Edelman Trust Barometer
2020 Edelman Trust BarometerIQads
 
Internship & Trainee - Programs Study 2019
Internship & Trainee - Programs Study 2019Internship & Trainee - Programs Study 2019
Internship & Trainee - Programs Study 2019IQads
 
Chilli Ideas
Chilli IdeasChilli Ideas
Chilli IdeasIQads
 
Infografic OLX Imobiliare "Student roman, caut garsoniera in chirie"
Infografic OLX Imobiliare "Student roman, caut garsoniera in chirie"Infografic OLX Imobiliare "Student roman, caut garsoniera in chirie"
Infografic OLX Imobiliare "Student roman, caut garsoniera in chirie"IQads
 
Infografic: Perceptia romanilor despre un viitor verde
Infografic: Perceptia romanilor despre un viitor verdeInfografic: Perceptia romanilor despre un viitor verde
Infografic: Perceptia romanilor despre un viitor verdeIQads
 
Prezentarea serviciilor Decat O Duba - 2019
Prezentarea serviciilor Decat O Duba - 2019Prezentarea serviciilor Decat O Duba - 2019
Prezentarea serviciilor Decat O Duba - 2019IQads
 
Politicieni romani pe facebook
Politicieni romani pe facebookPoliticieni romani pe facebook
Politicieni romani pe facebookIQads
 

More from IQads (20)

Prezentarea companiei BUZZStore_Romania 2024
Prezentarea companiei BUZZStore_Romania 2024Prezentarea companiei BUZZStore_Romania 2024
Prezentarea companiei BUZZStore_Romania 2024
 
TOP ADC 2022- 2023 - Prezentare Gală.pdf
TOP ADC 2022- 2023 - Prezentare Gală.pdfTOP ADC 2022- 2023 - Prezentare Gală.pdf
TOP ADC 2022- 2023 - Prezentare Gală.pdf
 
CatalogIQads2022.pdf
CatalogIQads2022.pdfCatalogIQads2022.pdf
CatalogIQads2022.pdf
 
Brand Finance® Romania 50
Brand Finance® Romania 50Brand Finance® Romania 50
Brand Finance® Romania 50
 
Circumstances change, principles don't
Circumstances change, principles don'tCircumstances change, principles don't
Circumstances change, principles don't
 
Innovation report 2020 by Samsung
Innovation report 2020 by SamsungInnovation report 2020 by Samsung
Innovation report 2020 by Samsung
 
Workspace Studio E-book 27 mai
Workspace Studio E-book 27 maiWorkspace Studio E-book 27 mai
Workspace Studio E-book 27 mai
 
Ghid de preventie
Ghid de preventieGhid de preventie
Ghid de preventie
 
Brosura igenizarea locuintei
Brosura igenizarea locuintei Brosura igenizarea locuintei
Brosura igenizarea locuintei
 
Temerile Romanilor - Mercury research
Temerile Romanilor - Mercury researchTemerile Romanilor - Mercury research
Temerile Romanilor - Mercury research
 
How brands react to coronavirus
How brands react to coronavirusHow brands react to coronavirus
How brands react to coronavirus
 
Covid 19 Observations, implications and possible actions - Romania
Covid 19 Observations, implications and possible actions - RomaniaCovid 19 Observations, implications and possible actions - Romania
Covid 19 Observations, implications and possible actions - Romania
 
OLX - Indexul locurilor de munca
OLX - Indexul locurilor de muncaOLX - Indexul locurilor de munca
OLX - Indexul locurilor de munca
 
2020 Edelman Trust Barometer
2020 Edelman Trust Barometer2020 Edelman Trust Barometer
2020 Edelman Trust Barometer
 
Internship & Trainee - Programs Study 2019
Internship & Trainee - Programs Study 2019Internship & Trainee - Programs Study 2019
Internship & Trainee - Programs Study 2019
 
Chilli Ideas
Chilli IdeasChilli Ideas
Chilli Ideas
 
Infografic OLX Imobiliare "Student roman, caut garsoniera in chirie"
Infografic OLX Imobiliare "Student roman, caut garsoniera in chirie"Infografic OLX Imobiliare "Student roman, caut garsoniera in chirie"
Infografic OLX Imobiliare "Student roman, caut garsoniera in chirie"
 
Infografic: Perceptia romanilor despre un viitor verde
Infografic: Perceptia romanilor despre un viitor verdeInfografic: Perceptia romanilor despre un viitor verde
Infografic: Perceptia romanilor despre un viitor verde
 
Prezentarea serviciilor Decat O Duba - 2019
Prezentarea serviciilor Decat O Duba - 2019Prezentarea serviciilor Decat O Duba - 2019
Prezentarea serviciilor Decat O Duba - 2019
 
Politicieni romani pe facebook
Politicieni romani pe facebookPoliticieni romani pe facebook
Politicieni romani pe facebook
 

Recently uploaded

Andheri Call Girls In 9825968104 Mumbai Hot Models
Andheri Call Girls In 9825968104 Mumbai Hot ModelsAndheri Call Girls In 9825968104 Mumbai Hot Models
Andheri Call Girls In 9825968104 Mumbai Hot Modelshematsharma006
 
Vip B Aizawl Call Girls #9907093804 Contact Number Escorts Service Aizawl
Vip B Aizawl Call Girls #9907093804 Contact Number Escorts Service AizawlVip B Aizawl Call Girls #9907093804 Contact Number Escorts Service Aizawl
Vip B Aizawl Call Girls #9907093804 Contact Number Escorts Service Aizawlmakika9823
 
Call Girls In Yusuf Sarai Women Seeking Men 9654467111
Call Girls In Yusuf Sarai Women Seeking Men 9654467111Call Girls In Yusuf Sarai Women Seeking Men 9654467111
Call Girls In Yusuf Sarai Women Seeking Men 9654467111Sapana Sha
 
Monthly Market Risk Update: April 2024 [SlideShare]
Monthly Market Risk Update: April 2024 [SlideShare]Monthly Market Risk Update: April 2024 [SlideShare]
Monthly Market Risk Update: April 2024 [SlideShare]Commonwealth
 
VIP Call Girls Service Dilsukhnagar Hyderabad Call +91-8250192130
VIP Call Girls Service Dilsukhnagar Hyderabad Call +91-8250192130VIP Call Girls Service Dilsukhnagar Hyderabad Call +91-8250192130
VIP Call Girls Service Dilsukhnagar Hyderabad Call +91-8250192130Suhani Kapoor
 
The Economic History of the U.S. Lecture 18.pdf
The Economic History of the U.S. Lecture 18.pdfThe Economic History of the U.S. Lecture 18.pdf
The Economic History of the U.S. Lecture 18.pdfGale Pooley
 
20240417-Calibre-April-2024-Investor-Presentation.pdf
20240417-Calibre-April-2024-Investor-Presentation.pdf20240417-Calibre-April-2024-Investor-Presentation.pdf
20240417-Calibre-April-2024-Investor-Presentation.pdfAdnet Communications
 
VIP Kolkata Call Girl Serampore 👉 8250192130 Available With Room
VIP Kolkata Call Girl Serampore 👉 8250192130  Available With RoomVIP Kolkata Call Girl Serampore 👉 8250192130  Available With Room
VIP Kolkata Call Girl Serampore 👉 8250192130 Available With Roomdivyansh0kumar0
 
fca-bsps-decision-letter-redacted (1).pdf
fca-bsps-decision-letter-redacted (1).pdffca-bsps-decision-letter-redacted (1).pdf
fca-bsps-decision-letter-redacted (1).pdfHenry Tapper
 
High Class Call Girls Nashik Maya 7001305949 Independent Escort Service Nashik
High Class Call Girls Nashik Maya 7001305949 Independent Escort Service NashikHigh Class Call Girls Nashik Maya 7001305949 Independent Escort Service Nashik
High Class Call Girls Nashik Maya 7001305949 Independent Escort Service NashikCall Girls in Nagpur High Profile
 
Instant Issue Debit Cards - High School Spirit
Instant Issue Debit Cards - High School SpiritInstant Issue Debit Cards - High School Spirit
Instant Issue Debit Cards - High School Spiritegoetzinger
 
(DIYA) Bhumkar Chowk Call Girls Just Call 7001035870 [ Cash on Delivery ] Pun...
(DIYA) Bhumkar Chowk Call Girls Just Call 7001035870 [ Cash on Delivery ] Pun...(DIYA) Bhumkar Chowk Call Girls Just Call 7001035870 [ Cash on Delivery ] Pun...
(DIYA) Bhumkar Chowk Call Girls Just Call 7001035870 [ Cash on Delivery ] Pun...ranjana rawat
 
Russian Call Girls In Gtb Nagar (Delhi) 9711199012 💋✔💕😘 Naughty Call Girls Se...
Russian Call Girls In Gtb Nagar (Delhi) 9711199012 💋✔💕😘 Naughty Call Girls Se...Russian Call Girls In Gtb Nagar (Delhi) 9711199012 💋✔💕😘 Naughty Call Girls Se...
Russian Call Girls In Gtb Nagar (Delhi) 9711199012 💋✔💕😘 Naughty Call Girls Se...shivangimorya083
 
Stock Market Brief Deck for 4/24/24 .pdf
Stock Market Brief Deck for 4/24/24 .pdfStock Market Brief Deck for 4/24/24 .pdf
Stock Market Brief Deck for 4/24/24 .pdfMichael Silva
 
call girls in Nand Nagri (DELHI) 🔝 >༒9953330565🔝 genuine Escort Service 🔝✔️✔️
call girls in  Nand Nagri (DELHI) 🔝 >༒9953330565🔝 genuine Escort Service 🔝✔️✔️call girls in  Nand Nagri (DELHI) 🔝 >༒9953330565🔝 genuine Escort Service 🔝✔️✔️
call girls in Nand Nagri (DELHI) 🔝 >༒9953330565🔝 genuine Escort Service 🔝✔️✔️9953056974 Low Rate Call Girls In Saket, Delhi NCR
 
Quarter 4- Module 3 Principles of Marketing
Quarter 4- Module 3 Principles of MarketingQuarter 4- Module 3 Principles of Marketing
Quarter 4- Module 3 Principles of MarketingMaristelaRamos12
 
OAT_RI_Ep19 WeighingTheRisks_Apr24_TheYellowMetal.pptx
OAT_RI_Ep19 WeighingTheRisks_Apr24_TheYellowMetal.pptxOAT_RI_Ep19 WeighingTheRisks_Apr24_TheYellowMetal.pptx
OAT_RI_Ep19 WeighingTheRisks_Apr24_TheYellowMetal.pptxhiddenlevers
 
06_Joeri Van Speybroek_Dell_MeetupDora&Cybersecurity.pdf
06_Joeri Van Speybroek_Dell_MeetupDora&Cybersecurity.pdf06_Joeri Van Speybroek_Dell_MeetupDora&Cybersecurity.pdf
06_Joeri Van Speybroek_Dell_MeetupDora&Cybersecurity.pdfFinTech Belgium
 
00_Main ppt_MeetupDORA&CyberSecurity.pptx
00_Main ppt_MeetupDORA&CyberSecurity.pptx00_Main ppt_MeetupDORA&CyberSecurity.pptx
00_Main ppt_MeetupDORA&CyberSecurity.pptxFinTech Belgium
 

Recently uploaded (20)

Andheri Call Girls In 9825968104 Mumbai Hot Models
Andheri Call Girls In 9825968104 Mumbai Hot ModelsAndheri Call Girls In 9825968104 Mumbai Hot Models
Andheri Call Girls In 9825968104 Mumbai Hot Models
 
Vip B Aizawl Call Girls #9907093804 Contact Number Escorts Service Aizawl
Vip B Aizawl Call Girls #9907093804 Contact Number Escorts Service AizawlVip B Aizawl Call Girls #9907093804 Contact Number Escorts Service Aizawl
Vip B Aizawl Call Girls #9907093804 Contact Number Escorts Service Aizawl
 
Call Girls In Yusuf Sarai Women Seeking Men 9654467111
Call Girls In Yusuf Sarai Women Seeking Men 9654467111Call Girls In Yusuf Sarai Women Seeking Men 9654467111
Call Girls In Yusuf Sarai Women Seeking Men 9654467111
 
Monthly Market Risk Update: April 2024 [SlideShare]
Monthly Market Risk Update: April 2024 [SlideShare]Monthly Market Risk Update: April 2024 [SlideShare]
Monthly Market Risk Update: April 2024 [SlideShare]
 
VIP Call Girls Service Dilsukhnagar Hyderabad Call +91-8250192130
VIP Call Girls Service Dilsukhnagar Hyderabad Call +91-8250192130VIP Call Girls Service Dilsukhnagar Hyderabad Call +91-8250192130
VIP Call Girls Service Dilsukhnagar Hyderabad Call +91-8250192130
 
The Economic History of the U.S. Lecture 18.pdf
The Economic History of the U.S. Lecture 18.pdfThe Economic History of the U.S. Lecture 18.pdf
The Economic History of the U.S. Lecture 18.pdf
 
Veritas Interim Report 1 January–31 March 2024
Veritas Interim Report 1 January–31 March 2024Veritas Interim Report 1 January–31 March 2024
Veritas Interim Report 1 January–31 March 2024
 
20240417-Calibre-April-2024-Investor-Presentation.pdf
20240417-Calibre-April-2024-Investor-Presentation.pdf20240417-Calibre-April-2024-Investor-Presentation.pdf
20240417-Calibre-April-2024-Investor-Presentation.pdf
 
VIP Kolkata Call Girl Serampore 👉 8250192130 Available With Room
VIP Kolkata Call Girl Serampore 👉 8250192130  Available With RoomVIP Kolkata Call Girl Serampore 👉 8250192130  Available With Room
VIP Kolkata Call Girl Serampore 👉 8250192130 Available With Room
 
fca-bsps-decision-letter-redacted (1).pdf
fca-bsps-decision-letter-redacted (1).pdffca-bsps-decision-letter-redacted (1).pdf
fca-bsps-decision-letter-redacted (1).pdf
 
High Class Call Girls Nashik Maya 7001305949 Independent Escort Service Nashik
High Class Call Girls Nashik Maya 7001305949 Independent Escort Service NashikHigh Class Call Girls Nashik Maya 7001305949 Independent Escort Service Nashik
High Class Call Girls Nashik Maya 7001305949 Independent Escort Service Nashik
 
Instant Issue Debit Cards - High School Spirit
Instant Issue Debit Cards - High School SpiritInstant Issue Debit Cards - High School Spirit
Instant Issue Debit Cards - High School Spirit
 
(DIYA) Bhumkar Chowk Call Girls Just Call 7001035870 [ Cash on Delivery ] Pun...
(DIYA) Bhumkar Chowk Call Girls Just Call 7001035870 [ Cash on Delivery ] Pun...(DIYA) Bhumkar Chowk Call Girls Just Call 7001035870 [ Cash on Delivery ] Pun...
(DIYA) Bhumkar Chowk Call Girls Just Call 7001035870 [ Cash on Delivery ] Pun...
 
Russian Call Girls In Gtb Nagar (Delhi) 9711199012 💋✔💕😘 Naughty Call Girls Se...
Russian Call Girls In Gtb Nagar (Delhi) 9711199012 💋✔💕😘 Naughty Call Girls Se...Russian Call Girls In Gtb Nagar (Delhi) 9711199012 💋✔💕😘 Naughty Call Girls Se...
Russian Call Girls In Gtb Nagar (Delhi) 9711199012 💋✔💕😘 Naughty Call Girls Se...
 
Stock Market Brief Deck for 4/24/24 .pdf
Stock Market Brief Deck for 4/24/24 .pdfStock Market Brief Deck for 4/24/24 .pdf
Stock Market Brief Deck for 4/24/24 .pdf
 
call girls in Nand Nagri (DELHI) 🔝 >༒9953330565🔝 genuine Escort Service 🔝✔️✔️
call girls in  Nand Nagri (DELHI) 🔝 >༒9953330565🔝 genuine Escort Service 🔝✔️✔️call girls in  Nand Nagri (DELHI) 🔝 >༒9953330565🔝 genuine Escort Service 🔝✔️✔️
call girls in Nand Nagri (DELHI) 🔝 >༒9953330565🔝 genuine Escort Service 🔝✔️✔️
 
Quarter 4- Module 3 Principles of Marketing
Quarter 4- Module 3 Principles of MarketingQuarter 4- Module 3 Principles of Marketing
Quarter 4- Module 3 Principles of Marketing
 
OAT_RI_Ep19 WeighingTheRisks_Apr24_TheYellowMetal.pptx
OAT_RI_Ep19 WeighingTheRisks_Apr24_TheYellowMetal.pptxOAT_RI_Ep19 WeighingTheRisks_Apr24_TheYellowMetal.pptx
OAT_RI_Ep19 WeighingTheRisks_Apr24_TheYellowMetal.pptx
 
06_Joeri Van Speybroek_Dell_MeetupDora&Cybersecurity.pdf
06_Joeri Van Speybroek_Dell_MeetupDora&Cybersecurity.pdf06_Joeri Van Speybroek_Dell_MeetupDora&Cybersecurity.pdf
06_Joeri Van Speybroek_Dell_MeetupDora&Cybersecurity.pdf
 
00_Main ppt_MeetupDORA&CyberSecurity.pptx
00_Main ppt_MeetupDORA&CyberSecurity.pptx00_Main ppt_MeetupDORA&CyberSecurity.pptx
00_Main ppt_MeetupDORA&CyberSecurity.pptx
 

Raport Macroeconomic Garanti Bank

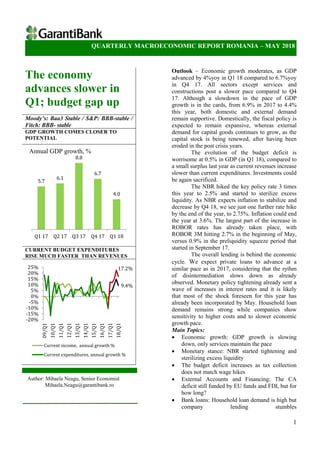
  • 1. Quarterly Macroeconomic 1 QUARTERLY MACROECONOMIC REPORT ROMANIA – MAY 2018 The economy advances slower in Q1; budget gap up Moody’s: Baa3 Stable / S&P: BBB-stable / Fitch: BBB- stable GDP GROWTH COMES CLOSER TO POTENTIAL CURRENT BUDGET EXPENDITURES RISE MUCH FASTER THAN REVENUES Outlook – Economic growth moderates, as GDP advanced by 4%yoy in Q1 18 compared to 6.7%yoy in Q4 17. All sectors except services and constructions post a slower pace compared to Q4 17. Although a slowdown in the pace of GDP growth is in the cards, from 6.9% in 2017 to 4.4% this year, both domestic and external demand remain supportive. Domestically, the fiscal policy is expected to remain expansive, whereas external demand for capital goods continues to grow, as the capital stock is being renewed, after having been eroded in the post crisis years. The evolution of the budget deficit is worrisome at 0.5% in GDP (in Q1 18), compared to a small surplus last year as current revenues increase slower than current expenditures. Investments could be again sacrificed. The NBR hiked the key policy rate 3 times this year to 2.5% and started to sterilize excess liquidity. As NBR expects inflation to stabilize and decrease by Q4 18, we see just one further rate hike by the end of the year, to 2.75%. Inflation could end the year at 3.6%. The largest part of the increase in ROBOR rates has already taken place, with ROBOR 3M hitting 2.7% in the beginning of May, versus 0.9% in the preliquidity squeeze period that started in September 17. The overall lending is behind the economic cycle. We expect private loans to advance at a similar pace as in 2017, considering that the rythm of disintermediation slows down as already observed. Monetary policy tightening already sent a wave of increases in interest rates and it is likely that most of the shock foreseen for this year has already been incorporated by May. Household loan demand remains strong while companies show sensitivity to higher costs and to slower economic growth pace. Main Topics:  Economic growth: GDP growth is slowing down, only services maintain the pace  Monetary stance: NBR started tightening and sterilizing excess liquidity  The budget deficit increases as tax collection does not match wage hikes  External Accounts and Financing: The CA deficit still funded by EU funds and FDI, but for how long?  Bank loans: Household loan demand is high but company lending stumbles 5.7 6.1 8.8 6.7 4.0 Q1 17 Q2 17 Q3 17 Q4 17 Q1 18 9.4% 17.2% -20% -15% -10% -5% 0% 5% 10% 15% 20% 25% 09/Q1 10/Q1 11/Q1 12/Q1 13/Q1 14/Q1 15/Q1 16/Q1 17/Q1 18/Q1 Current income, annual growth % Current expenditures, annual growth % Author: Mihaela Neagu, Senior Economist Mihaela.Neagu@garantibank.ro Annual GDP growth, %
  • 2. Quarterly Macroeconomic 2 QUARTERLY MACROECONOMIC REPORT ROMANIA – MAY 2018 Economic Growth GDP growth is slowing down, only services maintain the pace Economic growth moderates, as GDP advanced by 4%yoy in Q1 18 compared to 6.7%yoy in Q4 17. The high frequency data shows that all sectors except services and constructions1 move at a slower speed compared to Q4 17. High frequency indicators show that industry, trade and transport are softening, but the dynamics remains significant Source: NIS, Garanti Bank Research Note:* Garanti Bank Research computed the adjusted dynamics of annual growth rate of services’ turnover, by excluding transportation from the NIS communicated numbers In the case of industry (4.9%yoy in Q1 18 vs. 9.7% in Q4 17), we see a deceleration in some sectors contributing to exports, such as cars (and spare parts) and computer electronics. In other cases, exports oriented sectors see faster growth, such as machinery and equipment which remains the top performer industry in Q1 18, with an advance of 50.5% yoy. The worst performers in 2017 tend to keep this tendency in 2018, recording negative growth rate in Q1 18, after declining last year as well: wood, furniture, leather manufacturing and clothing industry. There are also cases in which sectors that grew last year are declining in Q1 18: energy production, oil and gas extraction, mining of coal, metallurgy. Overall, even if there is a slowdown, capacity utilization in industry still remains below the average of the current economic cycle (see graph below), so expectations are for continued growth this year. Additionally, new industrial orders are increasing, supporting short term prospects. 2017 2017 Q1 18 Q1 18 % contribution yoy yoy contribution Computer and electronics 1.1 19.4 11.7 0.7 Electrical equipment 0.5 10.9 14.6 0.7 Machinery and equipment 1.7 38.2 50.5 2.3 Cars and spare parts 3.1 17.0 9.4 1.7 Other 1.3 2.0 -0.7 -0.5 TOTAL 7.8 7.8 4.9 4.9 Source: NIS, Garanti Bank Research 1 Constructions post a fall of -2.1%yoy in Q1 18 compared to a higher decline in Q4 17, of -5.3%yoy. -10% -5% 0% 5% 10% 15% 20% Q4 2017 Q1 2018 Industry Constructions Services* Excluding Transport Vehicle’s Trade Retail Trade Wholesale Trade Services Including Transport Transport Annual growth rates
  • 3. Quarterly Macroeconomic 3 QUARTERLY MACROECONOMIC REPORT ROMANIA – MAY 2018 Constructions accelerate in relative terms, but remain in negative territory (-5.3%yoy in Q4 17 vs -2.1% Q1 18). The segments that grow are the non-residential and civil engineering while the residential segment posts a fall (-24.6%yoy in Q1 18), due to a significant base effect, given by the stellar 81% annual growth in Q1 18. Civil engineering added 8.1%yoy in Q1 18, but due to the stretched budget deficit, further cuts into investment budget affecting infrastructure works can be expected this year too. Due to its large weight in the constructions index, the civil engineering is a key determinant for the evolution of the overall constructions sector. The nonresidential sector is currently increasing by 7.7%yoy (Q1 18). The need for office, commercial space and warehouses supports further expansion of the nonresidential sector, even if costs are rising: the cost of materials started to increase in 2017, after 4 years of contraction while labor cost puts significant pressure, having added 50%2 in the past 4 years. Services (excluding transportation) maintained the pace in Q1 18 compared to Q4 17 and were likely the main driver of GDP growth. The IT&C turnover saw a higher growth rate while the rest of services had a marginally slower dynamics. The IT turnover went from the negative to positive territory (-2.5% yoy in Q4 vs 8.1%yoy in Q1 18) , communications also advanced marginally faster (6.4%yoy in Q4 2017 vs 7.4%yoy in Q1 18). The largest remaining category, of other business services, marked a slower dynamics (12.1% yoy inQ4 17 vs 9.3%yoy in Q1 18). This latter category was supported, among others, by the legal & accounting and real estate services. To conclude, industry and services could be the main drivers of GDP growth this year. Although a slowdown is in the cards, from 6.9% in 2017 to 4.4% this year, both domestic and external demand remain supportive. Domestically, the fiscal policy is expected to remain expansive at 3.5% budget deficit, whereas external demand for capital goods continues to grow, a path seen in 2017 as well, as the capital stock is being renewed, after having been eroded in the post crisis years. IT&C services turnover accelerates in Q1 18 Industrial capacity utilization increases but it is still below the average of the current economic cycle Source: NIS, GarantiBank Research calculation Source: NIS, EC, GarantiBank Research 2 January 2018 compared to January 2014, net wage. -5% 0% 5% 10% 15% 20% 25% 30% 35% 14/Q1 14/Q2 14/Q3 14/Q4 15/Q1 15/Q2 15/Q3 15/Q4 16/Q1 16/Q2 16/Q3 16/Q4 17/Q1 17/Q2 17/Q3 17/Q4 18/Q1 Communications IT Other business services 60 65 70 75 80 85 -30% -20% -10% 0% 10% 20% 30% 40% Dec-08 Mar-11 Jun-13 Sep-15 Dec-17 Industrial production turnover -internal mk (%yoy) Industrial production turnover -external market (% yoy) capacity utilization (right hand side) 2008- 2017 avg. capacity utilization (right hand side) Annual growth rate
  • 4. Quarterly Macroeconomic 4 QUARTERLY MACROECONOMIC REPORT ROMANIA – MAY 2018 Monetary stance NBR started tightening and sterilizing excess liquidity As the economy showed clear signs of overheating and inflation exited the targeted variation band by a wide margin, the NBR hiked the key policy rate 3 times this year, in January, February and May, to 2.5%. In March, the central bank paused and stated that inflation was within expectations and it should return in the targeted interval of 1.5-3.5% in Q4 2018. Among the arguments against hiking, the NBR frequently cited the risk of exchange rate appreciation, as higher rates could attract hot money, considering that the region has significantly lower nominal rates3 . The appreciation of the leu could in turn lead to a larger current account deficit. As NBR expects inflation to stabilize after the peak reached in Q2 18, we see just one further rate hike by the end of the year, to 2.75% from the current 2.5% while inflation could end the year at 3.6%. The largest part of the increase in ROBOR rates has already taken place, with ROBOR 3M hitting 2.7% in the beginning of May, versus 0.9% in the preliquidity squeeze period that started in September last year. Now ROBOR rates follow much closely the key rate as NBR started absorbing the excess liquidity in April. Variation of the Treasury account, held with NBR, makes anticipating liquidity evolution rather difficult. Starting 2007, the Treasury account increased continuously as percentage of NBR balance sheet, reaching up to 25% in Dec 2016. At the same time, the size of government securities held by Romanian banks rose too, up to one of the highest regional levels. As the corridor around the base rate is reduced, interest rates will be increasingly more dependent on the key rate and less on liquidity, but the current interval is still significant, at +/- 100 bps around the key rate. 3 In Hungary the key rate is 0.9% while in Poland the key rate is 1.5%. NBR started to sterilize in April Inflation is well outside the targeted variation interval Source: NBR, GarantiBank Research Source: NIS, GarantiBank Research -25 -20 -15 -10 -5 0 5 10 15 20 25 -12 -10 -8 -6 -4 -2 0 2 4 6 8 10 12 Apr-10 Apr-11 Apr-12 Apr-13 Apr-14 Apr-15 Apr-16 Apr-17 Apr-18 Net liquidity position key rate NBR deposit facility rate Lombard rate ROBID ON RON, bn (rhs) -5 -4 -3 -2 -1 0 1 2 3 4 5 6 Apr-15 Aug-15 Dec-15 Apr-16 Aug-16 Dec-16 Apr-17 Aug-17 Dec-17 Apr-18 Core 3 Vegetables, fruits, eggs Tobacco Alcohol Fuels Administered %
  • 5. Quarterly Macroeconomic 5 QUARTERLY MACROECONOMIC REPORT ROMANIA – MAY 2018 Fiscal policy The budget deficit increases as tax collection does not match wage hikes While monetary policy started to tighten, the fiscal policy remains procyclical. The evolution of the budget deficit is worrisome, as the budget deficit already stands at 0.5% in GDP (in Q1 2018), compared to a small surplus last year, of 0.2% in GDP. Between current revenues and expenditures there is a 0.6% in GDP gap which is widening: current revenues are higher by 9.4%yoy in Q1 18 while current expenditures advanced by 17.2%yoy. We started seeing this difference in the pace of the two items in Q1 2017. The main reasons are on one hand the wage hikes seen in the public sector, where wages rose by 22% in 2017 and on the other hand a lower ability to collect indirect taxes, such as VAT and excises which make around one third of all budget revenues and which dropped from 2.2% in GDP in Q1 17 to 2% in GDP in Q1 18. As the gap between current revenues and expenditure is maintained or expands, the next likely correction could come from further reducing investments, thereby cutting into country’s growth potential in the future. Tax increases could be an option for the coming years, to improve the budget balance, which we expect at 3.5% in 2018. State Budget Execution in March 2018 Mar-18 mn RON YoY Total revenue 66,377 11.5% Corporate income tax 3,689 -3.3% Personal income tax 6,574 -14.9% Other tax on income, profit and capital 613 52.2% Property tax 3,054 4.5% Value added tax 13,287 2.2% Excise duties 5,847 2.6% Social security contributions 21,969 31.1% Non fiscal revenue 4,736 17.0% EU funds 4,265 57.3% Other 2,341 -4% Total expenditures 70,836 22.1% Compensation of public employees 19,066 18.1% Goods and services 8,803 12.5% Interest paid 2,715 18.4% Subsidies 2,449 25.7% Social benefits 24,351 11.8% Investment expenditures 4,900 188.2% Other 4,975 -1969.1% Transfers 3,576 6.6% Excedent (+)/Deficit (-) (RON mn) - 4,458 -293% Budget deficit (% GDP) 0.5% Source: Ministry of Finance, Garanti Bank Research The changes to the fiscal code are significant and ongoing, as opposed to a desirable more stable and therefore predictable fiscal environment. The European Commission already calculated that the structural deficit will grow to 3.8% in GDP by the end of 2018. For the moment, Romania enjoys a growth rate more in line with its potential but the public debt already started to grow from 35% in Dec 2017 (and 37.4% in Dec 16) to 35.7% in Feb 18.
  • 6. Quarterly Macroeconomic 6 QUARTERLY MACROECONOMIC REPORT ROMANIA – MAY 2018 Given the high structural deficit, a crisis could easily elevate the public debt level, above the sustainable level of 43%. Despite some failed auctions, by the end of April, the Treasury managed to raise 31% of the gross financing requirements of RON 74.1 bn (or 8.1% in GDP). In February, it raised EUR 2 bn in Eurobonds, less than half of the targeted amount: EUR 750 mn with 12 years remaining maturity (final yield of 2.585 or 133 bps over midswaps) and EUR 1.25 bn in Eurobonds with 20 years remaining maturity at a yield of 3.45% (190bps over midwaps). The ratings agencies maintained a stable outlook on the country and the 5Y CDS compressed by 8 bps year to date, to 79 bps. The average maturity of RON denominated debt (45% of total) is 3.4 years (Feb 2018) and the corresponding yields are higher by 137 bps compared to 20174 . Given expectations for further 25 bps increase in the key rate by the end of the year, further pressure on financing costs is expected. Public debt is increasing again RON yield curve is shifting up NBR fixing, mid yields Source: Ministry of Finance, Eurostat Source: NBR 4 When we compare average mid yield for 2017 with the average for Jan-April 18. 12.4 22.1 29.7 34.0 36.9 37.5 39.1 37.7 37.4 35.0 35.7 08Q4 09Q4 10Q4 11Q4 12Q4 13Q4 14Q4 15Q4 16Q4 17Q4 Feb-18 0.0 1.0 2.0 3.0 4.0 5.0 6.0 0.0 1.0 2.0 3.0 4.0 5.0 6.0 Apr-13 Apr-14 Apr-15 Apr-16 Apr-17 Apr-18 6M 12M 3Y 5Y 10Y % GDP
  • 7. Quarterly Macroeconomic 7 QUARTERLY MACROECONOMIC REPORT ROMANIA – MAY 2018 External Accounts and Financing The CA deficit still funded by EU funds and FDI, but for how long? The current account deficit remains at 3.3% in GDP on a 12M rolling basis (March 18) and continues to be funded by FDI and EU funds for the moment, although this may not be true anymore in the future, especially since the FDI started the year on a weak note. The composition of the trade gap reveals structural inefficiencies, as 26% is generated by the food sector (excluding cereals), where Romania benefits of a large potential. Other significant deficits are on individual items such as medicines and petroleum (See table below). In some cases, either the post EU accession or the post crisis period were opportunities to turn from a deficit to surplus (manufacturing of road vehicles, cereals productions or electrical machinery production). In other cases just the reverse happened (i.e. manufactured iron and steel products, nonferrous metals) or the historical deficit widened significantly (plastics, petroleum, medicinal and pharma products). The structure of the trade gap could improve in the future, if coordinated efforts are made. The post crisis experience showed that an external shock that catches Romania with large imbalances can lead to currency depreciation. During the IMF’s surveillance under the stand by agreements, the funding of the CA by FDI and EU funds improved significantly, whereas now it starts to decrease. The main culprits are the weak EU funds, but the FDI show weakness as well. In Q1 18, FDI dropped by 16% yoy and there is a risk of this trend to continue, considering the sudden changes in fiscal policy that took place this year. Already in 2017, FDI stagnated whereas in 2016 it had seen a 53% growth. We expect the leu to depreciate to 4.78 against the euro by the end of the year, when accumulation of imbalances will be more visible and the stable funding of the CA could cease to fully cover the deficit. Other factors such as investor sentiment and reallocation of portfolio flows could play into the equation, the latter having increased in the past 12M to 2.2% in GDP (March 18) from 1.5% in Dec 2017. EU funds are crawling; CA deficit still funded by FDI and EU funds Post crisis, the external balance of some goods improved but worsened for others Source: NBR, GarantiBank Research Note: * it includes the effect of debt repayment or loan inflows, as well as changes in the FX reserves, errors and omissions and other minor components Source: NIS, GarantiBank Research -13.5% -2.1% -3.4% -3.3% 7.1% -3.7% -1.8% -2.4% 0.6% 2.5% 1.2% 1.1% 5.4% 2.7% 2.4% 2.4% 0.4% 0.6% 1.5% 2.2% -12% -7% -2% 3% 8% 13% 2007 2016 2017 12M rolling March 2018 Portfolio flows (% GDP) FDI (%GDP) EU funds (% GDP) Loans, reserve ch, fin. derivatives, errors* (%GDP) Current account deficit (% GDP) balance (bnEUR) 00 01 02 03 04 05 06 07 08 09 10 11 12 13 14 15 16 17 Road vehicles -0.3 -0.5 -0.5 -0.6 -1.5 -2.0 -2.7 -4.0 -3.6 1.1 1.7 1.7 2.1 3.2 2.9 2.6 2.8 3.8 Cereals -0.1 -0.1 0.0 -0.3 -0.2 0.0 0.0 -0.3 0.1 0.2 0.5 0.6 0.8 1.4 1.5 1.2 1.2 1.3 Electricalmachinery -0.9 -0.6 -0.6 -0.7 -0.5 -0.5 -0.5 -0.4 -0.3 0.0 -0.2 0.1 0.3 -0.1 0.7 1.0 1.4 0.9 Manufactured -0.1 -0.2 -0.1 -0.2 -0.2 -0.2 -0.3 0.0 0.1 0.2 0.2 0.2 0.2 0.3 0.4 0.6 0.4 0.3 Non-ferrousmetals 0.3 0.2 0.2 0.1 0.1 0.1 0.0 0.0 -0.1 -0.2 -0.3 -0.2 -0.2 -0.2 -0.4 -0.4 -0.4 -0.4 Plasticsinnon primaryforms -0.1 -0.2 -0.2 -0.3 -0.3 -0.4 -0.5 -0.6 -0.7 -0.5 -0.5 -0.5 -0.5 -0.5 -0.5 -0.6 -0.7 -0.7 Manufactured Iron and steel 0.4 0.3 0.4 0.4 0.7 0.7 0.2 -0.2 -0.8 -0.4 -0.2 -0.4 -0.3 -0.5 -0.6 -0.6 -0.7 -0.8 Vegetablesand fruits -0.1 -0.1 -0.1 -0.1 -0.1 -0.2 -0.3 -0.4 -0.5 -0.3 -0.3 -0.3 -0.4 -0.4 -0.5 -0.8 -1.0 -1.0 Plasticsinprimary forms 0.0 -0.1 -0.1 -0.1 -0.1 -0.2 -0.3 -0.3 -0.3 -0.4 -0.6 -0.6 -0.8 -0.9 -0.9 -1.0 -1.0 -1.2 Petroleum -0.4 -0.8 -0.4 -0.4 -0.7 -0.9 -1.3 -1.8 -2.3 -1.4 -2.0 -2.4 -2.8 -2.2 -2.1 -1.5 -1.3 -2.0 Medicinaland pharma products -0.3 -0.4 -0.5 -0.5 -0.7 -0.9 -1.2 -1.4 -1.7 -1.5 -1.5 -1.6 -1.6 -1.7 -1.8 -1.8 -2.0 -2.2
  • 8. Quarterly Macroeconomic 8 QUARTERLY MACROECONOMIC REPORT ROMANIA – MAY 2018 Bank Flows Household loan demand is high but company lending stumbles Although lending restarted, disintermediation continued in 2017. The loans’penetration probably stabilized to around 27% in GDP in Q1 18, after having declined over several years. Household lending, already considered overheated by NBR, rushes further while companies lending, considered under potential by NBR, records hiccups. Nevertheless, lending growth maintains an uptrend, at a 6.1%yoy in March 18, double the pace seen one year ago and we expect lending to maintain in the positive territory this year. The loans/deposits ratio fell to a minimum 76.4% in February (78% in March 18), while banks place a significant part of their balance sheet in government bonds. Disintermediation pace slows down Household lending accelerates Source: NBR, Garanti Bank Research Source: NBR Household lending is accelerating, on both main types, mortgage (+13.5%yoy in March 18) and consumer loans (+4.9%yoy in March18), respectively. The continuous wage hikes are likely to maintain household loan demand awake this year, despite the increase in ROBOR rates5 of 100-120 bps between Sep 17- March 18. Companies enjoyed a faster dynamics in Q4 17 and slowed down to a mere 2.6%yoy in March 18, in line with a milder pace in economic activity and higher interest rates (see table below). As ROBOR jumped, the pace of RON denominated loans fell post September 176 . Sectorwise we see that agriculture, industry and services7 are top performers while being the less risky as well; constructions loan are still weak (see graph below). 5 The average interest rate for new RON mortgage loan rose from 3.6% in Sep 17 to 4.8% in March 18. In the case of consumer loans, the jump was from 8.5% (Sep 17) to 9.5% (March 18). 6 The average interest rate for new company loan in RON jumped from 3.9% in Sep 17 to 5.1% in March 18. 7 Except for real estate. 0% 5% 10% 15% 20% 25% 30% 35% 40% 45% -3% -2% -1% 0% 1% 2% 3% 4% Mar-08 Sep-08 Mar-09 Sep-09 Mar-10 Sep-10 Mar-11 Sep-11 Mar-12 Sep-12 Mar-13 Sep-13 Mar-14 Sep-14 Mar-15 Sep-15 Mar-16 Sep-16 Mar-17 Sep-17 Mar-18 quarter to quarter change in loans' penetration Private loan penetration in GDP (right hand side) 6.1% 2.6% 9.4% -10% -5% 0% 5% 10% 15% Dec-11 Jun-12 Dec-12 Jun-13 Dec-13 Jun-14 Dec-14 Jun-15 Dec-15 Jun-16 Dec-16 Jun-17 Dec-17 Private loans Romania (YoY) Corporate loans (YoY) Household loans (YoY)
  • 9. Quarterly Macroeconomic 9 QUARTERLY MACROECONOMIC REPORT ROMANIA – MAY 2018 Bank loan servicing ratio in total net monetary income has been dropping Company loans are growing, but at a slower pace Source: NBR Financial Stability Report Dec 17, GarantiBank Research Source: NBR, GarantiBank Research The overall lending is behind the economic cycle which is in its late expansion phase and the monetary policy tightening so far slowed down only lending to companies. The RON interest rates increase probably will not act as a powerful break for household lending this year. • One of the reasons is that bank loan servicing ratio in total net monetary income has been dropping in the past years so there is space for it to go back to higher levels before it significantly affects loan demand. Meanwhile, wages are still expected to increase and the unemployment rate is at historical low. From a regulatory point of view, median debt service to income8 (DTSI) level was 32% for mortgage loans and 24.7% for consumer loans in September 2017. A 200 bps increase in interest rate would have a small effect on consumer loans debtors (48% of loan stock) but it would push nearly half of mortgage holders to a DSTI above 40%, likely considered unsustainable by NBR9 . Therefore, we could expect to see regulation that takes down the maximum DSTI. • ROBOR interest rates’ increase ( Sep 17- March 18) did not impact household loans dynamics. RON loan interest rates for households (see table below) are now around the level seen in Q4 2014, when the key interest rate was 2.75% (25 bps higher than the current one) while average net wage is 53% higher. Consumer Mortgage Companies RON EUR RON EUR RON EUR Dec-14 9.4 3.4 4.5 5.3 5.9 3.9 Dec-15 8.7 4.8 3.7 4.3 4.4 3.2 Dec-16 8.3 4.5 3.4 3.6 3.7 3.1 Sep-17 8.5 4.8 3.6 4.1 3.9 2.4 Dec-17 8.9 4.0 4.5 4.1 4.9 2.6 Mar-18 9.5 4.8 4.8 4.1 5.1 2.7 8 Wages income 9 NBR emphasisez this limit in the Financial Stability Report of Dec 17. 16 20 22 21 20 19 18 16 14 12 11 0 5 10 15 20 25 2008 2010 2012 2014 2016 2017 Q2 -4% -2% 0% 2% 4% 6% 8% 10% 12% 14% 16% constructions services industry agriculture <1Y,yoy 1Y-5Y,yoy >5Y,yoy Dec-17 Mar-18 per maturity, yoy%per sector, yoy% 3M rolling %
  • 10. Quarterly Macroeconomic 10 QUARTERLY MACROECONOMIC REPORT ROMANIA – MAY 2018 To conclude, we expect private loans to advance at a similar pace as in 2017, considering that the pace of disintermediation slows down as already observed. Monetary policy tightening already sent a wave of increases in interest rates and it is likely that most of the shock foreseen for this year has already been incorporated by May. With wages still advancing fast, household loan demand remains strong while corporations show sensitivity to higher costs and to slower economic growth pace.
  • 11. Quarterly Macroeconomic 11 QUARTERLY MACROECONOMIC REPORT ROMANIA – MAY 2018 Macroeconomic Data 2015 2016 2017 2018F Economy Nominal GDP, (EUR bn) 160.3 169.8 187.5 197.2 Real GDP, (% yoy) 4.0 4.8 6.9 4.4 Agriculture, % yoy -11.1 4.7 18.3 -0.4 Industry (except construction), % yoy 5.8 5.3 8.0 5.9 Construction, % yoy 6.9 12.7 -0.3 4.8 Wholesale and retail trade; tourism and transport, % yoy 12.3 10.6 8.4 5.5 Other services, % yoy 4.6 2.1 6.8 5.8 Avg net monthly wages (EUR, nominal) 418 460 512 557 Min wage, net EUR 144 204 229 243 Unemployment rate, ILO, avg 6.8 6.0 5.0 4.7 External Accounts Current Account (EUR bn) -1.9 -3.6 -6.3 -8.1 Current Account (% of GDP) -1.2 -2.1 -3.4 -4.1 Export (FOB, EUR bn) 54.6 57.4 62.6 66.4 Import (CIF, EUR bn) 63.0 67.3 75.6 80.9 Export (% yoy) 4.1 5.1 9.2 6.0 Import (% yoy) 7.6 7.0 12.3 7.0 Trade balance FOB-CIF (EUR bn) -8.4 -10.0 -13.0 -14.5 Trade balance FOB-CIF (% of GDP) -5.2 -5.9 -6.9 -7.3 Net FDI (EUR bn) -3.0 4.5 4.6 5.3 Net FDI (% of GDP) 1.8 2.7 2.4 2.7 Internat. reserves incl. Gold (EUR bn) 35.5 37.9 37.1 37.7 Gross Foreign Debt (EUR bn) 92.1 92.9 94.0 99.0 Gross Foreign Debt (% of GDP) 57.4 54.7 50.1 50.2 Fiscal Accounts Budget Balance (% of GDP) -1.5 -2.4 -2.9 -3.5 Public Governmental Debt (% of GDP) 37.7 37.4 35.0 36.8 Inflation/Monetary/FX Inflation (CPI) yoy, eop -0.9 -0.5 3.3 3.6 Inflation (CPI) yoy, yearly average -0.6 -1.5 1.3 4.3 Central bank reference rate, eop 1.75 1.75 1.75 2.75 3M Robor, eop 1.02 0.9 2.05 2.50 EUR/RON, eop 4.52 4.54 4.66 4.78 Source: NBR, NIS, Ministry of Finance, Eurostat, GarantiBank Research
  • 12. Quarterly Macroeconomic 12 QUARTERLY MACROECONOMIC REPORT ROMANIA – MAY 2018 Disclaimer This document has been drafted by GARANTI BANK SA and is intended for informative purposes only. This document should not be construed as offer, invitation or recommendation to subscribe for or to purchase or dispose of any securities or to enter in any transaction and neither this document nor anything contained herein shall form the basis of any contract or commitment whatsoever. Potential recipients are advised to independently review and/or obtain independent professional advice on the legal, regulatory, credit, tax and accounting aspects regarding customization of specific business. All addressees should be individually aware of the economic benefit and risks of future transactions. Distribution of this document does not oblige GARANTI BANK SA to enter into any transaction. Information contained herein is based on various sources, including but not limited to public information, annual reports and statistical data that GARANTI BANK SA considers accurate and reliable. However, GARANTI BANK SA makes no representation as to any matter or as to the accuracy or completeness of any statement made herein or made at any time in connection herewith and all liability (in negligence or otherwise), in respect of any such matter or statements, is expressly excluded. This document is being furnished to you solely for your information and may not be copied, forwarded, disclosed or otherwise used or any part of it, in any forms whatsoever or delivered to anyone else.