Beginners Guide to TikTok for Search - Rachel Pearson - We are Tilt __ Bright...
Proportional Pie Charts agricultural.pptx
1. Proportional Pie Charts
Titanic Belfast
Ulster Museum
W5
Belfast
Zoo
Number of Visitors on a Day in May
Titanic Belfast
Ulster
Museum
W5
Belfast Zoo
Number of Visitors on a Day in July
2. Proportional or Comparative Pie Charts
Pie charts are a good way of comparing data as it easy to see
the proportions of the pie that each sector represents.
In GCSE Statistics we will also look at comparative or
proportional pie charts, where the area of the pie chart is
proportional to the frequency.
3. Calculating angles
To calculate the angles in a pie chart you use the formula:
𝐴𝑛𝑔𝑙𝑒 =
𝐹𝑟𝑒𝑞𝑢𝑒𝑛𝑐𝑦 𝑜𝑓 𝑔𝑟𝑜𝑢𝑝
𝑇𝑜𝑡𝑎𝑙 𝐹𝑟𝑒𝑞𝑢𝑒𝑛𝑐𝑦
× 360
Example 1:
The number of visitors to the following Northern Ireland Tourist attractions on a
day in May 2018 is given in the table below:
Calculate the angle for each attraction and complete the pie chart.
Attraction Titanic Belfast Ulster Museum W5 Belfast Zoo
No. of visitors 2250 1350 850 550
4. Solution 1:
First work out the total number of visitors: 2250 + 1350 + 850 + 550 = 5000
Using the formula: 𝐴𝑛𝑔𝑙𝑒 =
𝐹𝑟𝑒𝑞𝑢𝑒𝑛𝑐𝑦 𝑜𝑓 𝑔𝑟𝑜𝑢𝑝
𝑇𝑜𝑡𝑎𝑙 𝐹𝑟𝑒𝑞𝑢𝑒𝑛𝑐𝑦
× 360
Titanic =
2250
5000
× 360 = 162° Ulster Museum =
1350
5000
× 360 = 97.2°
W5 =
850
5000
× 360 = 61.2° Belfast Zoo = =
550
5000
× 360 = 39.6°
Always check that the total angles add up to 360 before you start to draw the pie
chart.
Attraction Titanic Belfast Ulster Museum W5 Belfast Zoo Total
No. of visitors 2250 1350 850 550 5000
Angle 162 97.2 61.2 39.6 360
5. Drawing the Pie Chart
You may be asked to complete a pie chart on a given template once you have
calculated the angles. Using a protractor measure each angle in a clockwise
direction starting from the line given. Remember to label each sector of the pie
chart with the correct label.
Titanic Belfast
Ulster Museum
W5
Belfast Zoo
Number of Visitors on a Day in May
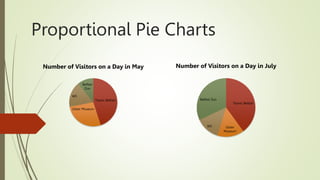
6. Comparative Pie Charts
In a comparative pie chart the area is proportional to the number of people /
frequency. The bigger the radius of the pie chart, the more people the pie chart will
represent. This gives a good visual comparison of the two sets of data.
Example 2
The pie chart representing the number of visitors in May at the NI tourist
attractions has a radius of 2.5cm. On a day in July there are 7500 visitors in total at
the attractions.
What radius would the pie chart representing the visitors on the day in July have?
7. Solution 2
To work out the missing radius we set up an equation where we can divide the
areas on one side and the frequencies on the other. The ration between the areas
must be the same as the ratio between the frequencies.
The information we have is:
May: Radius = 2.5 Area = 𝜋 × 2.52 Frequency = 5000
July: Radius = r Area = 𝜋 × 𝑟2
Frequency = 7500
The equation is:
𝜋×𝑟2
𝜋×2.52 =
7500
5000
We can then cancel out 𝜋 and rearrange to give:
𝑟2
=
7500 × 6.25
5000
= 9.375 𝑟 = 9.375 = 3.06 = 3.1 (1𝑑𝑝)
The radius for the July pie chart would be 3.1cm.
8. Example 3
Two pie charts are drawn to represent the number adult and child tickets sold at NI
tourist attractions on a day in 2018. The pie chart for adult tickets has a radius of
7cm and represents 4900 tickets. How many child tickets are represented by a pie
chart with a radius of 4cm?
Solution 3
The information we have is:
Adults: Radius = 7cm Area = 𝜋 × 72 Frequency = 4900
Child:Radius = 4cm Area = 𝜋 × 42 Frequency = f
The equation is:
𝜋×72
𝜋×42 =
4900
𝑓
We can then cancel out 𝜋 and rearrange to give:
𝑓 =
4900 × 16
49
= 1600
9. Making Comparisons
Titanic Belfast
Ulster Museum
W5
Belfast
Zoo
Number of Visitors on a Day in May
Titanic Belfast
Ulster Museum
W5
Belfast Zoo
Number of Visitors on a Day in July
If you are asked to make comparisons for proportional pie charts make sure to talk
about the proportion. For example you could make the mistake of saying that
more people visited W5 in the day in May than in July as it is a bigger proportion
of the pie chart. However as the July pie chart represents more people this would
not be correct.
Some comparative statements you could make would be:
• A larger proportion of the visitors in May went to the Ulster Museum.
• A greater number of people visited the tourist attractions on the day in June.